

Andrii Yalanskyi/iStock via Getty Images
Investment Thesis
As the fundamentals of the SoFi Select 500 ETF (NYSEARCA:SFY) improve, it represents one of the most responsible ways to re-enter growth stocks after this year’s substantial shakeup. Contrary to expectations and its composition in November 2021, SFY’s estimated sales and growth rate exceeds that of the SPDR Portfolio S&P 500 Growth ETF (SPYG) while offering the same valuation as the broad-based SPDR S&P 500 ETF (SPY). SFY’s valuation and growth metrics are attractive, the diversification is sufficient, and you can’t beat its zero expense ratio. Therefore, while it’s still more prudent to add value stocks to your portfolio, I’ve upgraded my rating on SFY to a buy with the growth-oriented investor in mind.
ETF Overview
Strategy Discussion
SFY’s construction process begins with 3,000 of the largest U.S. equities by market capitalization. The largest 500 are selected, subject to a 20% buffer rule to prevent unnecessary turnover. In other words, as long as current constituents stay within the top 600, they remain in the Index. These buffer rules increase efficiency, given how trading stocks with negligible weights unlikely impacts the factors that drive index performance. And those factors are driven by three growth-oriented screens:
- Trailing one-year revenue growth
- Trailing one-year earnings per share growth
- Forward one-year earnings per share growth
Composite scores are calculated, but the Index is factor-influenced rather than factor-weighted. Market capitalization is the primary determinant, which explains why I’ve called SFY a “growth light” ETF in prior articles.
Sector Exposures and Top Ten Holdings
SFY’s sector exposures have changed considerably this year. To illustrate, SFY was overweight Technology by 3.39% in February compared to SPY but is now 1.98% underweight. SFY is now a better-balanced fund across sections, with the subsequent largest exposures in Health Care (15.82%) and Consumer Discretionary (13.61%).
Morningstar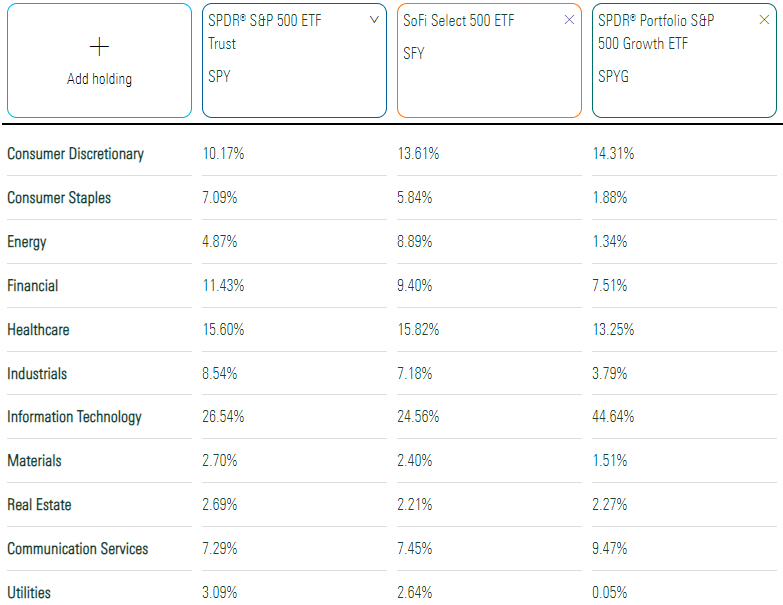
SFY’s top ten holdings are below, totaling 26.01%. Apple (AAPL), Tesla (TSLA), and Microsoft (MSFT) are the three most prominent. However, Chevron (CVX) and Exxon Mobil (XOM) are also key holdings in the portfolio. In February, their weights were just 0.32% and 0.40%, and it’s an excellent example of how the economic landscape has changed so much over the last year.
SoFi Invest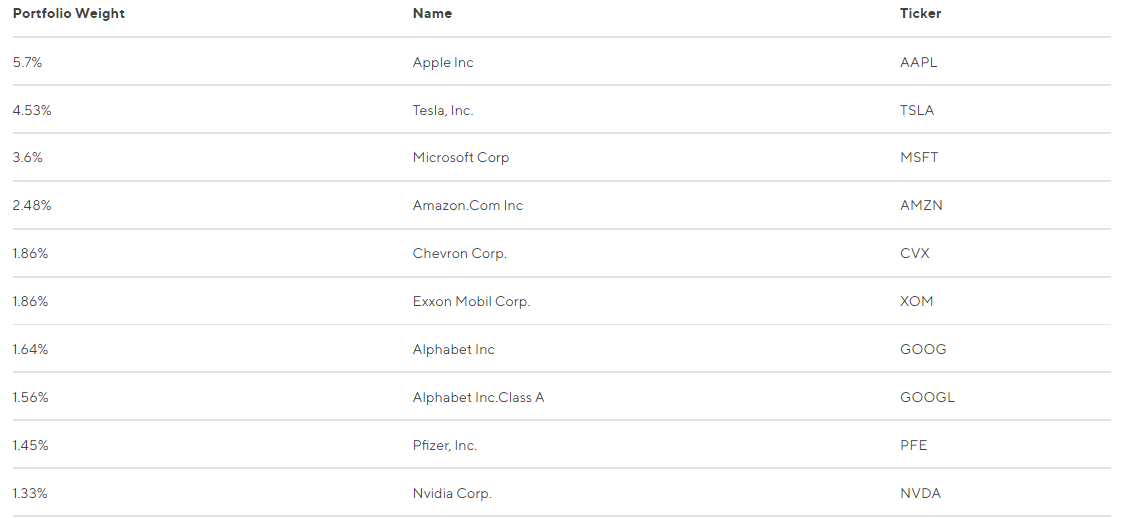
Growth opportunities are expanding to other sectors. The median one-year sales growth rate for all SFY’s current holdings is 9.16%. However, that figure is 33.49% for Energy stocks and 12.62% for Communication Services stocks. Technology is third at 11.87%, while Utilities (6.27%) and Consumer Staples (4.54%) have the lowest sales growth estimates. Investing in an ETF that reflects these changes is advantageous.
Performance History
SFY is a relatively new offering with a track record of just three and a half years. In that time, it earned shareholders an annualized 10.22% gain compared to 10.64% and 10.72% for SPY and SPYG. Volatility, as measured by standard deviation, is in the middle, and SFY has at least matched the risk-adjusted returns (Sharpe and Sortino Ratios) of SPYG. This record isn’t bad, but growth investors probably hoped for more in the ultra-bullish 2020. That year, SFY underperformed SPYG by about 9%.
Portfolio Visualizer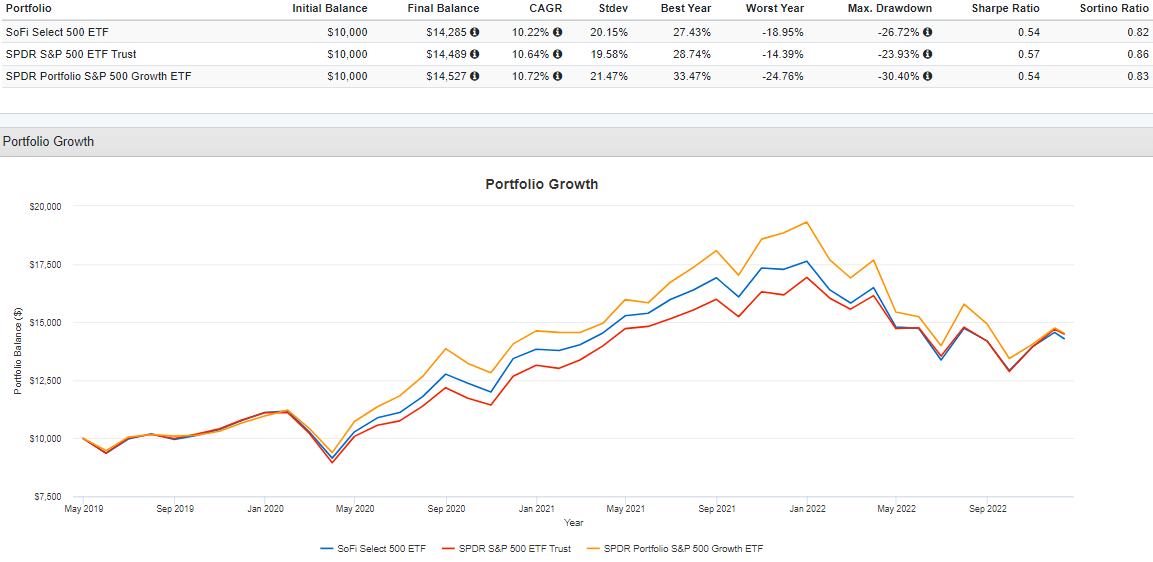
On the other hand, years like 2020 are unlikely to repeat. I expect SFY to produce returns between SPY and SPYG most years, with potential buying opportunities occurring when the portfolio’s growth and valuation are appealing. Therefore, let’s look at SFY’s fundamentals next.
ETF Analysis
The following table highlights selected fundamental metrics for SFY’s top 25 industries, alongside SPY and SPYG. As mentioned before, it was customary for SFY to have higher growth expectations than SPY, with a correspondingly higher valuation. The reverse is true with SPYG. However, the data in this table indicates this is no longer the case.
The Sunday Investor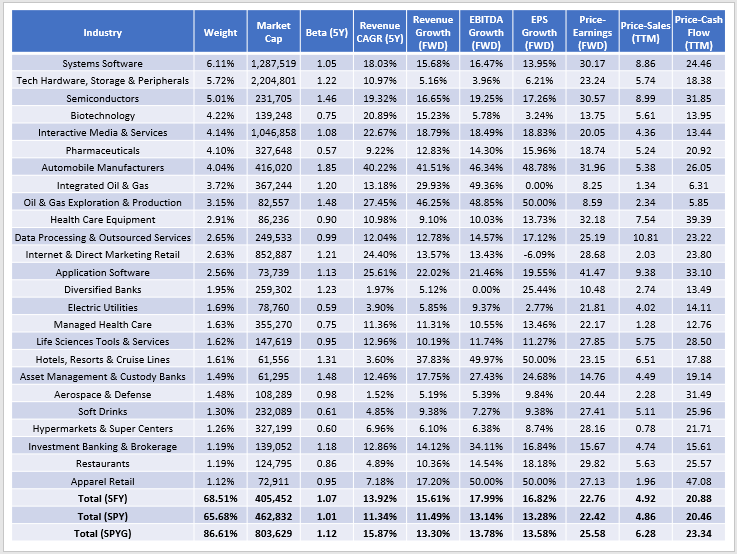
SFY has a lower weighted-average market capitalization of $405 billion compared to $463 billion and $804 billion for SPY and SPYG. It’s our first clue that the portfolio has moved away from mega-cap stocks more than expected. SFY’s historical five-year sales growth (13.92%) is in between SPY (11.34%) and SPYG (15.87%), but estimated sales growth isn’t. Analysts expect SFY’s constituents to grow sales by 15.61% over the next twelve months, surprisingly better than SPYG’s 13.78%.
A similar story plays out with estimated EBITDA and earnings growth (16.82% vs. 13.28% and 13.58%), partially due to opportunities in the Energy sector but despite only average Financials sector exposure. These two sectors are common in value ETFs lately because of their high growth, high dividends, and low valuations. SFY doesn’t have valuation screens, which I’ve criticized in the past, but it’s an unintended consequence that works in investors’ favor now.
On valuation, SFY trades at 22.76x forward earnings, 4.92x trailing sales, and 20.88x trailing cash flow. These are a few points lower than SPYG and on par with what SPY offers. SFY is an excellent choice for growth-at-a-reasonable-price investors. I noticed this changing dynamic in my last review, and the investment case is even stronger today.
Finally, investors should also consider quality because it can help explain why an ETF trades at a discount. Seeking Alpha provides sector-specific Profitability Grades, and I’ve taken those Grades, normalized them on a ten-point scale, and calculated weighted-average metrics for nearly all U.S. Equity ETFs. SFY’s score was strong at 9.31/10 compared to 9.23/10 in February. SPY’s score also improved to 9.42/10 from 9.18/10. Meanwhile, SPYG’s score was the only decline (9.56/10 to 9.42/10), signaling a unique quality issue with that tech-heavy ETF. Until results and expectations improve, alternatively-weighted funds like SFY are the better choice.
Investment Recommendation
It’s intuitive that because SFY adjusts the weights of 500 large-cap stocks by three growth factors, the result is a compromise between blend and growth ETFs like SPY and SPYG. Investors pay a higher valuation in exchange for a higher growth rate, which was the case when I started coverage on the fund in November 2021. However, the dynamics today are different, and SFY now offers the best estimated sales and earnings growth for the same valuation as SPY. Therefore, while it may be too early, SFY is a responsible way for investors to re-enter growth stocks, and that’s why I’ve decided to upgrade my rating on the ETF to a buy.
Be the first to comment