

Bet_Noire/iStock via Getty Images
The SPDR Gold Trust ETF (NYSEARCA:GLD), the world’s largest physically backed gold ETF by assets under management, recorded a draw-down of over -22% between its 2020 all-time high of $194.45 and its recent low of $151.03. Although GLD appears to have stabilised over the last several weeks, multiple signs suggest the ETF could soon record lower lows.
Bearish technical conditions?
GLD is in clear downtrends in both the intermediate and short-term timeframes since its price is below the 40-week and 10-week Exponential Moving Averages, respectively.
We can also observe that the intermediate downtrend is getting stronger since the weekly Average Directional Index, or ADX, is above 25 and rising. Moreover, GLD’s price could still fall substantially before we reach ‘oversold’ conditions in the weekly timeframe according to the traditional parameters for the Relative Strength Index, or RSI.
GLD 5-year Chart, Weekly timeframe (Created by author using data from www.stockcharts.com, October 30, 2022)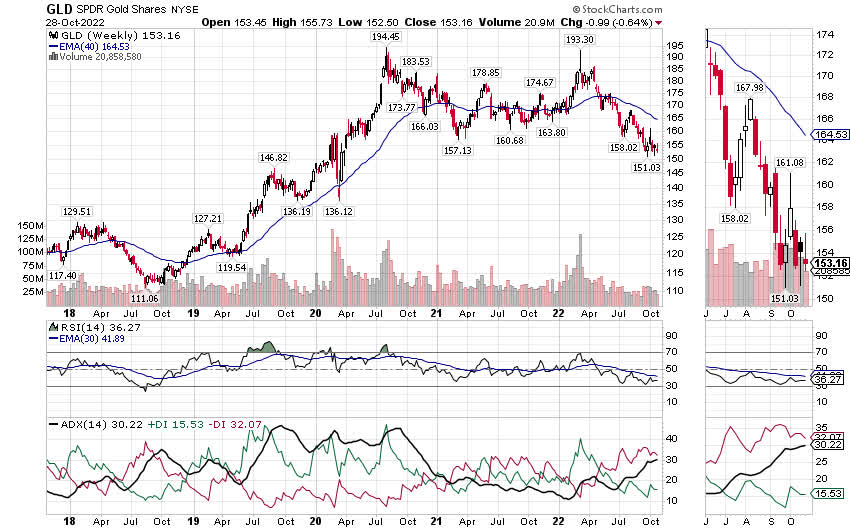
In the daily timeframe, we can see that GLD failed to clear its 55-day Exponential Moving Average on three occasions. Lower lows followed two previous attempts to clear this moving average. This is another indication that GLD is vulnerable to fall below its recent low of $151.03.
GLD 1-year Chart, daily timeframe (Created by author using data from www.stockcharts.com, October 30, 2022)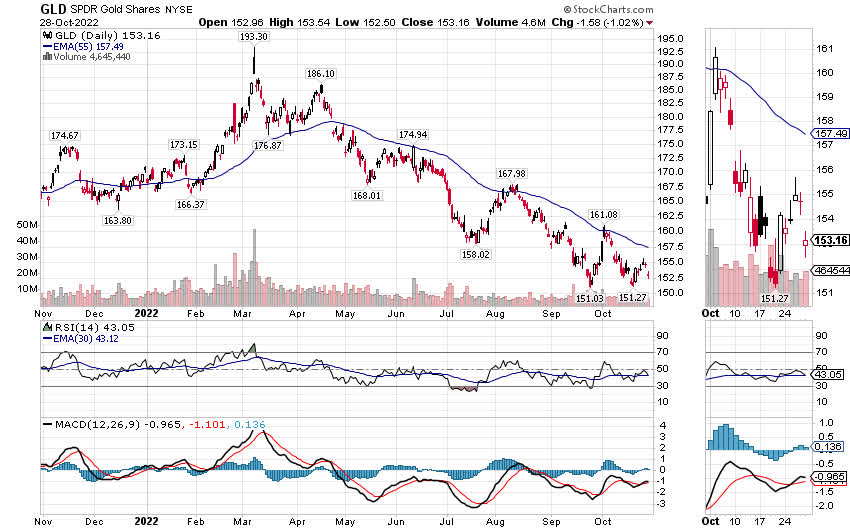
Next support level could be $140
GLD had support at $157.68 according to a Point and Figure chart that uses a configuration consisting of 3% box size and 3-box reversal. This level coincided with a previous resistance level that GLD broke on its way up to all-time highs in 2020. GLD took out the $157.68 support level by closing below $153.08 several times in late September and again in mid-October 2022. The next support level in this configuration appears to be $140.09.
GLD Point and Figure 3pct x 3 (Created by author using data from www.stockcharts.com, October 30, 2022)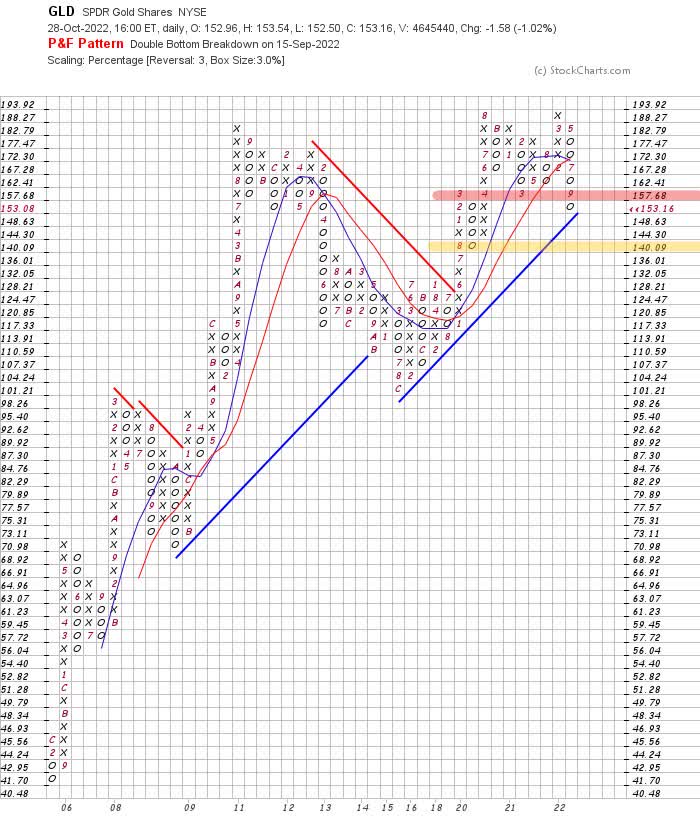
We can observe similar support levels when we reduce the box size to 2%. This configuration shows more price movements since a smaller box size yields a greater number of reversals. A close below $148.28 would establish a downward reversal in this configuration. The next potential support level thereafter would be $139.73.
GLD Point and Figure 2pct x 3 (Created by author using data from www.stockcharts.com, October 30, 2022)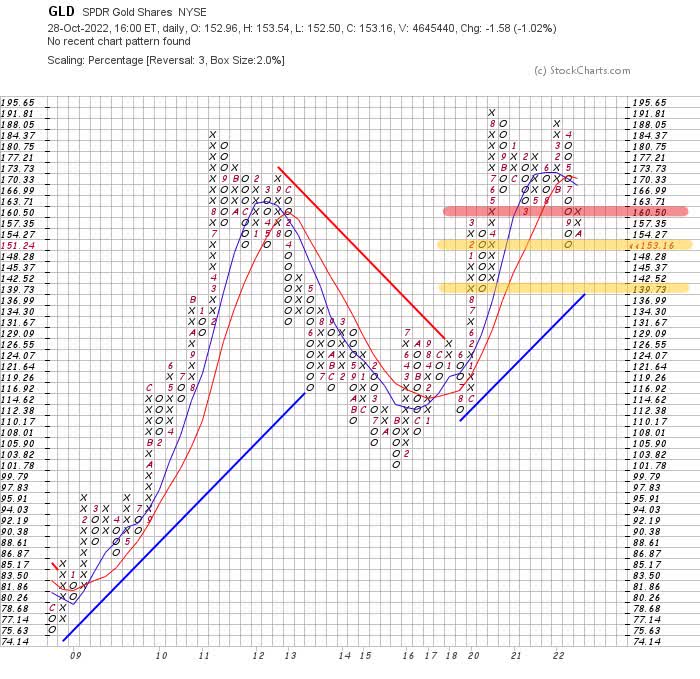
The potential support level of $140 highlighted in these charts is close to the $142.91 level, which marks a -61.8% retracement of the rise in price from the 2018 low ($111.06) and the 2020 high ($194.45). A confluence of indicators pointing to a narrow zone of support increases the significance of this zone.
GLD 5-year Chart, weekly timeframe with Fibonacci (Created by author using data from www.stockcharts.com, October 30, 2022)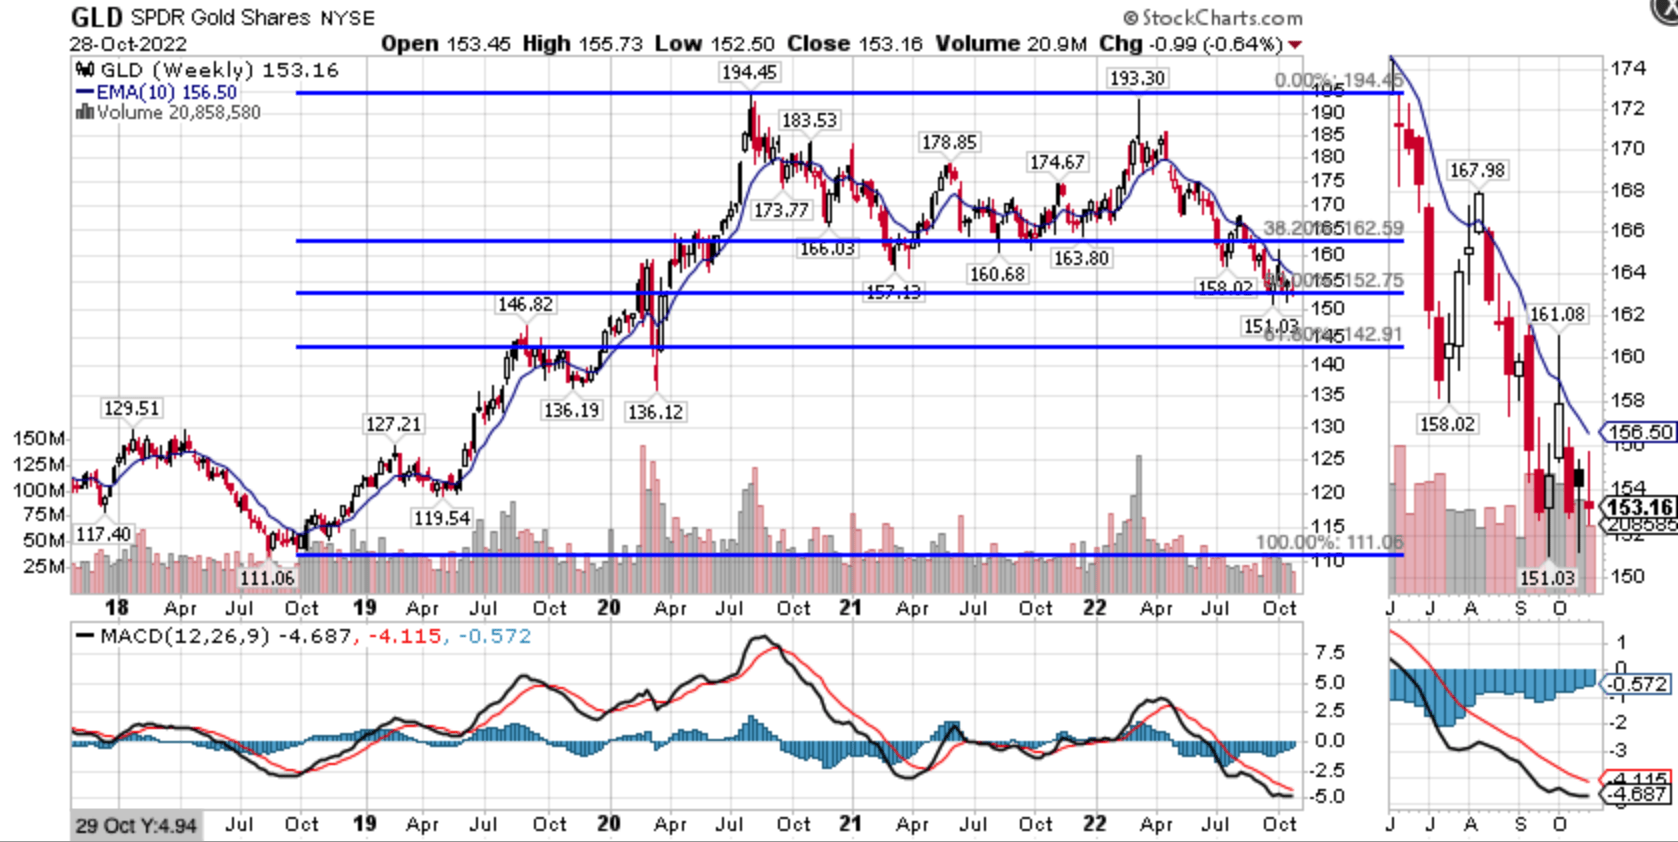
Higher real yields can push GLD to lower lows
We can calculate real yields by subtracting the yield on a US Treasury Inflation-Protected security, or TIP, from the yield on conventional treasury debt with the same maturity. US Treasury securities, especially short-dated US Treasury bills, compete with gold for investors seeking safe haven investments. When real yields are negative, gold is a more attractive store of value because treasury bills are guaranteed to lose money in real terms. As real yields rise, treasury bills become more attractive because gold does not produce income. Rising real yields, therefore, represent a rising opportunity cost for holding gold.
We can observe the inverse relationship between GLD and real yields by comparing the price of GLD to the real yield on 5-year US treasury notes. GLD reached its all-time high in 2020 just as real yields were falling into deeper negative territory. The sharp rise in real yields that began earlier this year coincided with the sell-off in GLD, which recorded its 52-week low around the same time that 5-year real yields peaked.
GLD vs US 5-year Treasury Real Yield (Created by author using data from TradingView, October 30, 2022)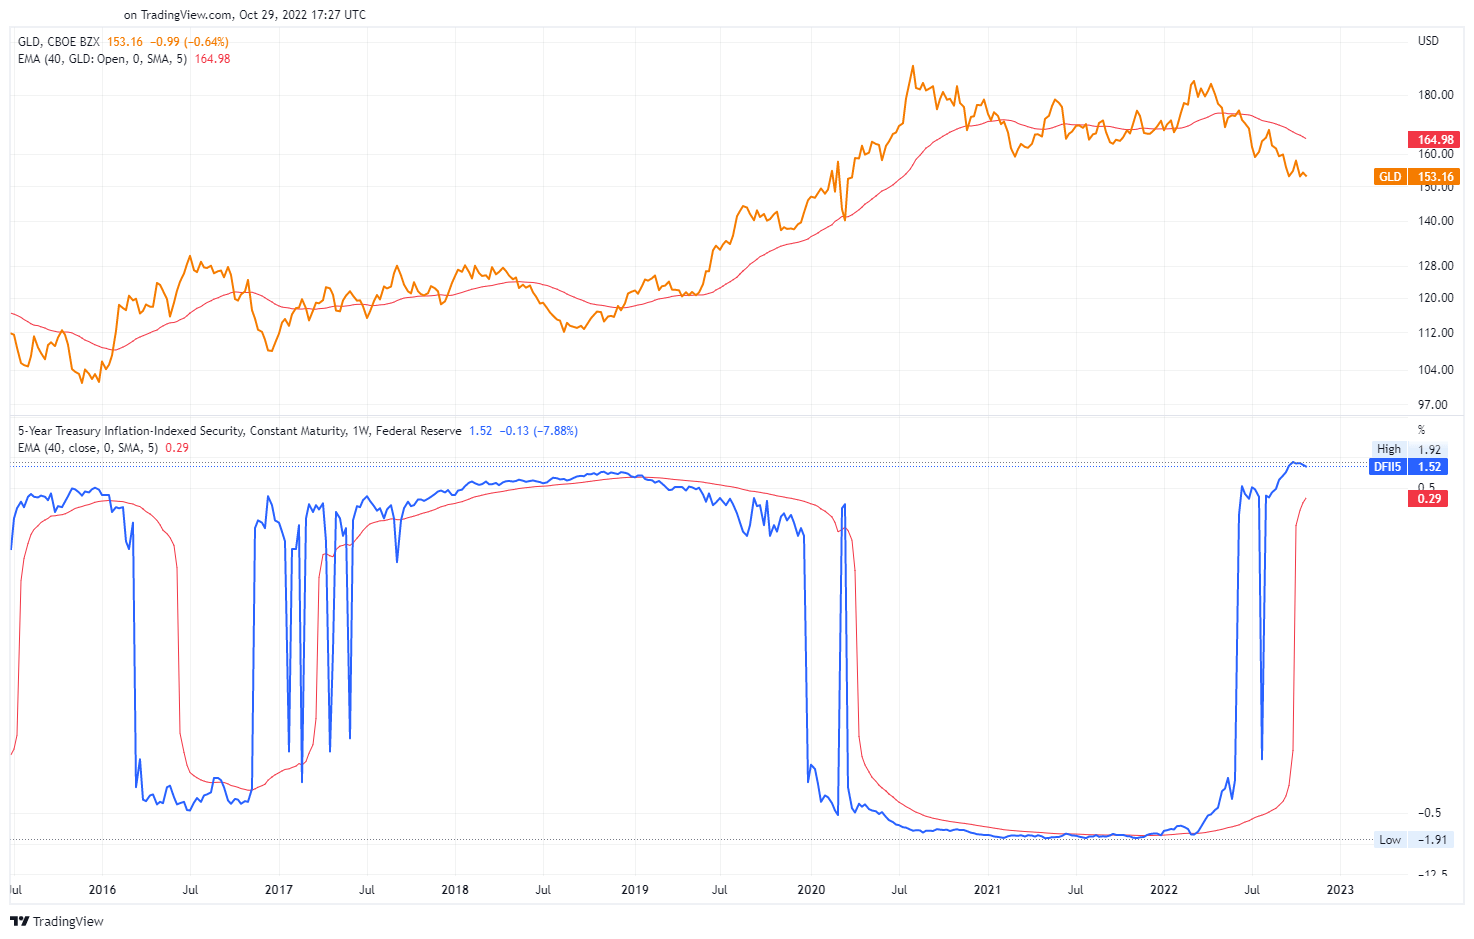
Real yields could rise to higher highs in reaction to hotter-than-expected labour or CPI data coming out on 4 November and 10 November respectively. A persistently strong labour market is one input that could encourage the Federal Reserve to raise its policy rate higher than currently expected and keep rates higher for longer while engaging in quantitative tightening. Meanwhile, higher-than-expected CPI figures have consistently pushed real yields higher over the past year. Another hot CPI print could push real yields across the curve higher and put further downward pressure on GLD.
Inverted yield curve raises the probability of recession
On October 18, the spread between nominal yields on 10-year US treasury bonds and 3-month US treasury bills became negative for the first time since early 2020. The spread briefly recovered thereafter before recording four consecutive lower lows in negative territory this past week
US 10y Treasury Yield Minus 3-month Yield (1 year) (Federal Reserve Bank of St. Louis, 30 October 2022)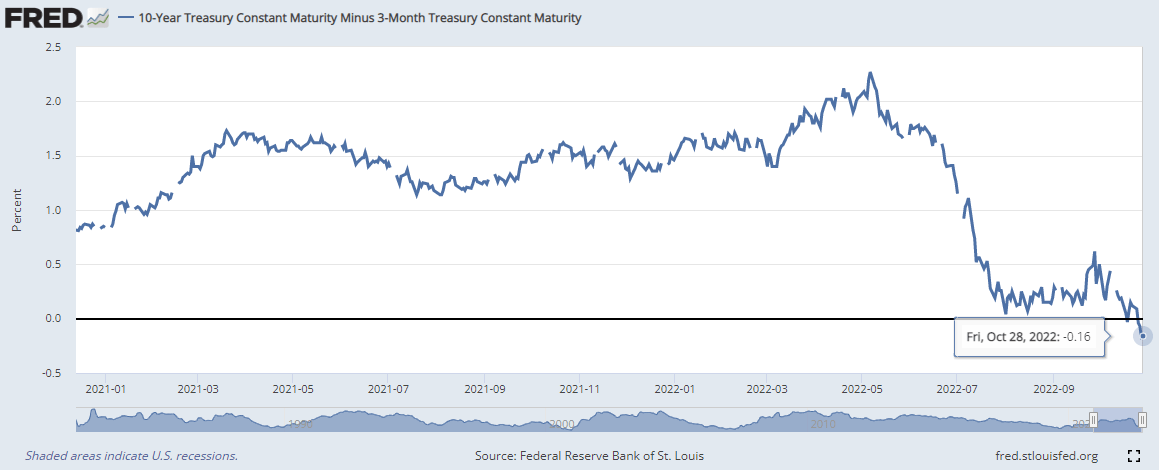
Since the yield curve tends to slope upwards, the curve becomes inverted when 3-month US Treasury bill yields are higher than treasury securities with longer maturities. A long-term chart of the spread between 3-month and 10-year US treasury securities shows that inversions are rare and tend to precede recessions in the US.
US 10y Treasury Yield Minus 3-month Yield (Federal Reserve Bank of St. Louis, 30 October 2022)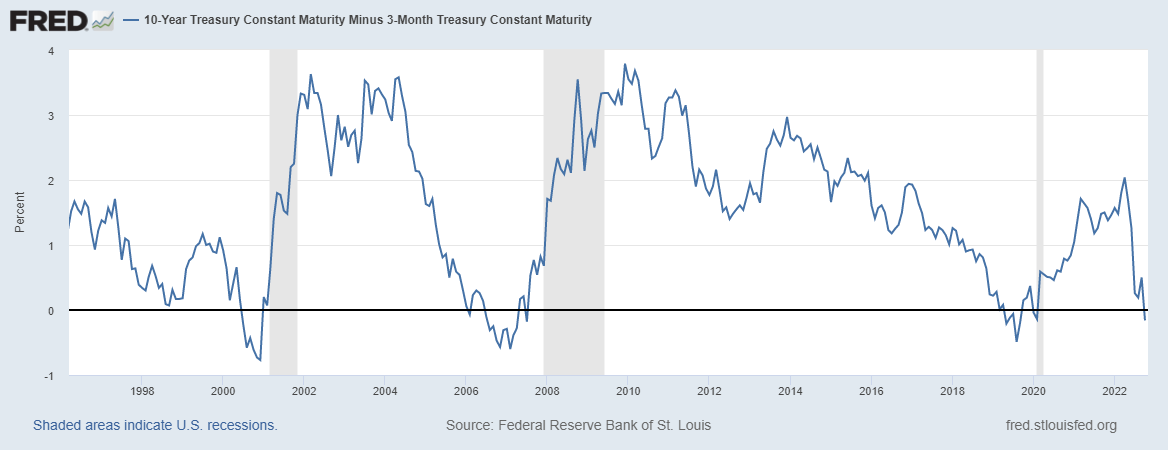
Importantly, recessions do not tend to occur immediately after the first sign of an inversion. Moreover, the current inversion could extend much further based on historic precedents. This means that real yields from shorter-dated US treasury bills could still rise from current levels. This would be an adverse development for gold over the next one or two quarters because higher real yields represent a rising opportunity cost for holding gold.
Gold is only likely to break its downtrends once there are credible signs that US Federal Reserve will start cutting its policy rate. Lower policy rates should reduce real yields on short-term US treasury bills. Meanwhile, declining growth and inflation rates should encourage investors to drive yields down across the rest of the curve as they seek safe haven investments. Falling real yields reduce the opportunity cost for holding GLD and make it appear relatively more attractive.
Additional headwinds: rising USD and falling real M2 money stock
Like GLD and real interest rates, GLD and the US dollar tend to move in opposite directions. Indeed, GLD tends to do particularly well when there is a rapid expansion of the US monetary base since there is a greater amount of US dollars chasing basically the same amount of gold. As the expansion of the monetary base stabilises, the inverse correlation tends to become less significant. We can observe the generally inverse relationship between GLD and USD from the below chart.
GLD vs USD, 5 years (Created by author using data from TradingView, October 30, 2022)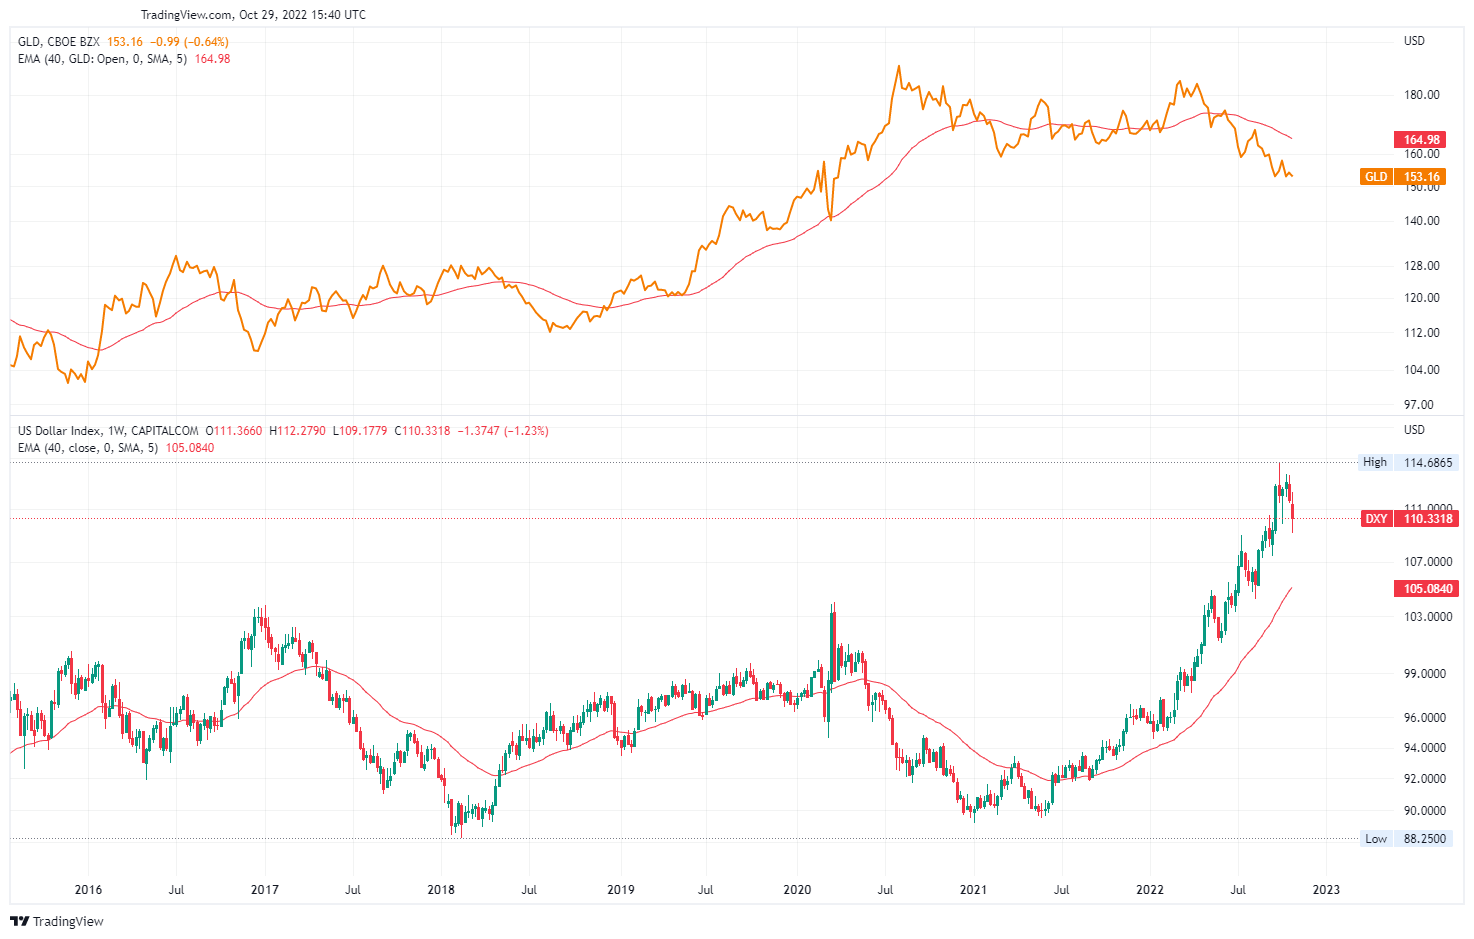
Recent strength in USD has helped push GLD lower. This makes the next move in USD particularly important for anticipating the future direction of GLD.
USD could rise to new highs due to widening interest rate differentials. At the moment, it appears likely that the Fed will tighten its monetary policy more aggressively than other major central banks due to the relatively stronger condition of the US economy and US companies.
Also, the Fed’s focus on inflation means Real M2 Money Stock will continue to decline. This creates an additional headwind for gold in the near term.
Real M2 Money Stock (Federal Reserve Bank of St. Louis, 30 October 2022)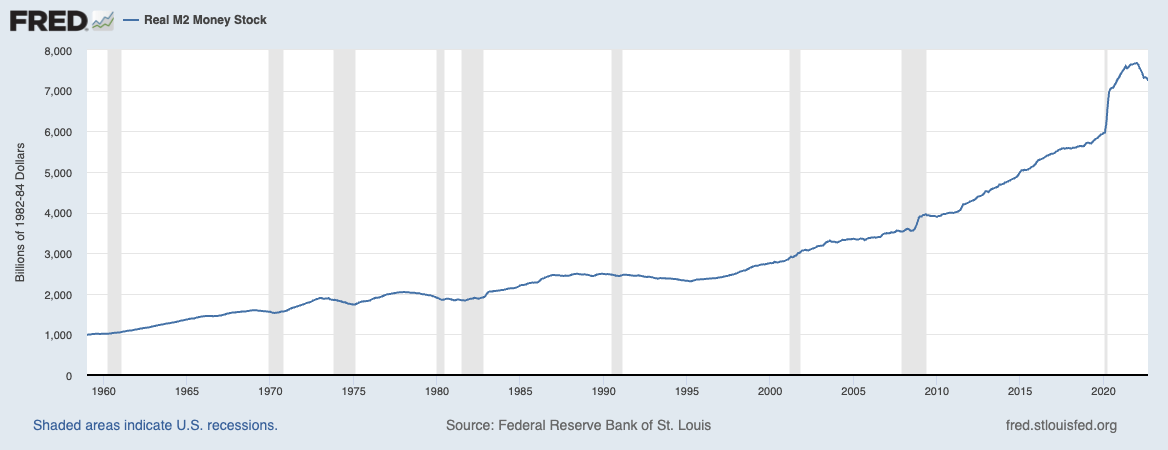
Trade set-up
Given the near-term headwinds for GLD, investors seeking a compelling short-term trading opportunity could consider selling GLD short near the 55-day Exponential Moving Average with a take-profit target near the next support level. The stop-loss could be just above the 55-day EMA, which has acted as a strong resistance level the last three times that price tested it from below. The timeframe should coincide with the release of important labour and inflation data.
-
Ideal entry price: $155 to $157
-
Take-profit: $143 to $142
-
Stop-loss: $161 to $162 (daily close)
-
Timeframe: 5 to 34 trading days
What could cause this trade to go wrong?
GLD could rise in the near term if real yields fall sharply. Accordingly, this trade pairs well with another trade I wrote about in favour of the iShares 20 Plus Year Treasury Bond ETF (TLT). A collapse in real yields would likely coincide with a sharp fall in the US Dollar, adding further upward pressure to the price of GLD.
The Fed’s professed data dependence means a sharp fall in inflation data relative to expectations would likely cause real yields to fall in anticipation of less aggressive monetary policy. Another catalyst for real yields to fall would be a deterioration in labour data since this would signal that the economy is already heading into a recession. Indeed, labour statistics are likely to begin weakening soon as the impact of the Fed’s policy tightening finally filters through to the real economy.
Conclusions
Although GLD already experienced a sharp draw-down this year, it is vulnerable to reach new lows in the near-term due to a confluence of technical and fundamental headwinds. Investors seeking an attractive short-term trade should consider selling into any near-term strength in GLD.
Be the first to comment