

97/E+ via Getty Images
Sealed Air (NYSE:SEE) is a packaging provider focusing on packaging materials, automation, equipment, and services. As the company transforms into driving more sales from equipment sales and services, the market may have to reclassify it as an industrial company. Sealed Air is currently classified as a materials company. The company has a bright future in helping big and small companies derive cost savings by automating their packaging needs. Industrial companies trade at a much higher valuation than material companies. The Vanguard Materials ETF (VAW) has a P/E ratio of 12.3x while the Vanguard Industrials ETF (VIS) has a P/E of 19x. In the long term, Sealed Air may deserve a valuation closer to other industrial companies. But, the transition will take time since revenue from equipment and services is a small portion of total sales.
Good Growth in Sales and Profits in Q2 2022
The company operates under two segments; its Food segment sells packaging solutions to various meat and seafood markets worldwide. The Protective business segment sells packaging solutions to e-commerce, consumer goods, pharmaceutical, medical devices, and industrial manufacturing companies. These packaging solutions combine high-performance materials and automation equipment.
The company saw sales increase by 7%, adjusted EBITDA growth of 12%, and adjusted EPS growth of 28% [Exhibit 1]. The volume/mix was unfavorable for the company in Q2 2022, contributing a negative $62 million to the company’s sales growth. But, its pricing power helped propel sales by $214 million. The dollar’s strength was also a headwind for sales growth, taking away nearly $52 million in sales [Exhibit 2].
Exhibit 1: Sealed Air Q2 2022 Sales and EPS Growth
Sealed Air Q2 2022 Sales and EPS Growth (Sealed Air Investor Presentation)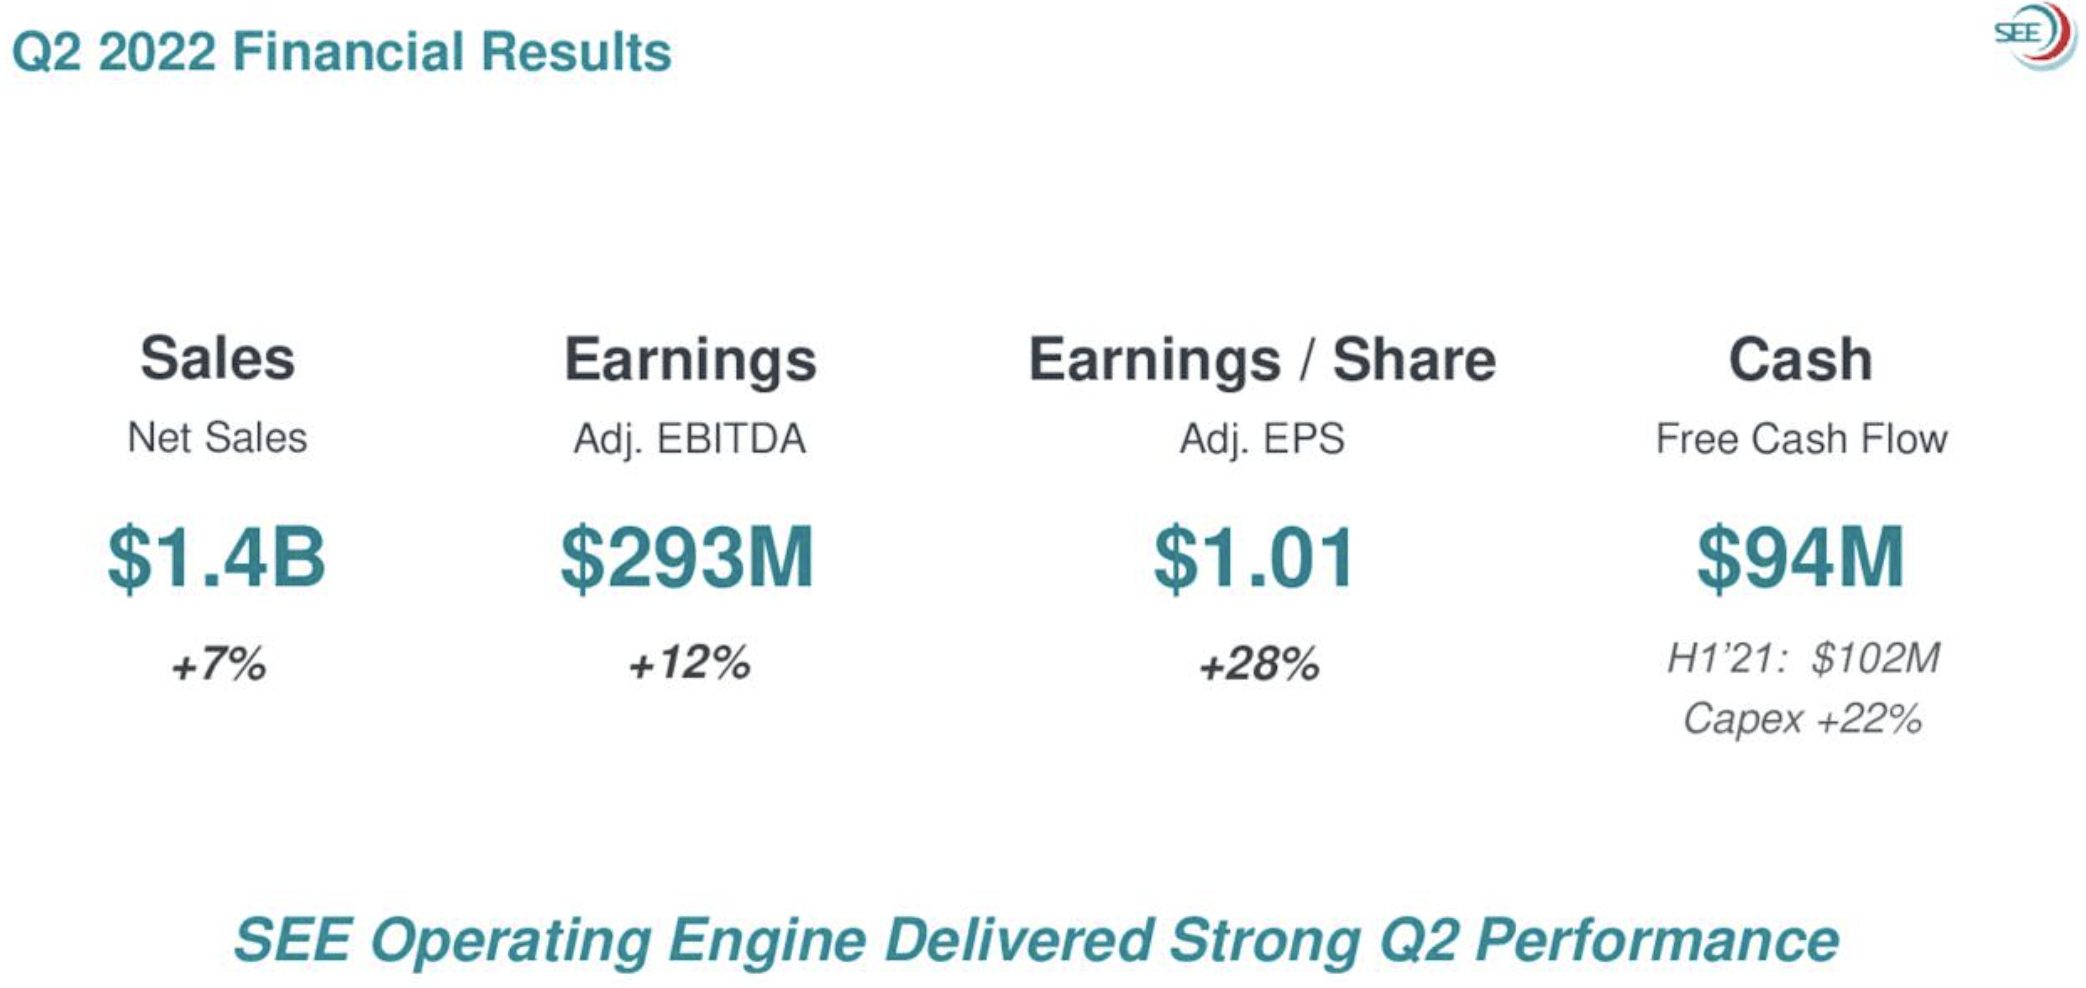
Exhibit 2: Sealed Air Q1 2021 to Q2 2022 Sales and EBITDA Bridge
Sealed Air Q1 2021 to Q2 2022 Sales and EBITDA Bridge (Sealed Air Investor Presentation)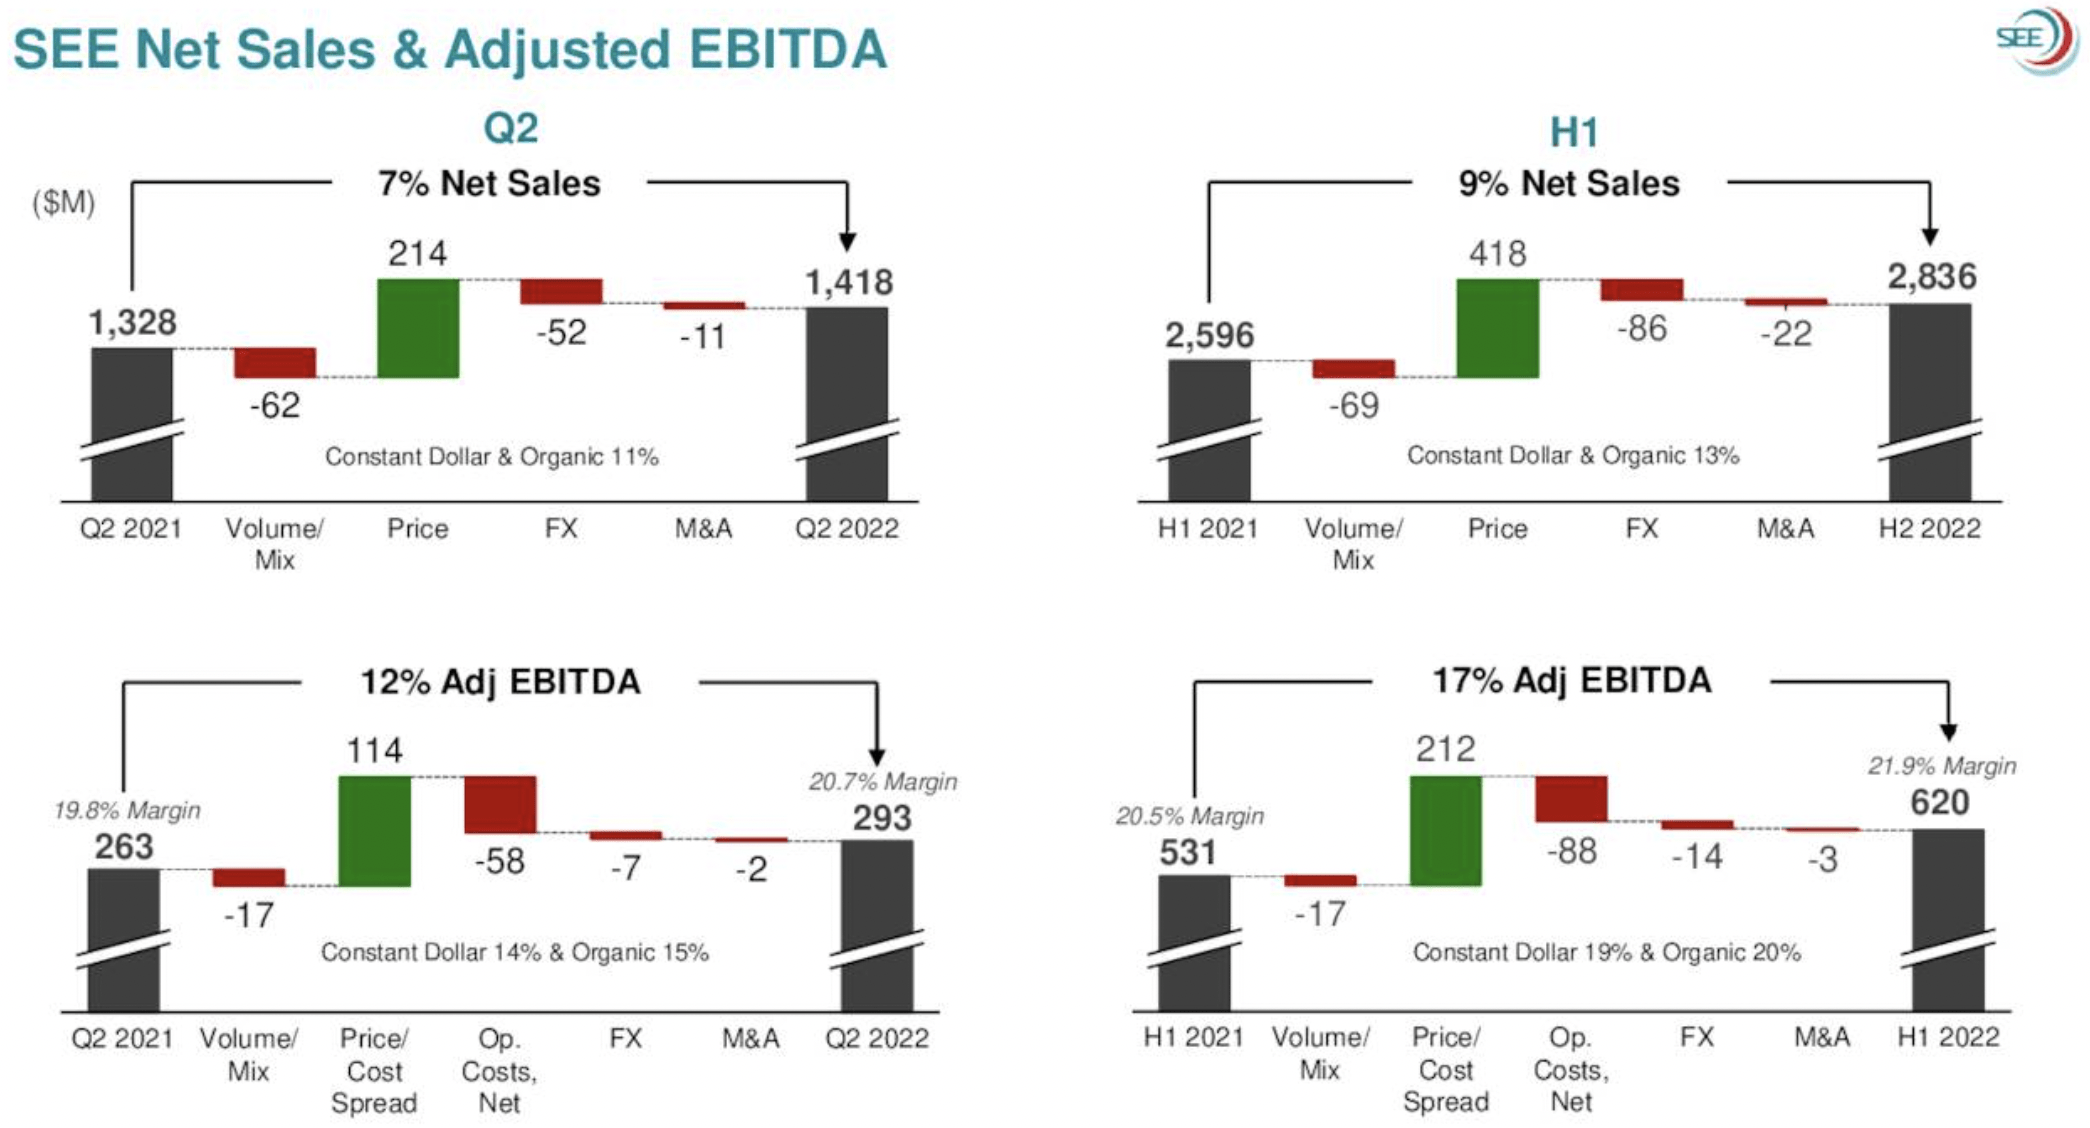
Sealed Air’s Prescient Focus on Packaging Equipment and Services
In 2020, the company launched its Automation Solutions strategy to focus on growing its equipment sales and services. In the long run, this automation strategy would make Sealed Air products sticky among its customer base and increase margins.
The company is projecting $500 million in equipment and services sales for 2022. With some help from acquisitions, the company looks to cross $1 billion in sales by the end of 2025 [Exhibit 3]. For example, in 2019, the company acquired Automated Packaging Systems – a manufacturer of automated bagging systems.
Manufacturers are looking to reduce the cost of labor and increase productivity in their processes, given the labor shortage in the U.S. and ongoing reshoring efforts triggered by the supply chain disruptions during the pandemic and geopolitical tensions with China. These megatrends are just starting, and Sealed Air should benefit from this in the coming years.
Exhibit 3: Sealed Air Current and Projected Sales from Packaging Equipment and Services
Sealed Air Current and Projected Sales from Packaging Equipment and Services (Sealed Air Investor Presentation)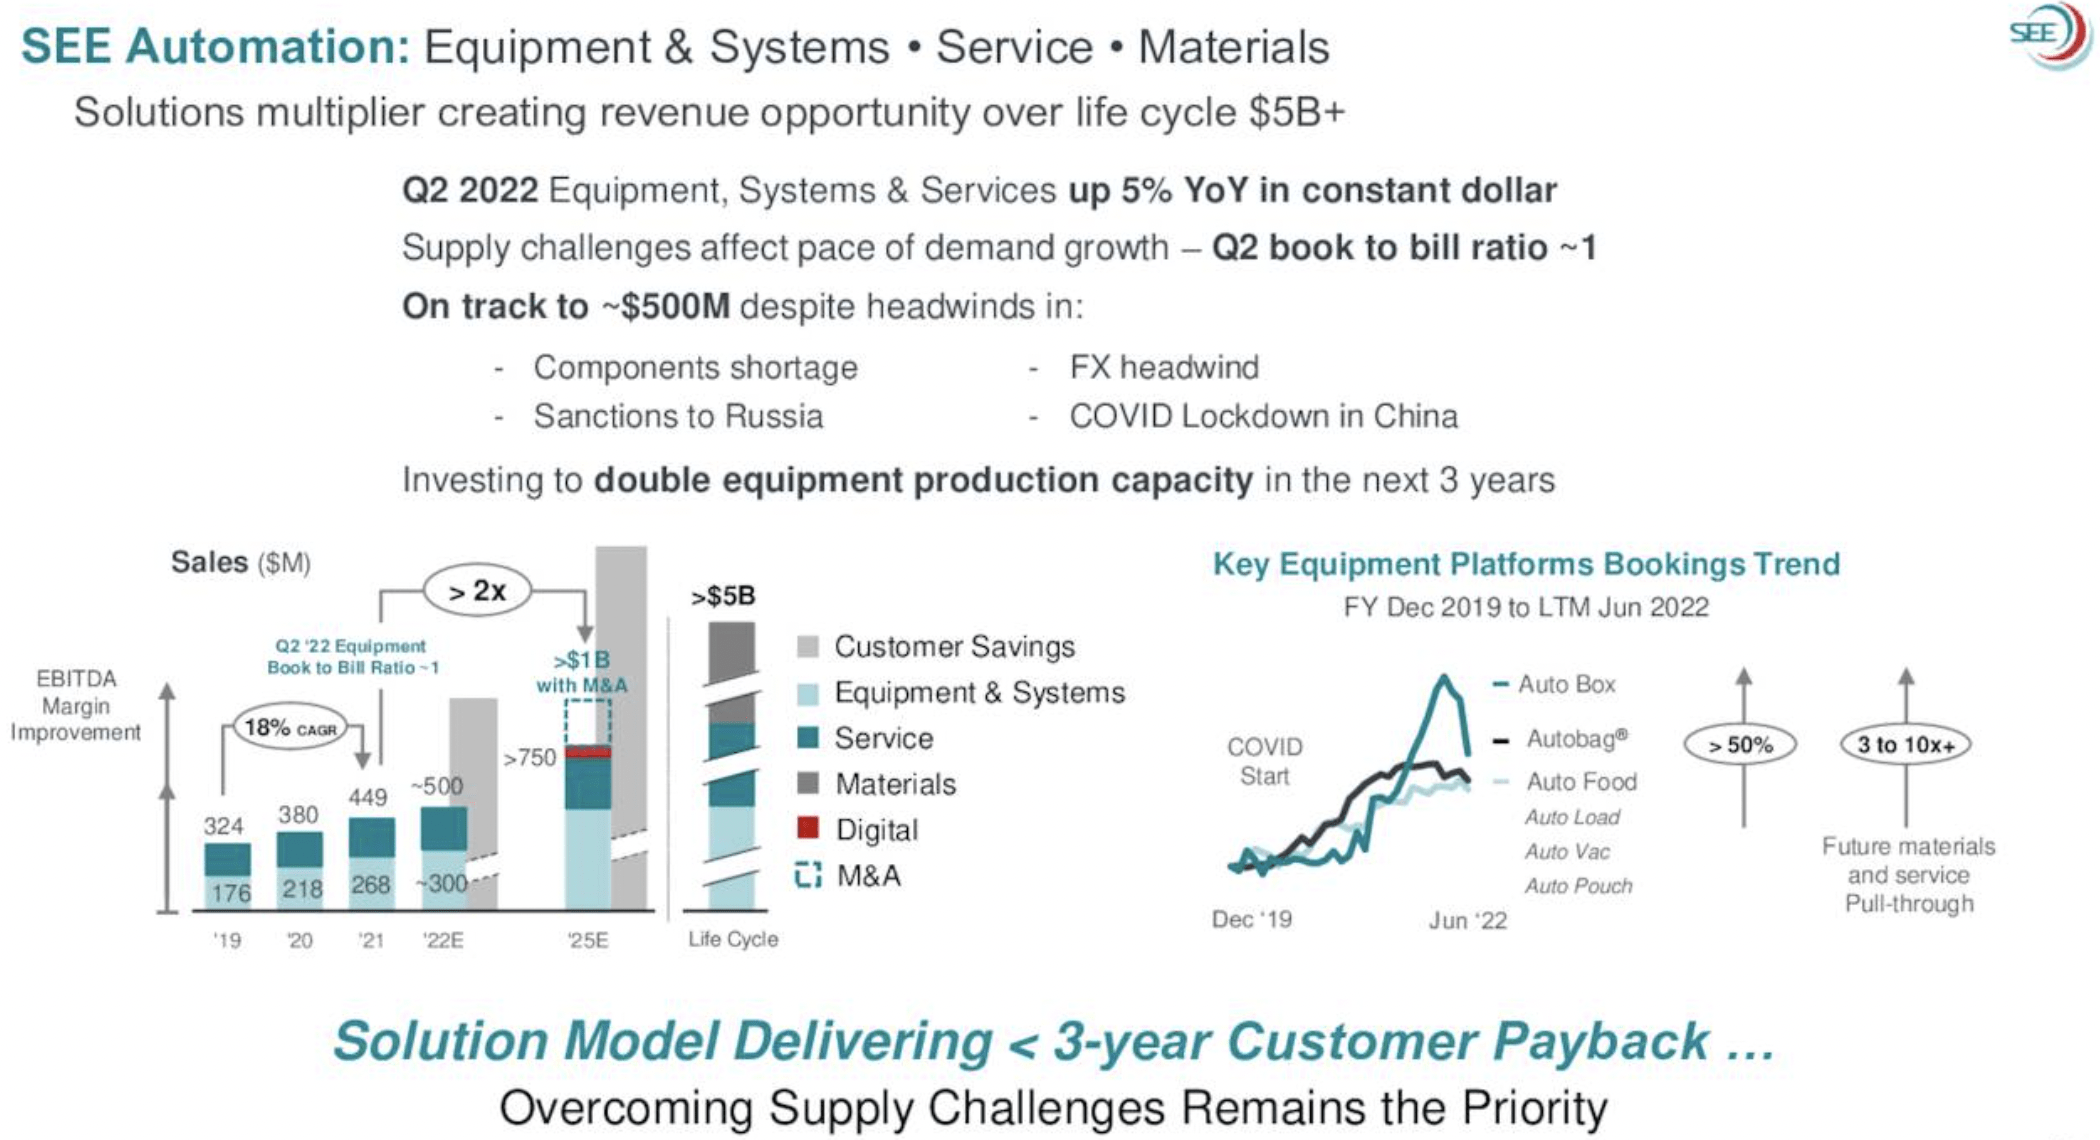
As Sealed Air transforms into an automation provider, a company like Rockwell Automation (ROK) may be its closest peer in the long run. Rockwell Automation has gross profit margins in the low- to mid-forties, while Sealed Air currently commands gross margins in the low-thirties [Exhibit 4].
Exhibit 4: Gross Profit Margins for Sealed Air, Rockwell Automation, Graphic Packaging, Sonoco Products, and Packaging Corporation of America
Gross Profit Margins for Sealed Air, Rockwell Automation, Graphic Packaging, Sonoco Products, and Packaging Corporation of America (Seeking Alpha, Author Compilation)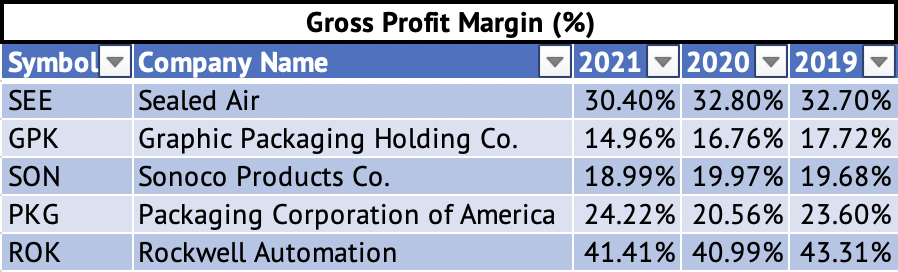
Sealed Air has a much higher gross margin and operating margin than some of its material peers. Its operating margins are close to that of Rockwell Automation [Exhibit 5]. In 2017, Sealed Air became a focused company with the spin-off of its Diversey division. Diversey (DSEY) made hygiene and cleaning products. Diversey was a low-margin business. With the spin-off of Diversey and its new-found focus on equipment sales and digitization, Sealed Air can consistently achieve a 16% operating margin in the future.
Exhibit 5: Operating Profit Margins for Sealed Air, Rockwell Automation, Graphic Packaging, Sonoco Products, and Packaging Corporation of America
Operating Profit Margins for Sealed Air, Rockwell Automation, Graphic Packaging, Sonoco Products, and Packaging Corporation of America (Seeking Alpha, Author Compilation)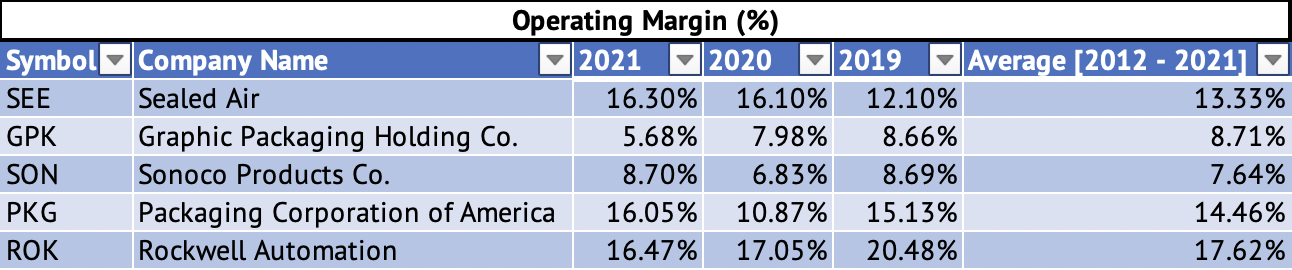
Monthly Return Comparison with the Vanguard S&P 500 Index ETF
Sealed Air averaged a monthly return of 1% between June 2019 and August 2022. The company’s third quartile [75% of the months between 2019 and 2022] returns were below 7.68% per month – an excellent monthly return. But, the company’s stock has high volatility compared to the Vanguard S&P 500 Index ETF (VOO). According to Yahoo Finance, Sealed Air has a Beta (five-year monthly return volatility) of 1.17. A linear regression of the monthly returns of Sealed Air and the Vanguard S&P 500 Index ETF between June 2019 and August 2022 yielded a Beta of 1.14 – very close to the Beta provided by Yahoo Finance.
Exhibit 6: Sealed Air Monthly Return Statistics
Sealed Air Monthly Return Statistics (Data Provided by IEX Cloud, Author Calculations)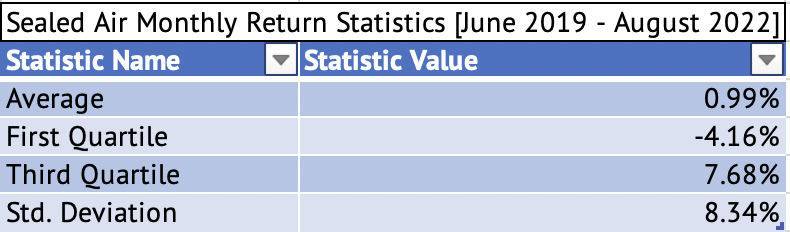
The current market volatility may exacerbate the volatility in Sealed Air. For every 1% change in the monthly return of the Vanguard S&P 500 Index ETF, Sealed Air can be reasonably expected to have a mean change of 1.14%. The standard deviation of 8.34% for Sealed Air’s monthly returns also warns of high volatility in its stock price. Sealed Air’s monthly returns have a high positive correlation of 0.75 with the Vanguard S&P 500 Index ETF. It is no surprise that Sealed Air has returned a negative 21%, while the Vanguard S&P 500 Index ETF has produced a negative 17% in the past year.
Generally, high beta stocks perform poorly during a market downturn. Of the stocks I covered in Seeking Alpha last month [Exhibit 7], Colgate-Palmolive (CL) had the lowest Beta and has held up well against the current market downturn. In general, Consumer Staples stocks have a very low beta, and investors flock to the safety of that sector during times of high market volatility.
Exhibit 7: Sealed Air Current and Projected Sales from Packaging Equipment and Services
Beta and One-Year Returns for Cisco, Colgate-Palmolive, Lennox International, and Sealed Air (Data Provided by IEX Cloud, Author Calculations)
Sealed Air has a good return on invested capital [ROIC] of 14.2% compared to Packaging Corporation of America’s (PKG) ROIC of 16.2%. Both Sonoco Products (SON) and Graphic Packaging (GPK) have much lower ROIC than Sealed Air. Packaging Corporation of America is trading at an E.V. to EBITDA multiple of 6.4x, while Sealed Air trades at a multiple of 8.1x (Source: Seeking Alpha). The company may be fully priced for a short-term investor looking for gains in the next 12 months. If the market declines further, the company may suffer further losses.
Low Dividend Yield of Sealed Air
The company offers a low dividend yield of 1.76% compared to the 1.66% yield offered by the Vanguard S&P 500 Index ETF. The U.S. 2-Year Treasury yields 4.3%, more than double the yield of Sealed Air. Sealed Air is not a good stock to own for the dividends.
Sealed Air’s dividends are safe, with a low payout ratio of 19.4%. The company has ample operating cash flows to cover its dividends. For example, Sealed Air had a net income of $506 million in 2021 and an operating cash flow of $709 million. Its dividend payment totaled $115.6 million in 2021. The company has elevated debt levels with a debt to EBITDA ratio of 3.3x. It may be best for the company to pay down debt and get a more manageable debt to EBITDA multiple of 2x.
Conclusion
Sealed Air is a company in transition. The company’s strategy to focus on equipment sales and services offers cost savings for its customers. Sealed Air may deserve a higher valuation multiple when it generates a good portion of its revenue from equipment sales. The long-term future looks promising for Sealed Air. Investors patient enough to wait a few years should be richly rewarded.
Be the first to comment