

akinbostanci/E+ via Getty Images
I was recently asked for my opinion on which was a better choice for investing new money, the Schwab U.S. Dividend Equity ETF (NYSEARCA:SCHD) or the Vanguard S&P 500 ETF (NYSEARCA:VOO).
It’s a very good question and one for which I had no immediate answer as there is much to be said for both. So what I’m going to do in this article is walk you through the process I follow when faced with making a choice like this one, which involves asking a series of questions examining their answers and following up on the questions those answers lead to.
How Are SCHD And VOO Different? A Look At How They Are Constructed
VOO Tracks Large Cap Stocks from All Sectors with a History of Profitability, Chosen by a Human Committee
Though VOO only started trading in September of 2010, it is actually the ETF share class of a much larger, older mutual fund, the Vanguard 500 Index Fund (VFIAX), which was the first index fund to ever track the S&P 500. The earliest share class of the Vanguard 500 Index Fund started trading 46 years ago, in August of 1976 and has traded continuously since then. So we know more about how VOO has performed in the past under different market conditions than we do about any other fund or ETF.
As its name suggests, VOO tracks the S&P 500 index, which is the same index tracked by the SPDR S&P 500 Trust ETF (SPY). VOO and SPY’s performance are extremely similar, but because VOO has a lower expense ratio than SPY, VOO’s long term performance is slightly better than that of SPY.
S&P Global, the company that selects and maintains the S&P 500 index describes VOO’s index as follows:
To be eligible for S&P 500 index inclusion, a company should be a U.S. company, meet market capitalization requirements, be highly liquid, have a public float of at least 10% of its shares outstanding, and its most recent quarter’s earnings and the sum of its trailing four consecutive quarters’ earnings must be positive.
It is interesting to note that until very recently, S&P Global gave a specific number for “market capitalization requirements.” This number had been growing by a billion dollars or so every six months over the past five years as the market cap of its constituents swelled with the Bull Market. As recently as September of 2021, when I last wrote about it, that market cap was listed in the same document as being $11.8 Billion. S&P Global has probably removed a specific number from its S&P 500 brochure because the 2022 bear market shrank the market cap of many of its smallest holdings which still remain in the index.
The S&P 500 includes REITs, which many other large cap indexes, including the one associated from which SCHD’s stocks are drawn, exclude. The methodology makes it clear that the point of the S&P 500 is to mirror, in a selective fashion, the makeup of large cap segment of the entire U.S. stock market including stocks from all sectors and styles.
The requirement that stocks chosen for the S&P 500 have a history of profitability sets it apart from other broad market indexes. It eliminates unicorn IPOs, meme stocks, and other speculative investments of the kind you will find in other broad market indexes, like the Vanguard Total Stock Market ETF (VTI) that include almost every stock traded on US exchanges.
The other thing that sets the S&P 500 apart from other broad market indexes and from the Schwab Dividend Equity ETF is that the stocks found in the S&P 500 index are selected by a human committee, whose goal is to select the stocks that are best representative of all the sectors that make up the total U.S. stock market.
The index is reconstituted yearly by the committee often using those soft qualitative factors and a few stocks are added or eliminated, with major impact on those stocks popularity.
The S&P 500 is a market cap weighted ETF, a factor which needs to be understood by any investor who buys shares in it. That’s because though it, and hence VOO, currently hold shares in 503 different stocks, a handful of their stocks have market caps so much larger than those of all the other stocks in the index, that their ups and downs largely determine the performance of the S&P 500 index as a whole. We will get back to this issue later in this discussion.
SCHD Holds 100 Stocks Selected by an Algorithm Using Four Equally Weighted Factors
SCHD follows a much more recent, much more narrowly defined index, the Dow Jones Dividend 100 Index. This is another S&P Global index. S&P Global provides us with a methodology document that explains exactly how it chooses stocks for SCHD’s index and how it modifies that index’s holdings over time.
The stocks in SCHD are chosen by a computer algorithm from a total market index that excludes REITs. Screens for four different factors applied to each stock and each is given a separate ranking for each factor. Those factors are:
- Dividend History: Stocks must have a minimum of a 10-year history of paying dividends and the average dividend growth over the last five years is ranked, the higher the better. Note however that dividends do not have to have grown every one of those years, only that the average growth over the entire five years must be high.
- Free cash flow to total debt: This is calculated as annual net cash flow from operating activities divided by total debt. Companies with zero total debt are ranked highest.
- Return on equity: This is Annual net income divided by total shareholders’ equity. The highest return is ranked highest.
- Expected forward yield: Unlike the case with the three earlier factors the index methodology document discusses, the methodology document only lists Expected Forward Yield as a factor but does not give readers any other information as to how this metric is arrived at. Again, highest ranks highest.
After rankings for each of these four factors are calculated for each stock, they are added up. When the SCHD was started the 100 stocks with the highest total ranking numbers were selected for the Dow Jones Dividend 100 Index. However, once stocks were in the index, they remain in SCHD until their combined rankings on the four factors have dropped to where they are ranked below the top 200th listing. This generous favoring of stocks already in the index owned allows many stocks that investors might not expect to see in SCHD to remain in its index despite years of poor stock performance. most notably one of SCHD’s top holdings, IBM (IBM).
IBM’s Price, Earnings, P/E Ratio and Dividends – 10 Year History
Fastgraphs.com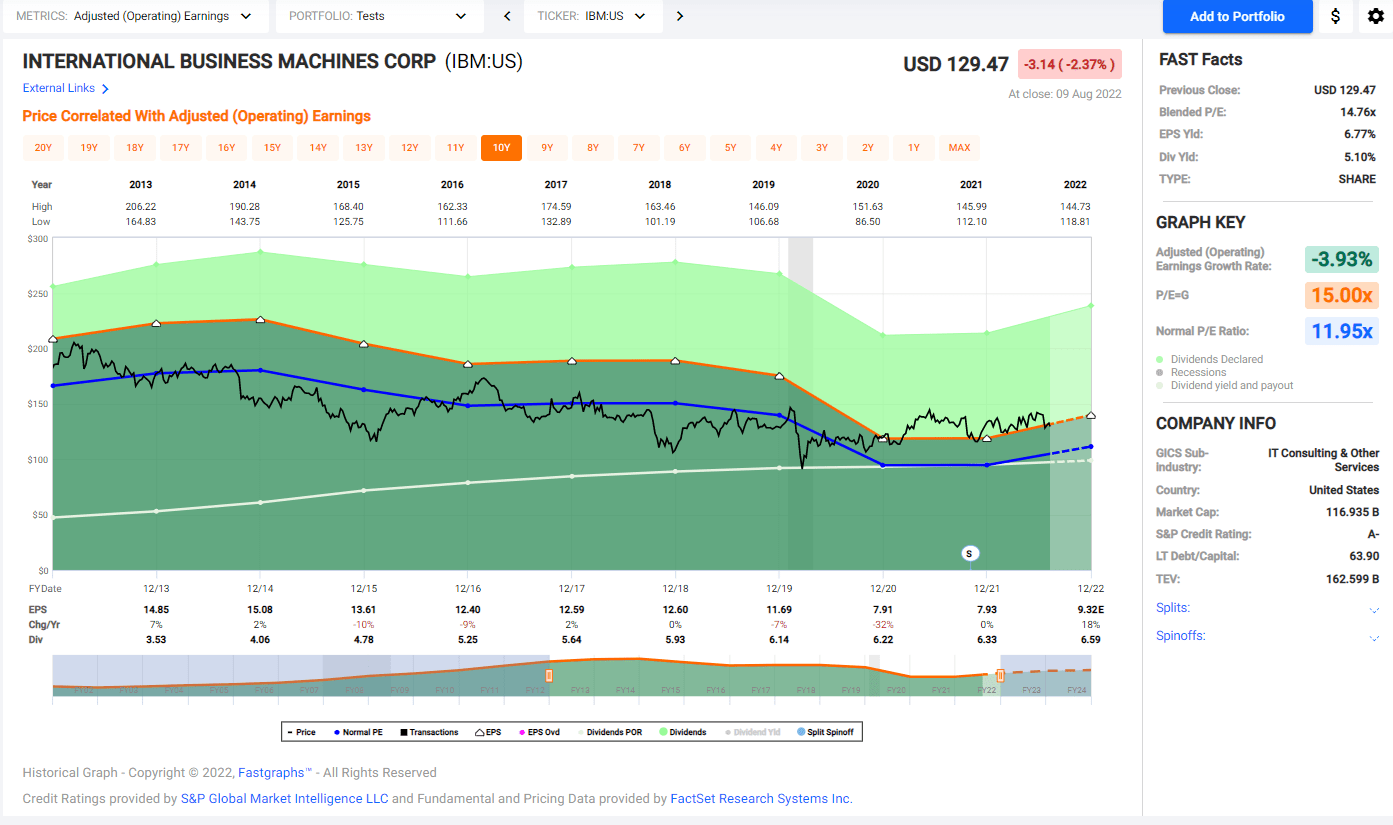
IBM is a top 10 stock in SCHD because, like VOO, SCHD is market cap weighted, so SCHD holds stocks in amounts that are in proportion to the size of their market caps. Once stocks are selected for SCHD their factor rankings don’t determine their weight in SCHD, somewhat undermining the value of all that screening.
Comparison Summary
VOO holds large cap growth and value stocks in proportion to their market caps. It’s quantitative screening is limited to demanding a large cap size and a profitability history. Other, softer qualitative factors are applied by the brains of the human committee to select the final holdings.
SCHD is picked entirely quantitatively. It holds stocks of all sizes that tilt towards Value stocks but its market cap weighting undermines the factor screening used to pick its stocks and its toleration of lagging holdings is unfortunate.
What Do The Top Holdings of VOO and SCHD Tell Us About These ETFs?
Market cap weighted indexes have become very top heavy over the years of the raging bull market. So because both VOO and SCHD are market cap weighted I wondered to what extent a few stocks might be determining these ETFs’ performance.
We run into a problem here. Because VOO is technically a share of a mutual fund, it does not have to report its holdings daily the way SCHD, a pure ETF, must do. Vanguard’s latest report on its portfolio holdings as I write this on August 11 dates back to 6/30/2022. A lot has changed since then.
But one benefit of investing in VOO is that it tracks the S&P 500 index extremely closely. So you can always find out a lot about its current holdings by visiting SPY’s product page which reports data on the S&P 500 index and its holdings daily. Any differences in holding weight between the index and VOO will be minuscule, far less than the differences found between the actual holdings of VOO right now and the value of its holdings reported more than five weeks ago by Vanguard.
SCHD’s current holdings and their weights are listed on its product page as of the previous market closing, though metrics for the ETF are also dated back to 6/30/2022.
Top 10 Holdings of VOO and SCHD Compared
VOO SCHD
| Ticker | Name | Percent of ETF | Ticker | Name | Percent of ETF | |
| (AAPL) | Apple Inc. | 7.30% | (TXN) | Texas Instruments | 4.45% | |
| (MSFT) | Microsoft Corporation | 6.08% | (PEP) | PepsiCo | 4.36% | |
| (AMZN) | Amazon.com Inc. | 3.47% | (HD) | Home Depot | 4.24% | |
| (TSLA) | Tesla Inc | 2.05% | (AMGN) | Amgen | 4.19% | |
| (GOOGL) | Alphabet Inc. Class A | 2.02% | (KO) | Coca-Cola | 4.15% | |
| (GOOG) | Alphabet Inc. Class C | 1.87% | (MRK) | Merck & Co | 4.14% | |
| (BRK.B) | Berkshire Hathaway Inc. Class B | 1.52% | (CSCO) | Cisco Systems | 4.14% | |
| (UNH) | UnitedHealth Group Incorporated | 1.45% | (AVGO) | Broadcom | 3.90% | |
| (JNJ) | Johnson & Johnson | 1.29% | (PFE) | Pfizer | 3.85% | |
| (NVDA) | NVIDIA Corporation | 1.23% | (IBM) | International Business Machines | 3.80% | |
| TOTAL | 28.28% | TOTAL | 41.22% |
As you can see, 28 cents of every dollar you invest in VOO buys shares in just 10 top stocks. But the top heaviness of VOO is so concentrated in just four stocks, that 21.74% of every investment dollar put into VOO is buying shares of just Apple, Microsoft, Amazon, and the two share classes of Alphabet. The other 493 stocks held by VOO each play a far smaller part in the S&P 500’s performance. The S&P 500’s bottom 200 stocks ranked by weight together only make up 16.19% of the value of the whole index — far less than the top four stocks contribute.
SCHD currently holds only 100 stocks, far fewer stocks than VOO’s 503, so you would expect each stock in SCHD to constitute a greater proportion of the whole. But as you can see, its top 10 stocks make up a very significant 41.22% of its total value, four times what you’d see if the ETF was equal weighted. When I looked at what percentage of its value was contributed by the 50 stocks in SCHD with the 50 smallest market caps, I found that together those 50 stocks only contributed 7.37% of the value of the entire ETF.
Summary: Would You Buy The Top 10 Stocks of These ETFs If You Were Buying Individual Stocks?
I always ask this question when I examine the holdings of an ETF that is as top heavy as these. Though I am still not crazy about the valuations of the top stocks in VOO I would prefer to own them than I would the stocks that play such a large part in the performance of SCHD. My studies of VOO in the past have also taught me that one property of the S&P 500 is that over time the best profitable stocks in the market do rise to the top and you gain from having owned them as they grow. SCHD’s value emphasis will keep you from profiting from the growth of smaller stocks that become the Microsofts and Apples of the future.
How Have VOO And SCHD Performed?
Both ETFs have corrected since the beginning of 2022, though VOO corrected far more steeply than SCHD. Both have also regained considerable ground over the past six weeks during what some investors believe to be a bear market rally and others the beginning of another bull market. Looking only at this short-term performance, it would be easy to think that SCHD was the better investment. But that would be a mistake.
SCHD and VOO Total Return Since January 2, 2022
Seeking Alpha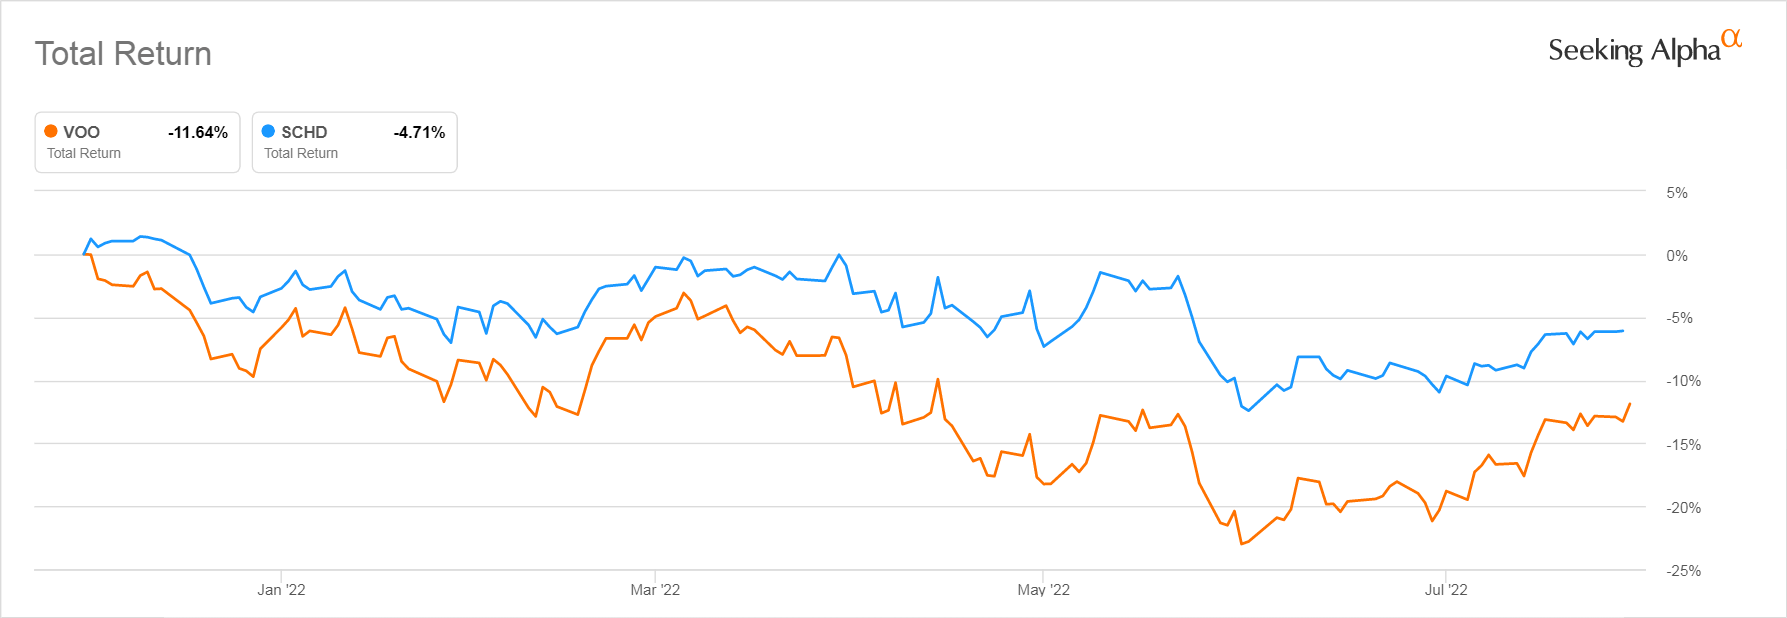
A look at the long-term performance of these two ETFs shows that VOO’s steeper underperformance compared to SCHD is largely explained by its years of tech-stock driven outperformance that extended from 2018 through the middle of 2021.
SCHD Has a Relatively Short Performance History Extending Only Through a Period of Extremely Low Rates
SCHD only started trading at the end of October, 2011. So we can only compare its long-term performance with that of VOO over a little more than decade.
SCHD and VOO Total Return Since SCHD Inception 10/31/2011
Seeking Alpha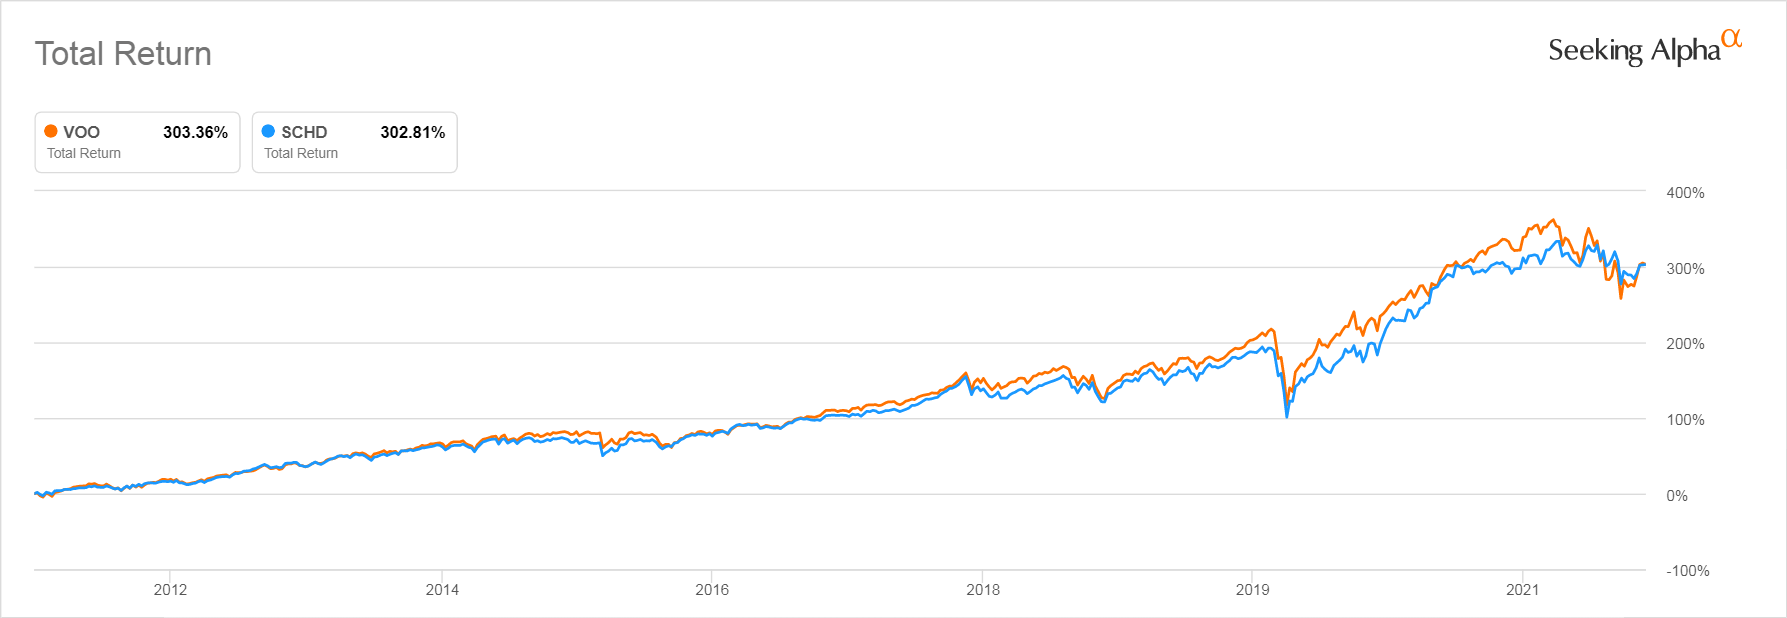
As you can see, The total return of these two ETFs is almost identical if we go back to SCHD’s inception. But again, this back test may be very misleading because SCHD has only traded during the years when the Fed has kept interest rates very close to zero.
Since 2008, retirees who have needed to draw income from their life savings have been forced to buy dividend stocks due to the Federal Reserve’s decade-long policy of forcing down interest rates. With annual inflation never even reaching the Fed’s target level of 2%, the yields of mature, slow growing companies that paid reliable dividends over 3% were very attractive.
SCHD and other dividend-centric ETFs were launched to take advantage of the interest in dividend investing. Seeking Alpha’s Assets Flows page tells us that over the past three years (which is the longest period they report) SCHD assets have grown by 286.12%. Over the same period, VOO’s assets have only grown by 61.60%, though keep in mind that VOO assets are worth $831 Billion. That is 25 times larger than SCHD’s assets of $33 billion.
The table below shows you what SCHD’s year-end dividend yield looked like throughout its short life.
Seeking Alpha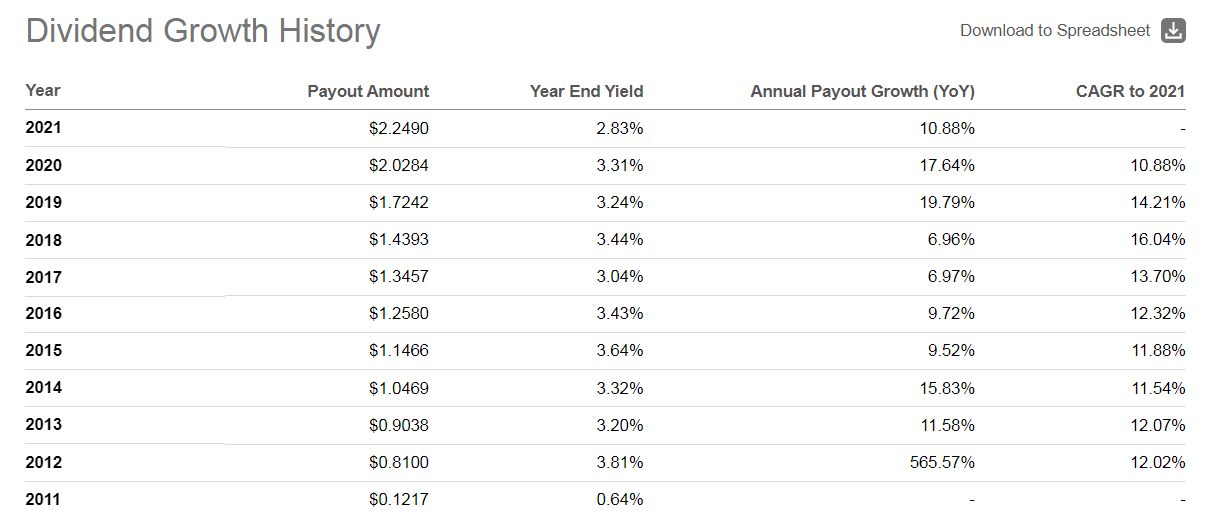
SCHD’s yield fluctuating between 3% and 3.5% with occasional outliers, were compelling over a long period when the highest CD rates available were mostly between 2% and 3% and investors feared bond funds would be punished by rates when they did rise.
Though the dollar amount of SCHD’s dividend payment rose steadily through this period, often at a double digit rate, the yield did not rise anywhere near as much. That’s because SCHD’s price kept rising at a rate just fast enough to keep the dividend attractive.
But as of now SCHD’s trailing 12-month dividend yield is only 3.25%, an amount that is just about equivalent to what you have recently been able to get in CDs with a 2-year maturity or longer. Forward looking estimated yields for dividend stocks are worthless since we don’t know how prices will behave, or for that matter, how much companies will raise their dividends, or even if they will.
If you believe that inflation is going to abate swiftly, SCHD might appeal. If, like me, you believe that inflation has a long way to go and will greatly curb both corporate and individual spending, you would be concerned that SCHD’s dividend would not compete well with safe fixed income yielding 4% or more, as fixed income rates as high as 7% were normal during the decades when inflation was a lot lower than it has been this past year.
VOO’s Performance During the Previous Period of High Inflation
Below you see how the price of the S&P 500 behaved during the period between 1973 and 1982 when the very lowest annual inflation rate was 1974’s 5.74% and the highest annual inflation rate was 1980’s 13.55%. During this period the annual inflation rate was above 10% for three years from 1979 to 1981. (Inflation data from Macrotrends)
S&P 500 Performance During The High Inflation 1970s
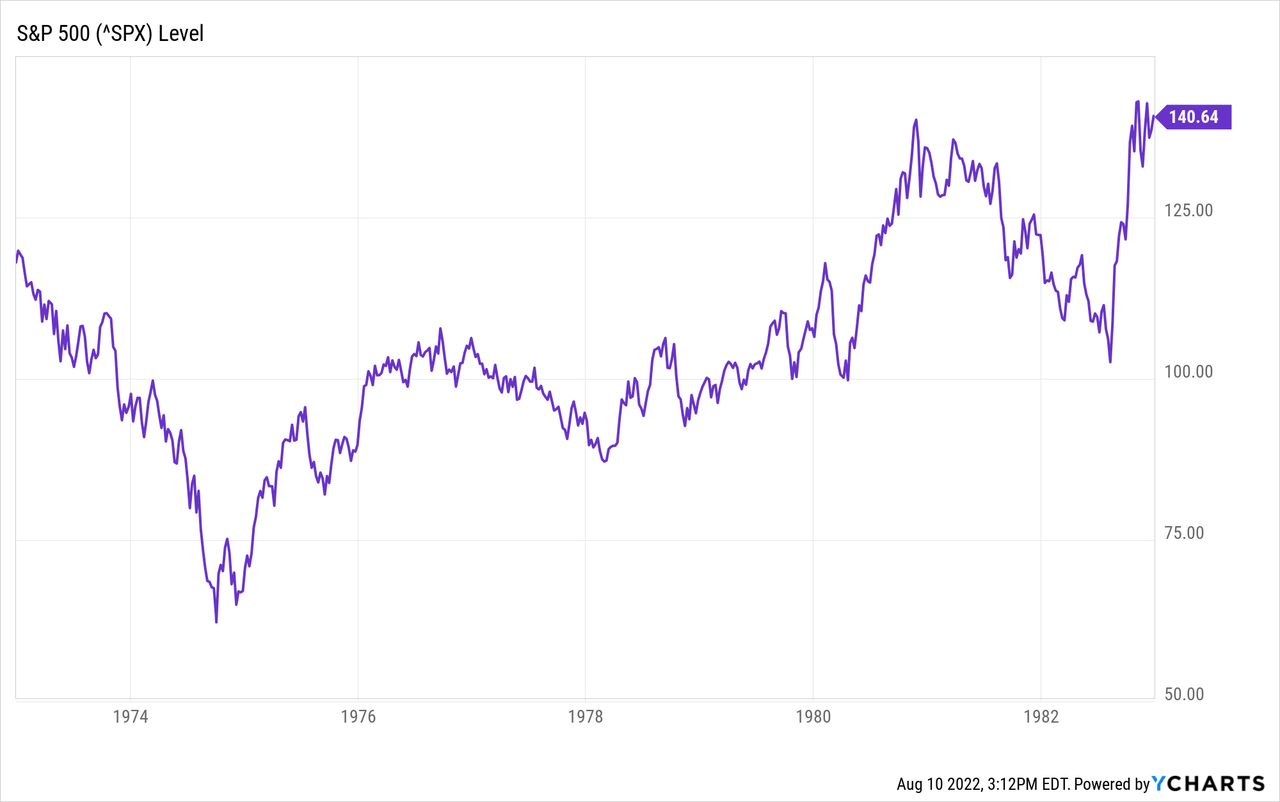
As you can see, market rebounded somewhat from the bear market caused by the Oil Shock of late 1973. Investors who bought the Vanguard 500 Index Fund’s initial share class (VFINX) when it launched in 1976, experienced a 4-year period during which only their dividends rewarded them for their investment. But that dividend yield was far higher than it is now. You can see the year-end dividend yield of the S&P 500 through those years in the table below.
S&P 500 Dividend Yield 1977 – 1981
| Dec 31, 1981 | 5.36% |
| Dec 31, 1980 | 4.61% |
| Dec 31, 1979 | 5.24% |
| Dec 31, 1978 | 5.28% |
| Dec 31, 1977 | 4.98% |
Source: Multipl.com, data credited to Shiller, Irrational Exuberance
The S&P 500’s current SEC dividend yield is 1.49%. Over the last 12 months it had a distribution yield of 1.46%. Quite a contrast!
Even with those higher rates in the 1970s, the S&P 500 Index Fund’s dividend was not enough to make up for the value erosion caused by the period’s high inflation. But that dividend was also a sign of how cheap the S&P 500’s stocks were back then. The highest its Price/Earnings ratio rose in the period following the inception of VFINX was 10.41 in early 1977. Its P/E ratio dropped as low as 7.39 by the start of 1980.
That low P/E was a tailwind for those investors by 1982 when VFINX shot up as investors rediscovered stocks, ushering in the great bull market of the 1980s. But throughout the 1970s most investors had fled stocks, preferring fixed income products with much higher yields and real assets like gold (GLD) and real estate.
The S&P 500’s current P/E ratio is currently 20.93 and VOO’s is likely to be almost identical. Contrasting that with the under 10 P/E of the S&P 500 during the 1970s’ high inflation years partly explains VOO’s current far lower dividend yield and makes it clear that we can’t use past performance to predict how VOO will perform going forward.
Buybacks Were Illegal in the 1970s
Another big reason that backtesting the S&P 500’s performance during historic periods of inflation is useless for predicting its future is that stock buybacks were illegal until 1982. That, not so coincidentally, is when the market finally started rising as the great bull market took off.
Stock buybacks currently make up nearly $1 Trillion of the total demand for stock shares. The impact of the Inflation Reduction Act’s tax on stock buybacks will be yet another factor to consider when contemplating stock investments in both VOO and SCHD as buybacks have juiced the earnings of many of their top holdings.
SCHD and VOO Key Metrics
It would be very helpful to contrast the P/E ratios and other valuation ratios of VOO and SCHD. Unfortunately, this is difficult to do because we only have out-of-date valuation data dating back to 6/30/2022 for SCHD. So while we can extrapolate VOO’s valuation from the more up-to-date figures we have for the S&P 500 index itself, we have no such recourse for SCHD.
Given that VOO has seen its price rise 11.29% since 6/30/2022 while SCHD has only risen 6.03% over the same period, any attempt to use 6/30/22 data to compare the two funds would only lead us into error.
That said, as was the case on 6/30/2022, when VOO’s P/E was 18.50 and SCHD’s 14.38 and VOO’s Price/cash Flow ratio was 14.59 while SCHD’s was 10.39, it is likely that the S&P 500 will usually have a higher valuation than SCHD. That is mostly due to VOO holding so many growth stocks that either don’t pay a dividend or whose price appreciation has caused their yield to sink too low to make it through SCHD’s screens.
How Do VOO and SCHD’s Sector Concentrations Differ?
Below you can see a chart that shows how the sector allocations of the two ETFs differ.
The author. Data from Vanguard and Schwab Asset Management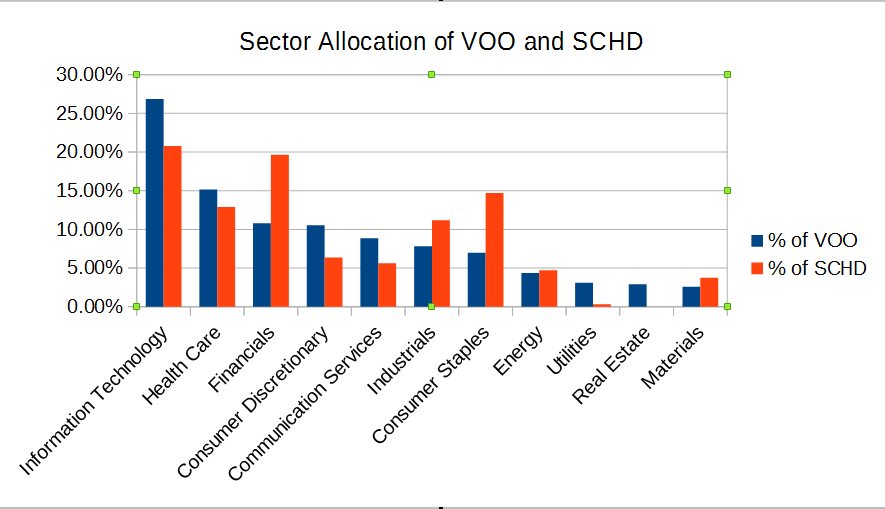
As you can see, SCHD has far more of its value invested in the Financials, Consumer Staples, industrials and Materials sectors than does VOO. VOO, in contrast, has a much higher allocation to stocks in the Information Technology, Consumer Discretionary, Utilities, and Real Estate sectors. Recall that SCHD holds no REITs while VOO does.
Style Comparisons
Sometimes you have to look away from the numbers and use the old noggin. Sector allocations tell us part of the story, but there is a huge difference between Information Technology stock Alphabet, which has been growing earnings at an annualized rate of 23.35% a year and Information Technology stock IBM, whose earnings have declined by 5.84% a year over the same period. SCHD’s seven Information Technology Stocks also include Western Union (WU) which grew earnings at an annualized rate of only 0.11% over the past five years.
Many of the 49 Financials sector stocks SCHD holds are small and mid cap regional banks and financial services companies with market caps between $500 Million and $5 Billion. These are not companies that do business worldwide like JPMorgan Chase (JPM) or Visa (V), which each make up roughly 1.03% of VOO. Their growth is likely to be extremely modest over the coming years, and that is only if they aren’t acquired by much larger companies.
Because so many robustly growing companies do not pay dividends, investors who invest in SCHD will miss out on the gains of successful growth stocks over the next decades.
There is also the factor to consider that the market cap size of the top stocks in VOO are so much larger than that of any other companies, and their access to capital so much greater, that they have the ability to buy up and incorporate interesting new growth companies as they emerge. We have seen how Amazon (AMZN) which pays no dividend has been turning itself into a major Cloud Services provider and how Alphabet, which also pays no dividend, has become a serious competitor in the cell phone business.
Are SCHD And VOO Good Long-Term Investments?
We know that VOO is a good long-term investment as its parent mutual fund’s very long history has taught us that it has held up well throughout long inflationary periods and has recovered relatively quickly from many market shocks of one kind or another over the decades in many very different economic environments, many of which SCHD has yet to experience.
SCHD’s dedication to holding value stocks makes it likely that it will perform like older value index funds. But value index funds only started trading with Vanguard Value Index Fund Investor Shares (VIVAX) in 1992, so we don’t have a longer history to study. From inception, SCHD’s performance mirrored that of VIVAX until the disruptions of 2020.
VIVAX, SCHD, and VOO Performance 10/31/2011 – 1/02/2020
Seeking Alpha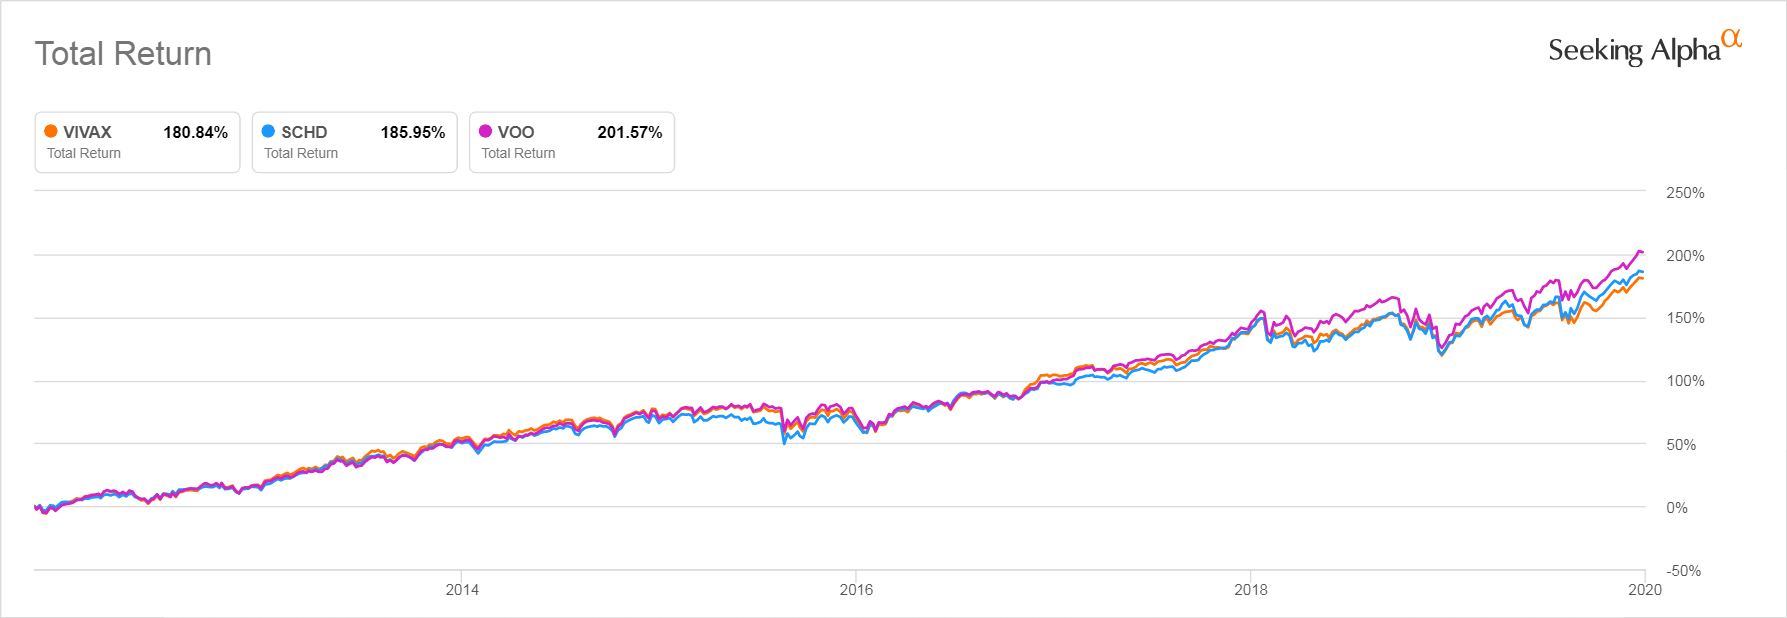
Unfortunately, because we don’t have data that might hint at how a value fund like SCHD would perform during a period of extended inflation and higher rates, it is hard to predict how it might perform. The value index fund VIVAX deeply underperformed the S&P 500 index fund VFINX in period when rates were considerably higher than they are now, before the Fed suppressed interest rates. The reason for that is the extreme impact of profitable growth stocks on the S&P 500’s results during the 1990s.
VFINX vs VIVAX 1992 – 2006
Seeking Alpha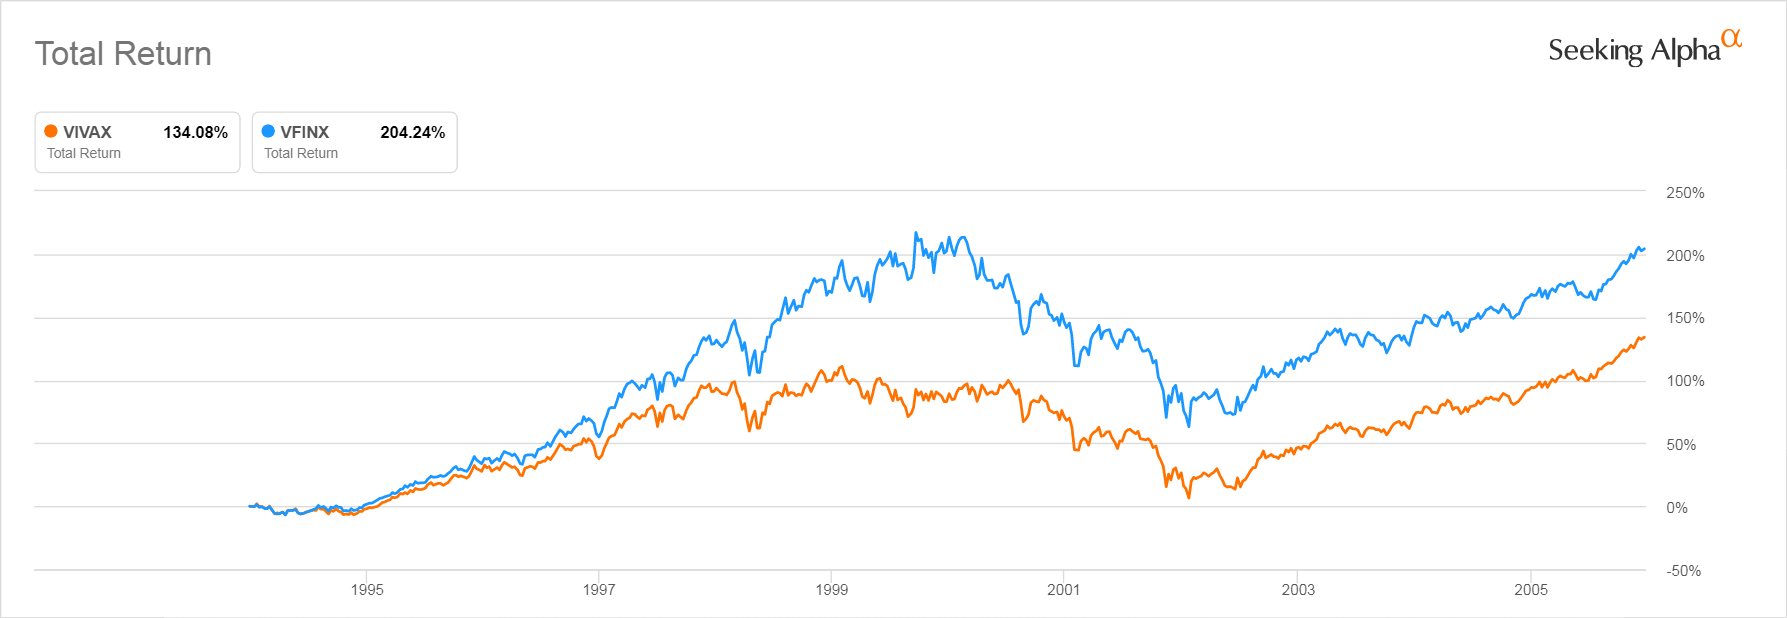
Is VOO or SCHD The Better Buy?
I would have to conclude that VOO is a better buy today for a younger investor who has decades over which they will be investing relatively small amounts each month. It’s ability to benefit from the emergence of young growth stocks and participate in their price appreciation is of the greatest value of this time span.
For an investor looking to invest a large amount right now I would suggest dollar cost averaging into VOO because its valuation still strikes me as being too high in view of the challenges that inflation and the impact of world events is having on multinational US companies’ ability to make sales and grow earnings. The coming 1% tax on buybacks might also dampen some of the upward movement of stock prices. I would be much happier investing larger sums in the S&P 500 when it’s P/E ratio was nearer 18 than 20 and its dividend closer to the 1.75% to 2.00% range characteristic of the past two decades rather than today’s 1.49%.
The fact that SCHD has only traded during a period of deeply suppressed rates makes it very hard to know what its future will look like. Looking at its recent performance, we might think that SCHD offers investors a less bumpy ride with a similar outcome to investing in VOO. But investing in stocks for their dividends may become less appealing to investors if safer fixed income rates above 4% become available.
Many investors have been taught that a 4% annual withdrawal rate is a safe withdrawal rate for retirees. Higher, far safer fixed income rates would decrease demand for SCHD’s shares and hence its price. If inflation persists and worldwide disruptions continue and lead to a prolonged bear market, SCHD’s 6% decline from January to June of 2020 has shown it is quite capable of losing asset value to an extent that erases the value of its dividends.
Be the first to comment