

marchmeena29
Forget “housing shortage.” It’s about crazy prices: For sales to revive at these mortgage rates, prices have got to come down a lot – and they’re starting to.
The plunge in home sales is just stunning. Sales of new single-family houses collapsed by 12.6% in July from the already beaten-down levels in June, and by nearly 30% from July last year, to a seasonally adjusted annual rate of 511,000 houses, the lowest since January 2016, and well below the lockdown lows, according to data from the Census Bureau on Tuesday.
New house sales plunged in every region compared to July last year. Note the West, oh dear:
- Northeast: -37%
- West: -50%
- Midwest: -23%
- South: -21%
New Single-Family Houses Sold Annual Rate (In ‘000s, Seasonally Adjusted) (Author)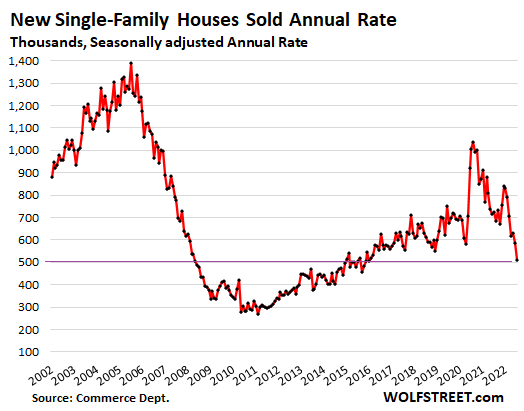
A similar plunge, but not quite as bad, occurred in sales of previously owned homes, which plunged by 20% across the US in July compared to a year ago. In California, sales of existing homes collapsed by 31% year-over-year; and in the previously hottest market, San Diego, by 41%!
Sales obviously would be a lot higher if prices were a lot lower and more people could actually buy at these mortgage rates – today, the average 30-year fixed rate is at 5.7% again, according to Mortgage News Daily – but it takes a sustained plunge in volume to hammer the message into increasingly motivated sellers what they need to do if they want to sell: They have to go where the buyers are, and the buyers are a lot lower.
Homebuilders know this because they have been lamenting for months the plunge in traffic of prospective buyers, according to the survey of homebuilders conducted by the National Association of Home Builders:
NAHB/Wells Fargo: Traffic Of Prospective Buyers (Author)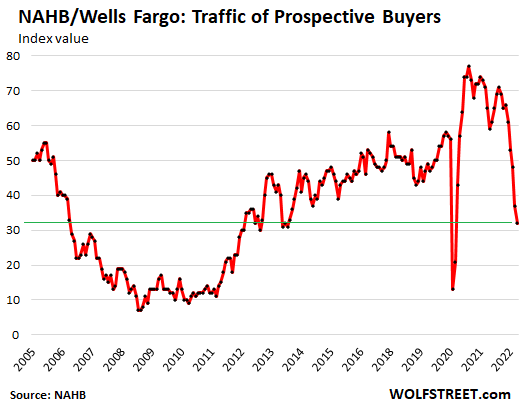
Suddenly no “housing shortage”: Inventories and supply spike to high heaven
Inventory for sale in all stages of construction jumped to 464,000 houses, up by 28% from July last year and the highest since March 2008:
New Single-Family Houses For Sale (In ‘000s, Seasonally Adjusted) (Author)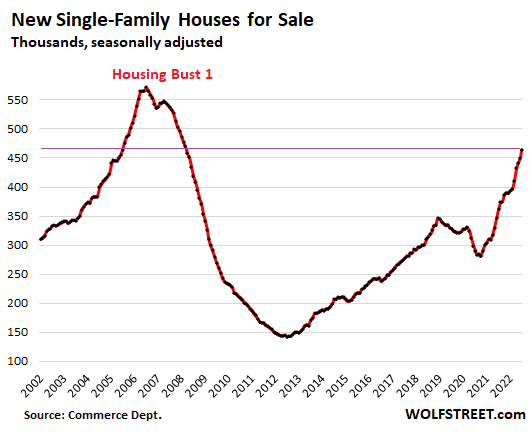
Supply of unsold new houses spiked to nearly 11 months of sales on this surge in inventory and the collapse in sales. This was the highest since the worst months of Housing Bust 1 in late 2008 and early 2009:
Months’ Supply Of New Houses (Not Seasonally Adjusted) (Author)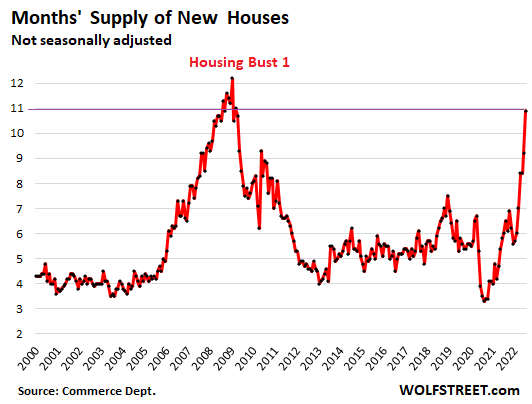
By region, unsold inventory jumped in three of the four regions, in terms of the percent increase year-over-year:
- Midwest: 51,000; +59%
- South: 272,000 houses; +27%
- West: 116,000 houses; +29%
- Northeast: 28,000 houses; unchanged.
Prices must come down at these mortgage rates, and they’re starting to
The median price of new single-family houses that were sold in July rose to $439,000, not quite undoing the plunge in June. This was down by $20,000 from the peak in April, whittling down the year-over-year gain to 8.2%, the smallest gain since November 2020. In a moment, we’ll look at the three-month moving average, which gives a clearer picture:
Median Price, New Single-Family Houses Sold (Author)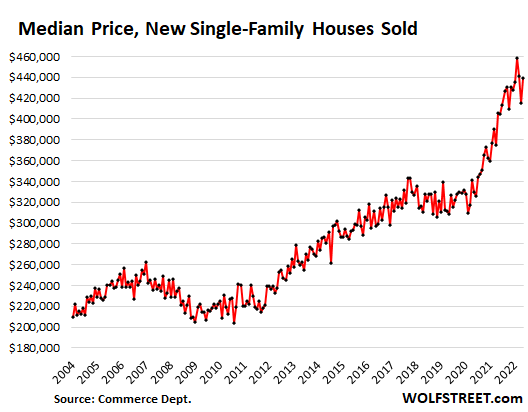
The three-month moving average, which irons out some of the month-to-month ups and downs of the median price, fell for the second month in a row, the first such decline since the lockdown months.
Note the crazy price distortions since then. And now with much higher mortgage rates, at those crazy prices, sales volume has collapsed, cancellations have spiked, and traffic of prospective buyers has plunged. If builders want to bring in buyers and sell houses, they’ve got to cut prices – and by a lot:
Median Price, New Single-Family Houses – 3-Month Average (Author)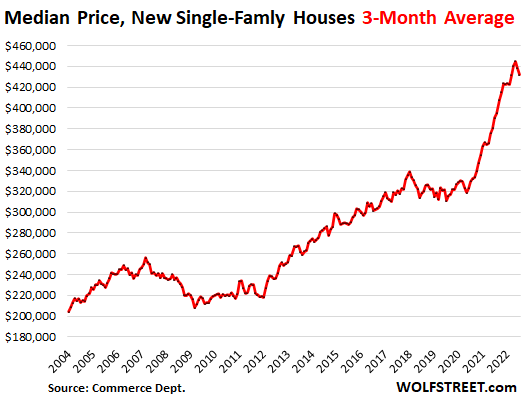
Worst construction cost inflation ever is rising less crazy fast as demand plunges
Over the past two years, spiking demand for new houses triggered astounding spikes in prices and shortages of materials and supplies, combined with a labor shortage that have delayed projects and inflated costs for homebuilders, and they passed those surging costs on to their over-eager customers – no problem, until suddenly customers balk, which is now.
Demand by homebuyers has collapsed by 30% year-over-year to multi-year lows. And homebuilders are throttling back their demand for materials and supplies, and suddenly the crazy price spikes abate.
Construction costs of single-family houses – excluding the cost of land and other non-construction costs – ticked up only 0.4% in July from June, according to separate data the Census Bureau released on Tuesday. Although that’s still big increase (around 5% annualized), it was by far the slowest increase since November 2020. The month-to-month increases had peaked at over 2% late last year, and in May and June were still at around 1.5%.
This whittled down the year-over-year spike in costs to 16.8%. Beyond the spikes this year, it was still the highest in the data going back to the 1960s. The previous high was in mid-1979 at 14%.
This chart shows the actual construction cost index and the cumulative nature of those price spikes. Note that during Housing Bust 1, construction costs actually fell – and this might be happening again as homebuilders cut back and demand sags.
Note that none of this goes into CPI inflation. The housing costs that enter into CPI are based on rents.
Construction Costs Index (Author)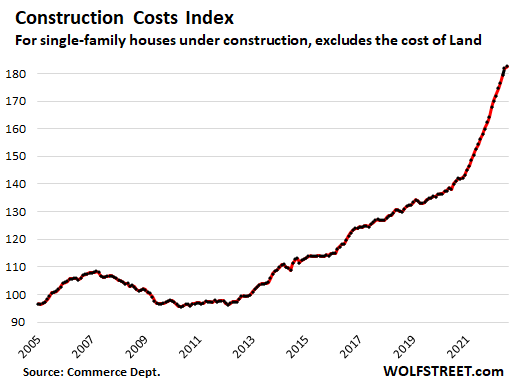
Homebuilder stocks: -25% to -40% year-to-date
The stocks of homebuilders are down between 25% and 40% year-to-date, despite a powerful summer rally, and have by far out-dropped the S&P 500 Index (-13% year-to-date):
- Horton (DHI): -32%
- Lennar (LEN): -29%
- PulteGroup (PHM): -28%
- NVR (NVR): -29%
- Taylor Morrison (TMHC): -25%
- Meritage (MTH): -32%
- KB Home (KBH): -33%
- Century (CCS): -40%
- LGI Homes (LGIH): -34%
Major Homebuilder Stocks (% Drop YTD) (Author)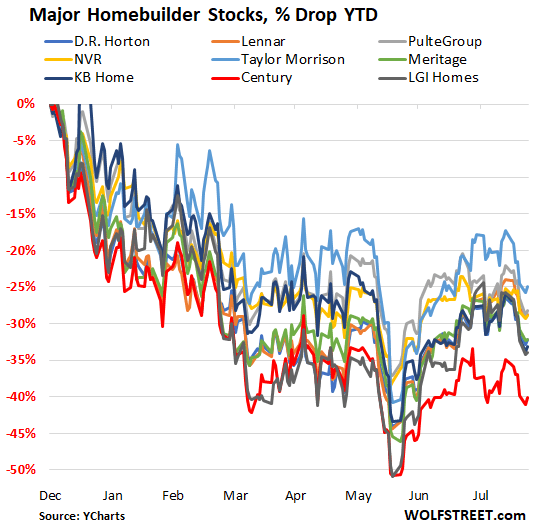
Editor’s Note: The summary bullets for this article were chosen by Seeking Alpha editors.
Be the first to comment