

JHVEPhoto/iStock Editorial via Getty Images
Introduction
This will be my first public article on Reinsurance Group of America (NYSE:RGA), but I first bought the stock in my marketplace service, The Cyclical Investor’s Club, on 3/19/20 during the March 2020 COVID crash. Since then, I have been patiently holding, waiting for things to normalize to a post-COVID world. While it has been a bumpy ride, the position has performed well overall.
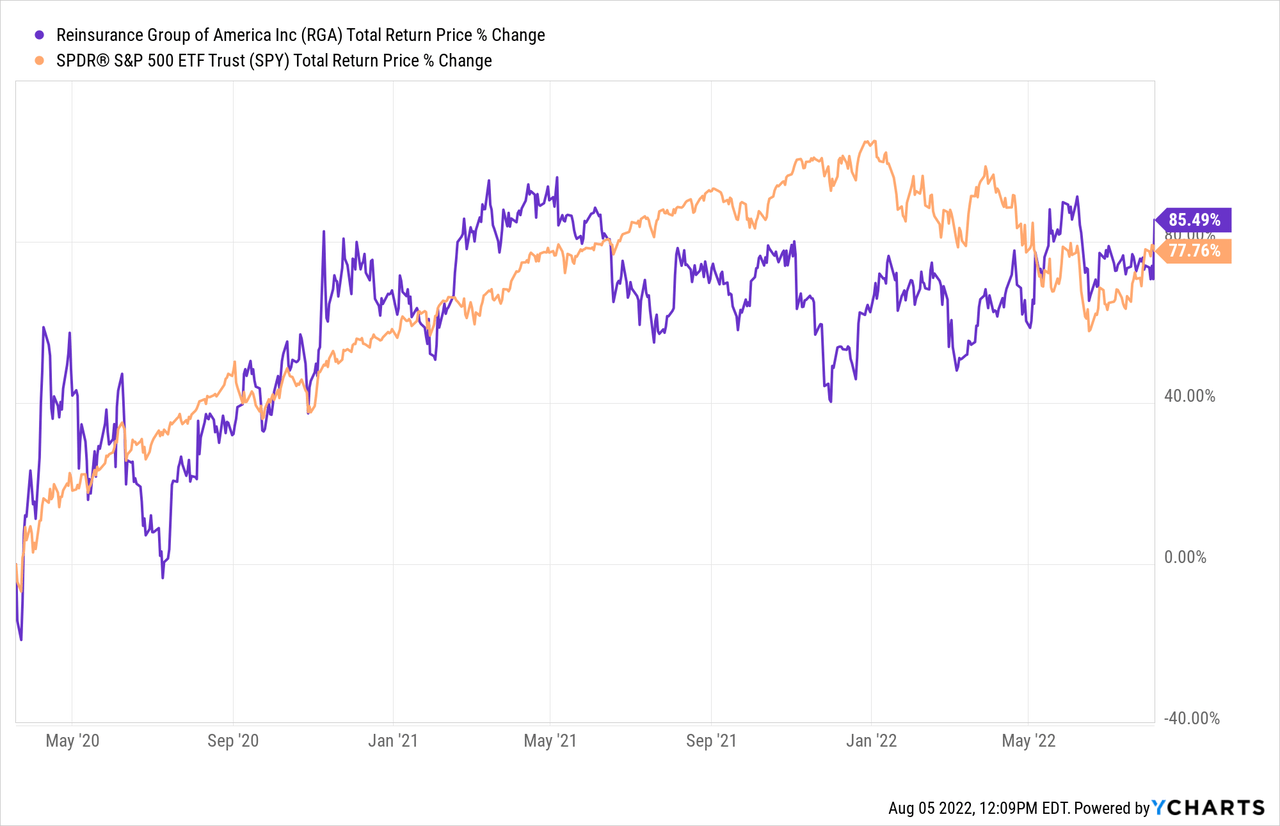
After underperforming during the past year, RGA recently surpassed the returns of the S&P 500 index after their latest earnings report. One thing that makes RGA so interesting in this market is that it could work as a counter-cyclical investment if the market continues to go lower and the economy weakens. If we look at the year-to-date returns, we can see that even as the S&P 500 has been falling, RGA has been rising. I think this trend is likely to continue over the near term.
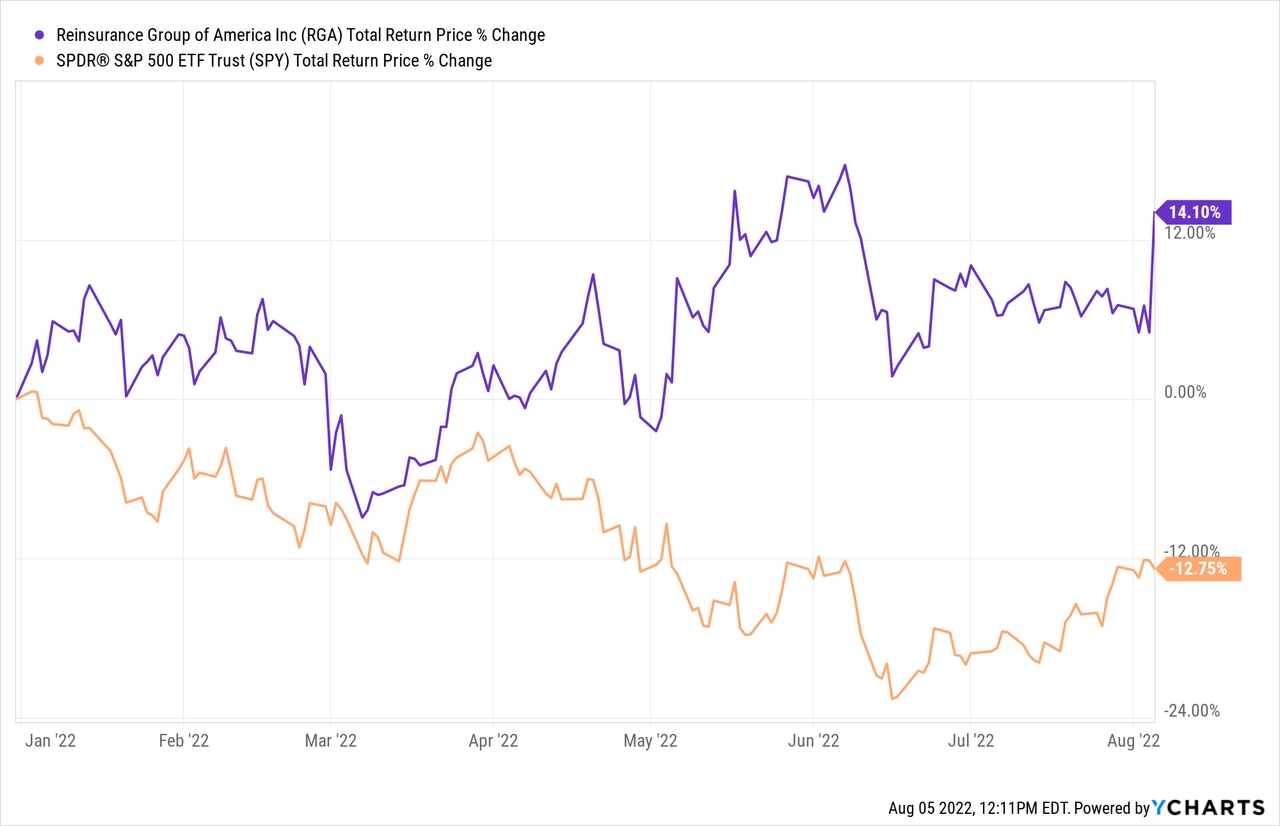
The stock has been a great counter-balance to much of the rest of the market this year, and it’s not nearly as cyclical as something like energy, which has also done well this year, but which is much more volatile and subject to fall if we have a recession.
In this article, I will share my analysis of RGA, which is a very similar analysis that led me to buy it in the first place back in March of 2020. However, it will require a few adjustments given the unusual circumstances we find ourselves in with COVID the past couple of years.
My Valuation Method
The valuation method I use for RGA first checks to see how cyclical earnings have been historically. Once it is determined that earnings aren’t too cyclical, then I use a combination of earnings, earnings growth, and P/E mean reversion to estimate future returns based on previous earnings growth and sentiment patterns. I take those expectations and apply them 10 years into the future, and then convert the results into an expected CAGR percentage. If the expected return is good, I will buy the stock, and if it’s really low, I will often sell a stock. In this article, I will take readers through each step of this process.
Importantly, once it is established that a business has a long history of relatively stable and predictable earnings growth, it doesn’t really matter to me what the business does. If it consistently makes more money over the course of each economic cycle, that’s what I care about. I don’t usually care too much about the story behind those earnings trends, unless, as in the case of RGA, an earnings decline can clearly be explained by some temporary macro issue. That’s typically the case with recessions, but sometimes, as we shall see, there can be other issues that arise as well.
How Cyclical Are Earnings?
Before I begin this analysis, I’ll check the business’s long-term earnings patterns in order to ensure that the business is a proper fit for this sort of analysis. If the historical earnings 1) don’t have a long enough history 2) are erratic in nature, or 3) are too cyclical, then I either avoid analyzing the stock altogether or I use a different type of analysis that is more appropriate.
FAST Graphs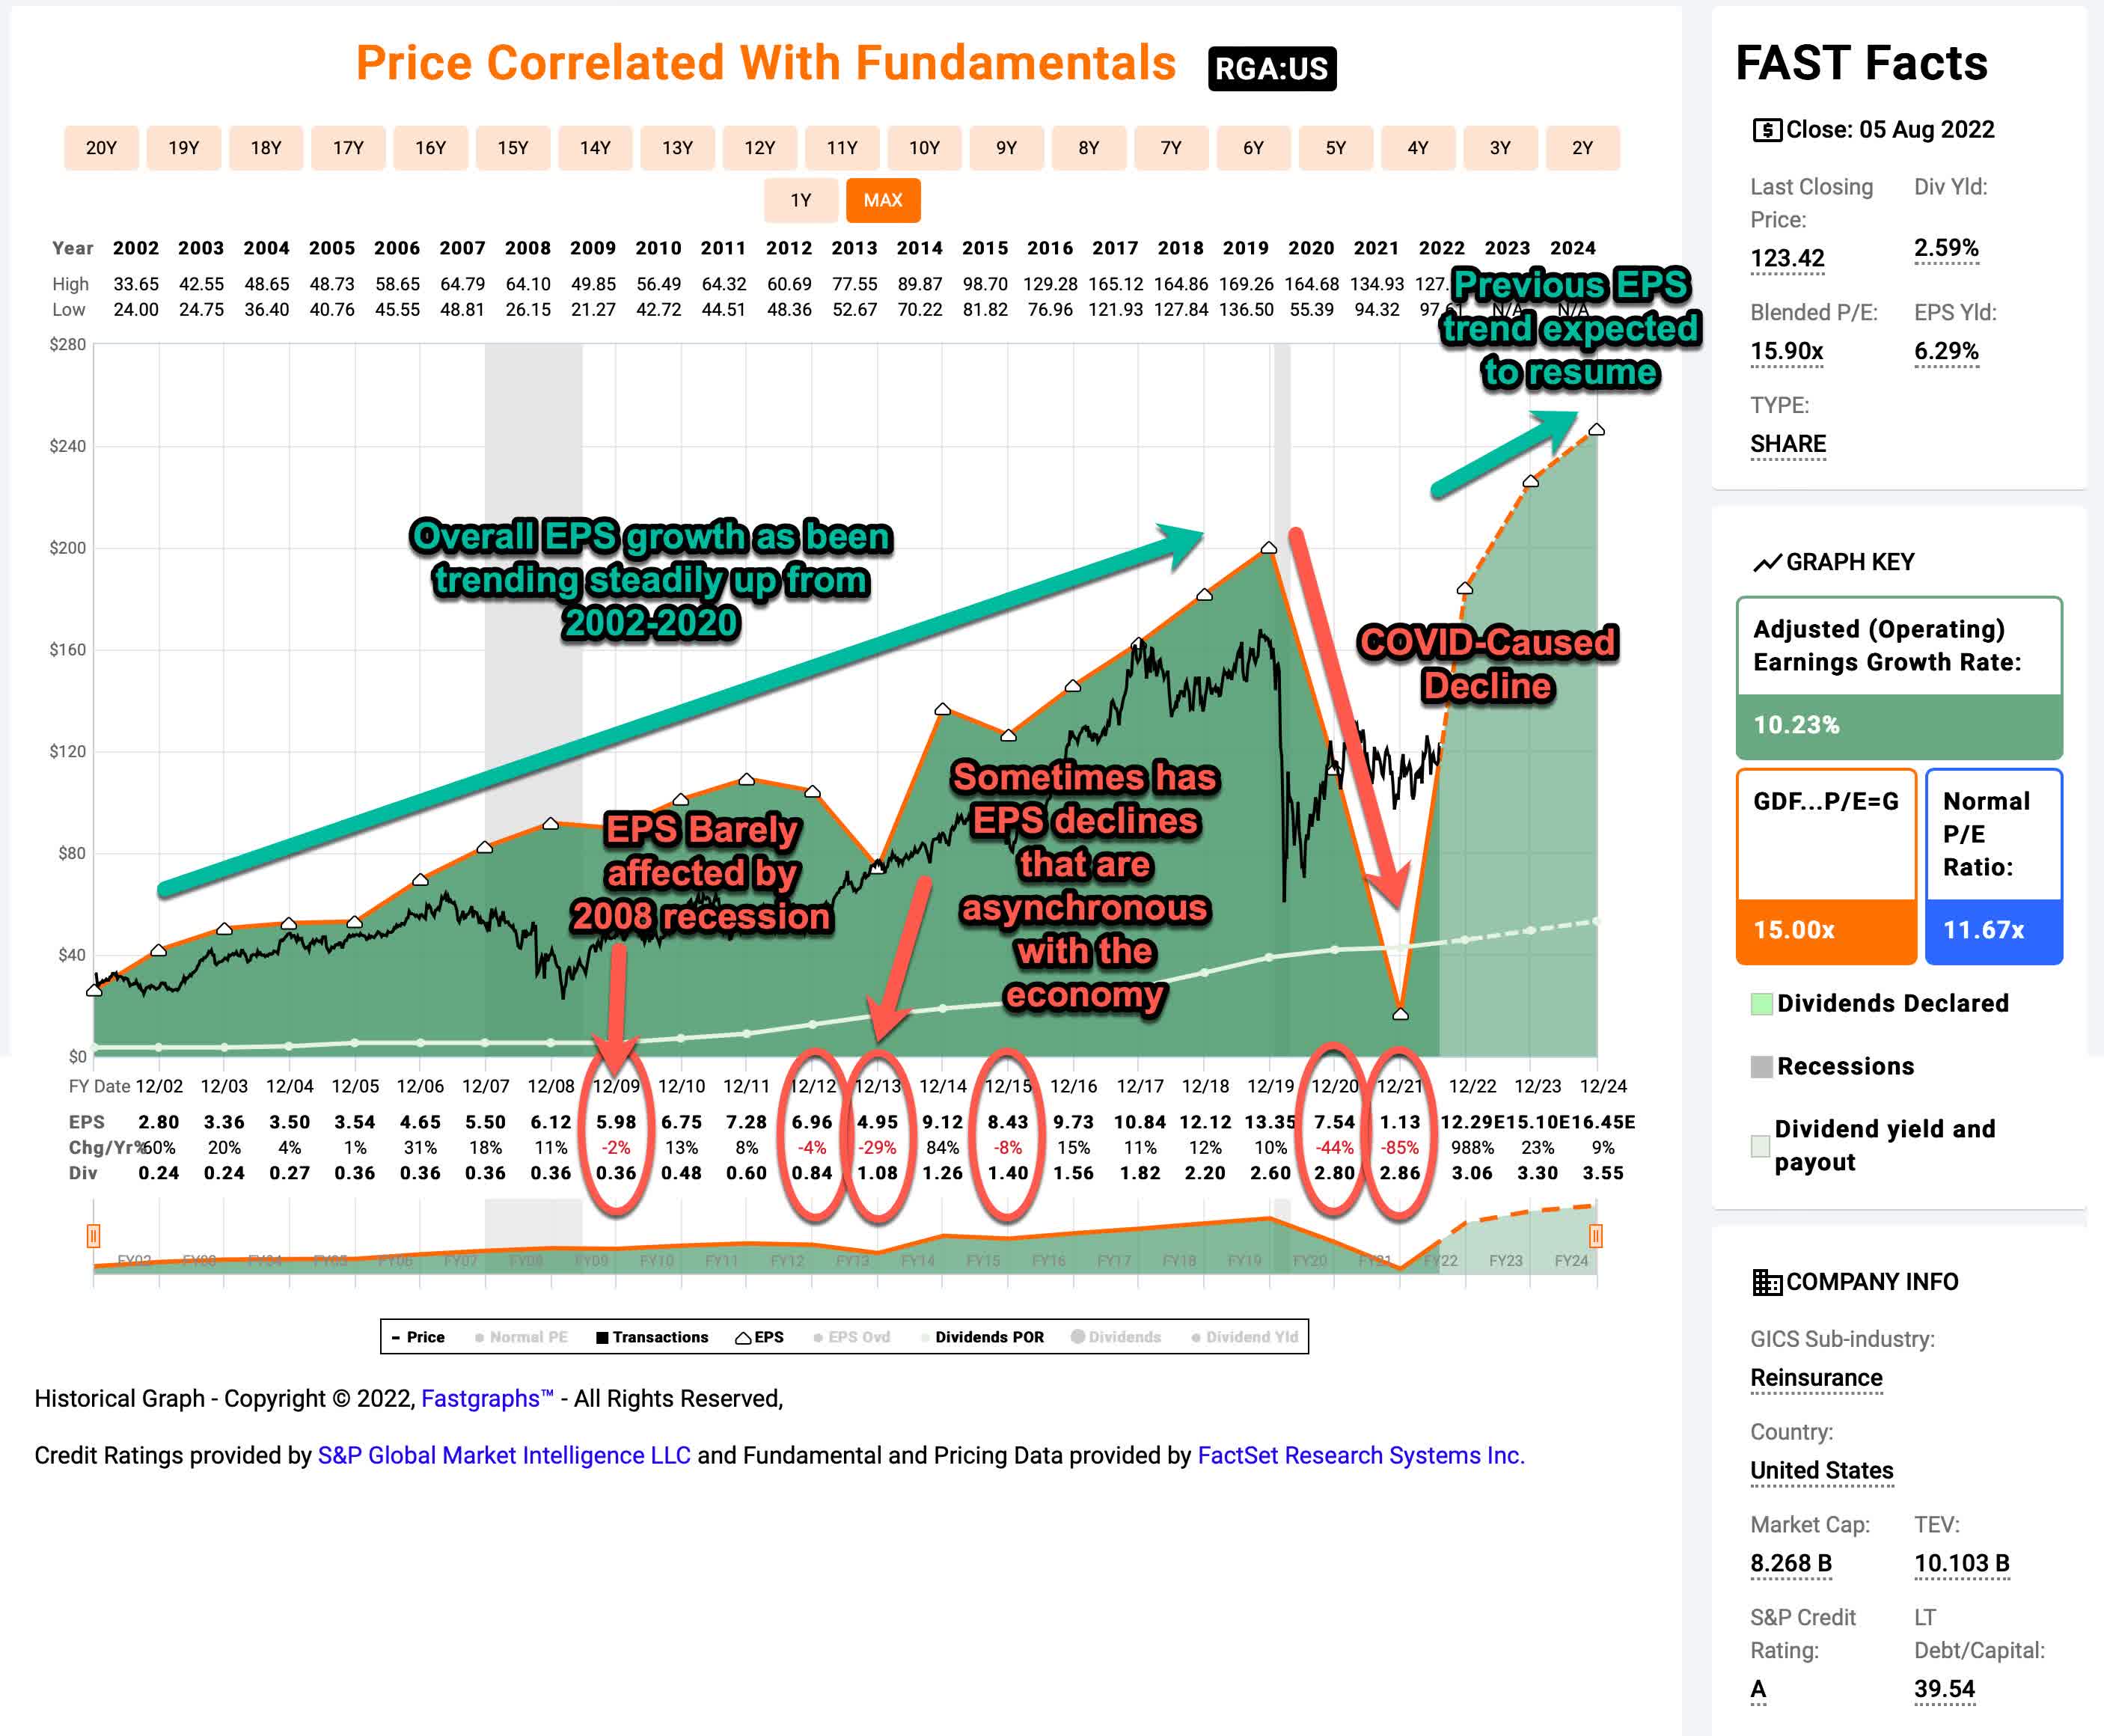
Examining RGA’s past 20 years of earnings history we can see that before 2020 their worst earnings growth decline was in 2012-2013 and was roughly a -33% decline. During the 2009 recession, EPS growth only fell -2%. What this tells me is that typically RGA’s earnings are not very cyclical in most situations and that when they do have declines, they aren’t necessarily tied to the performance of the wider economy. This means sometimes RGA can experience declines when the economy is doing okay, and sometimes the economy can be doing poorly, but RGA can be doing okay.
As we move ahead to the past two years, RGA has experienced much deeper earnings growth declines. These declines are mostly explained by insurance claims from people dying earlier than expected from COVID. Because treatments for COVID have improved, along with the development of vaccines, COVID mortality has decreased in 2022, and earnings have started to rise again. Because of the unique situation COVID has proven to be, I treat these earnings declines over the past two years as rare or one-time events, rather than cyclical declines in earnings we should expect to occur on a regular basis. For this reason, I exclude these declines when considering whether RGA’s earnings are “cyclical” or not.
Putting this all together, when we aren’t in a deadly pandemic, RGA’s earnings are stable enough to categorize it as a “less-cyclical” business, and therefore the analysis I’m going to share is appropriate for the stock unless we have another pandemic in the near future, or COVID becomes more deadly over the next couple of years.
Market Sentiment Return Expectations
In order to estimate what sort of returns we might expect over the next 10 years, let’s begin by examining what return we could expect 10 years from now if the P/E multiple were to revert to its mean from the previous economic cycle. For this, I’m using a period that runs from 2015-2022.
FAST Graphs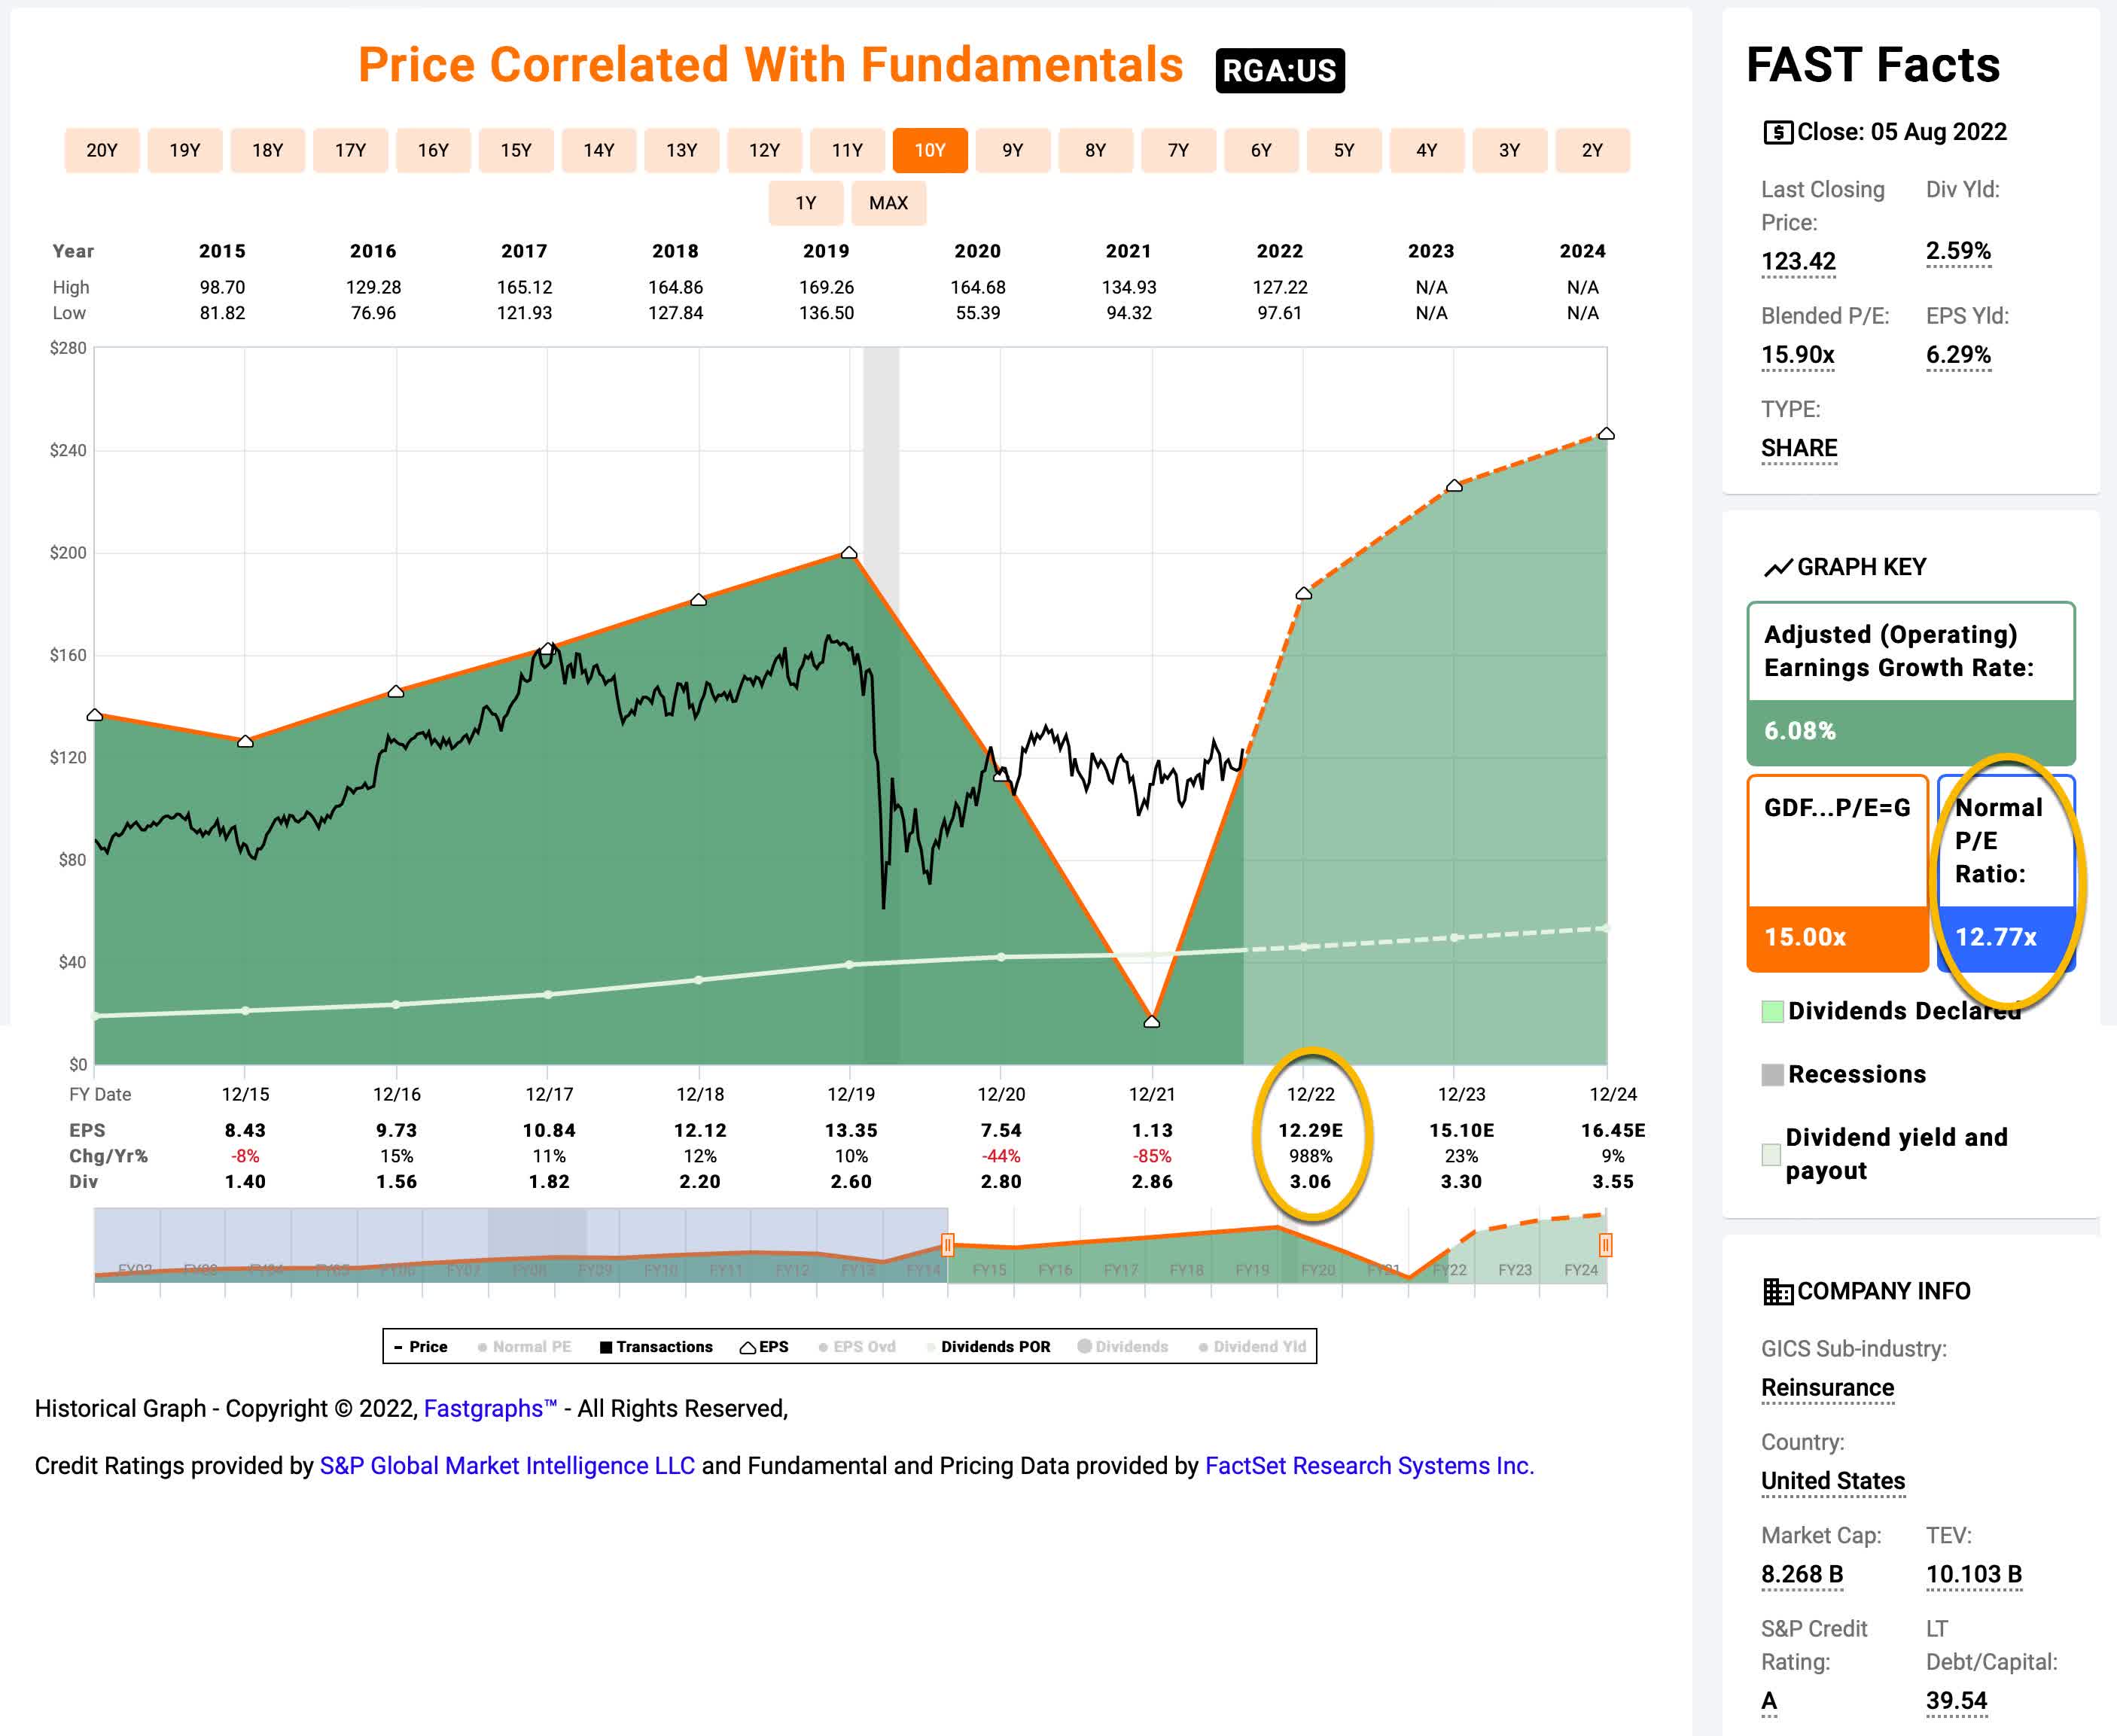
RGA’s average P/E from 2015 to the present has been about 12.77 (the blue bar circled in gold on the FAST Graph). Using 2022’s forward earnings estimates of $12.29 (also circled in gold), RGA has a current P/E of 10.09. If that 10.09 P/E were to revert to the average P/E of 12.77 over the course of the next 10 years and everything else was held the same, RGA’s price would rise and it would produce a 10-Year CAGR of +2.83%. That’s the annual return we can expect from sentiment mean reversion if it takes ten years to revert. If it takes less time to revert, the return would be higher.
Business Earnings Expectations
We previously examined what would happen if market sentiment reverted to the mean. This is entirely determined by the mood of the market and is quite often disconnected, or only loosely connected, to the performance of the actual business. In this section, we will examine the actual earnings of the business. The goal here is simple: We want to know how much money we would earn (expressed in the form of a CAGR %) over the course of 10 years if we bought the business at today’s prices and kept all of the earnings for ourselves.
There are two main components of this: the first is the earnings yield and the second is the rate at which the earnings can be expected to grow. Let’s start with the earnings yield (which is an inverted P/E ratio, so, the Earnings/Price ratio). The current earnings yield is about +9.91%. The way I like to think about this is, if I bought the company’s whole business right now for $100, I would earn $9.91 per year on my investment if earnings remained the same for the next 10 years.
The next step is to estimate the company’s earnings growth during this time period. I do that by figuring out at what rate earnings grew during the last cycle and applying that rate to the next 10 years. This involves calculating the historical EPS growth rate, taking into account each year’s EPS growth or decline, and then backing out any share buybacks that occurred over that time period (because reducing shares will increase the EPS due to fewer shares). Because 2020 and 2021 were so unusual and unlikely to repeat, I am going to use the time-frame from 2007-2020, which includes a recession and a couple of negative earnings growth years, to estimate RGA’s potential medium-term earnings growth rate.
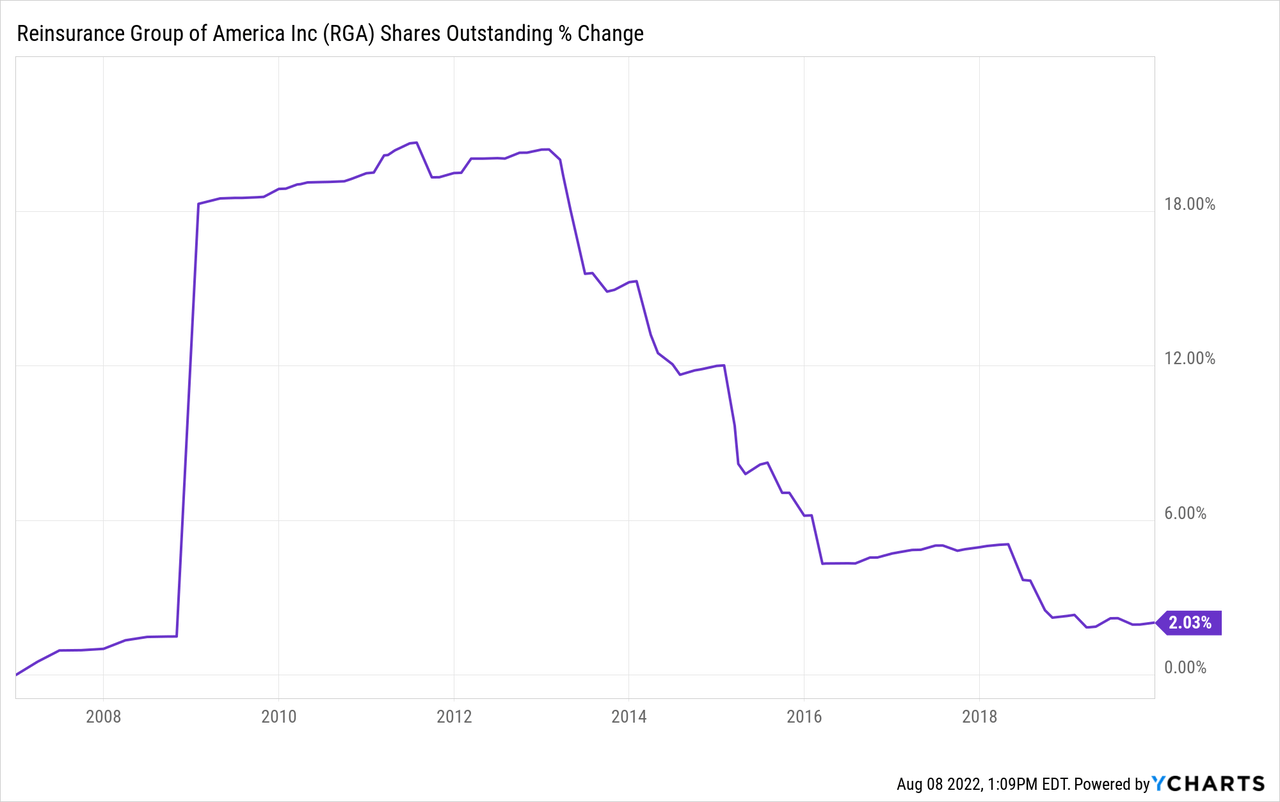
RGA’s overall share count increased slightly during this time period, so I won’t need to make adjustments for that, but I will adjust for the four years in which they had negative earnings growth during this time period. After doing that, I estimate an earnings growth rate of +8.36%.
Next, I’ll apply that growth rate to current earnings, looking forward 10 years in order to get a final 10-year CAGR estimate. The way I think about this is, if I bought RGA’s whole business for $100, it would pay me back $9.91 plus +8.36% growth the first year, and that amount would grow at +8.36% per year for 10 years after that. I want to know how much money I would have in total at the end of 10 years on my $100 investment, which I calculate to be about $258.22 (including the original $100). When I plug that growth into a CAGR calculator, that translates to a +9.95% 10-year CAGR estimate for the expected business earnings returns.
10-Year, Full-Cycle CAGR Estimate
Potential future returns can come from two main places: market sentiment returns or business earnings returns. If we assume that market sentiment reverts to the mean from the last cycle over the next 10 years for RGA, it will produce a +2.83% CAGR. If the earnings yield and growth are similar to the last cycle, the company should produce somewhere around a +9.95% 10-year CAGR. If we put the two together, we get an expected 10-year, full-cycle CAGR of +12.78% at today’s price.
My Buy/Sell/Hold range for this category of stocks is: above a 12% CAGR is a Buy, below a 4% expected CAGR is a Sell, and in between 4% and 12% is a Hold. A +12.78% CAGR expectation makes RGA a “Buy” at today’s price.
Additional Considerations
Because I think we have a high risk of recession in 2023 and that analysts’ earnings estimates are likely too high for many stocks, I have been including a factor that I call “Recession P/E” into many of my valuations this year. The idea behind this additional factor is that earnings are likely to be lower than expected in the future, which means that P/E ratios are likely higher right now than investors realize for many stocks. But because RGA’s earnings were severely impacted by COVID, it’s one of the few stocks whose earnings estimates have been too low this year, rather than too high. In fact, analysts boosted their EPS estimates by about 20% for this year after RGA’s latest earnings report.
So, because estimates are already low for RGA, and because their business isn’t typically deeply impacted by “normal” recessionary declines, I think even if we do have a recession, while it’s true that RGA’s price could drop, I would expect it to be more defensive than the wider market (just as it has been year-to-date). For this reason, RGA is probably a solid addition to many investors’ portfolios at this stage of the market. The stock price peaked at $169 per share in late 2019, pre-COVID, and it was probably fairly valued at that time. I think it would be a reasonable expectation that it could return to that price by the end of 2023 and still not be particularly overvalued. That would be about +35% upside from today’s price.
Overall RGA offers a pretty good risk/reward in a market where the risk/reward on most stocks isn’t particularly good right now. This strategy is designed to take 1% to 2% portfolio-weighted positions, and I would feel comfortable buying it to today with that weighting if I didn’t already own it. If you would like to take a bigger portfolio position, I would certainly do deeper research than I have provided in this article. But for an unconcentrated portfolio, RGA has a profile of a stock that is likely to perform well over the next 2-5 years.
Be the first to comment