

Prostock-Studio
Article Thesis
Cenovus Energy Inc. (NYSE:CVE) (TSX:CVE:CA) is a leading Canadian energy company that is extremely profitable in the current oil price environment. The company has been cleaning up its balance sheet quickly in recent years and should reach the lower bound of its net debt target in a couple of quarters. At that point, its shareholder returns will soar from an already attractive level to an even higher one, which could lead to a rerating of the currently pretty inexpensive stock.
Massive Profits And Cash Flows In The Current Environment
Oil and natural gas prices are high, and so are crack spreads. This results in an environment that is highly beneficial for Cenovus’ profitability and its cash generation ability.
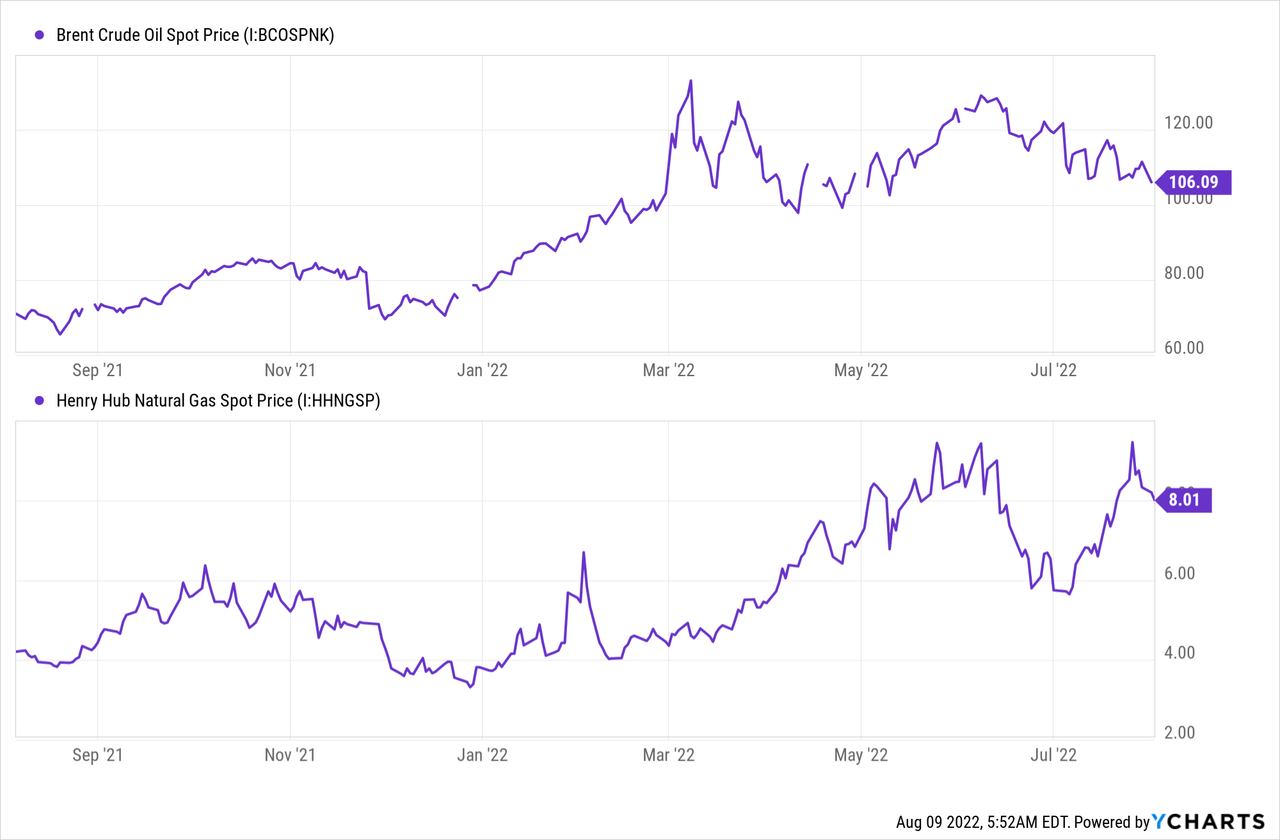
In the above chart, we see the pricing for crude oil (Brent) and natural gas (Henry Hub). Both are off their recent highs, but still at a very elevated level compared to half a year or a year ago. The average pricing during the second quarter, i.e. April-June, is not too far off the current prices. As a company that is mainly active in Canada, Cenovus Energy is not 100% correlated to Brent and Henry Hub pricing, as Western Canadian Select/WCS is the more important type of crude oil, but you get the idea that energy prices are still at a very favorable level.
Since Cenovus Energy also owns refining assets, crack spreads are an important factor for its profitability as well. Those are also off their 52-week highs, but still at a pretty elevated level compared to the longer-term average. Not surprisingly, Cenovus has been generating great results in this environment.
During the second quarter, Cenovus Energy earned C$1.19 on a per-share basis when using GAAP numbers. That’s equal to around C$4.80 annualized, which translates into roughly US$3.70. With Cenovus Energy trading at US$17 today, we get to an earnings multiple of just 4.6, which indicates a very low valuation.
Looking at the company’s cash flows, we see similarly strong results and an equally low valuation. During the second quarter, this is what Cenovus Energy’s cash flows looked like:
CVE presentation
Adjusted funds flow totaled C$3.1 billion, which, after accounting for capital expenditures for maintenance and growth projects, resulted in C$2.3 billion. Annualized, that’s C$9.2 billion, which translates into US$7.2 billion at current exchange rates. Since Cenovus Energy is valued at US$33 billion today, the company is thus trading at just 4.6x the Q2 free cash flow run rate. This equates to a free cash flow yield of 22%. In other words, Cenovus Energy generates more than 20% of its equity value in pure cash per year in the current environment, with all organic investments already being accounted for.
It should be noted that the company’s second-quarter results include an unfavorable impact from hedging. Due to having hedged some of its production in the past, at prices that are lower than the current market price, Cenovus Energy suffered from a C$600 million hedging loss. Cenovus Energy’s hedges are running off, which should mean that earnings power will be even stronger in the second half of the year and in 2023, all else equal. Since oil prices have pulled back in recent weeks, although they are still at a pretty high level, we can be conservative and assume that future cash flow will not climb despite these hedging losses falling off. The US$7 billion of free cash flow per year in the current environment could thus be a somewhat conservative estimate, I believe. It is also important to note that the company’s ongoing debt reduction efforts result in lower interest expenses, which improves free cash generation as well, even at unchanged commodity prices and production volumes.
Shareholder Returns Are High And Will Climb Higher
Cenovus Energy has a pretty thought-out and well-articulated strategy for how it uses its cash flows that we can see in the following slide:
Cenovus presentation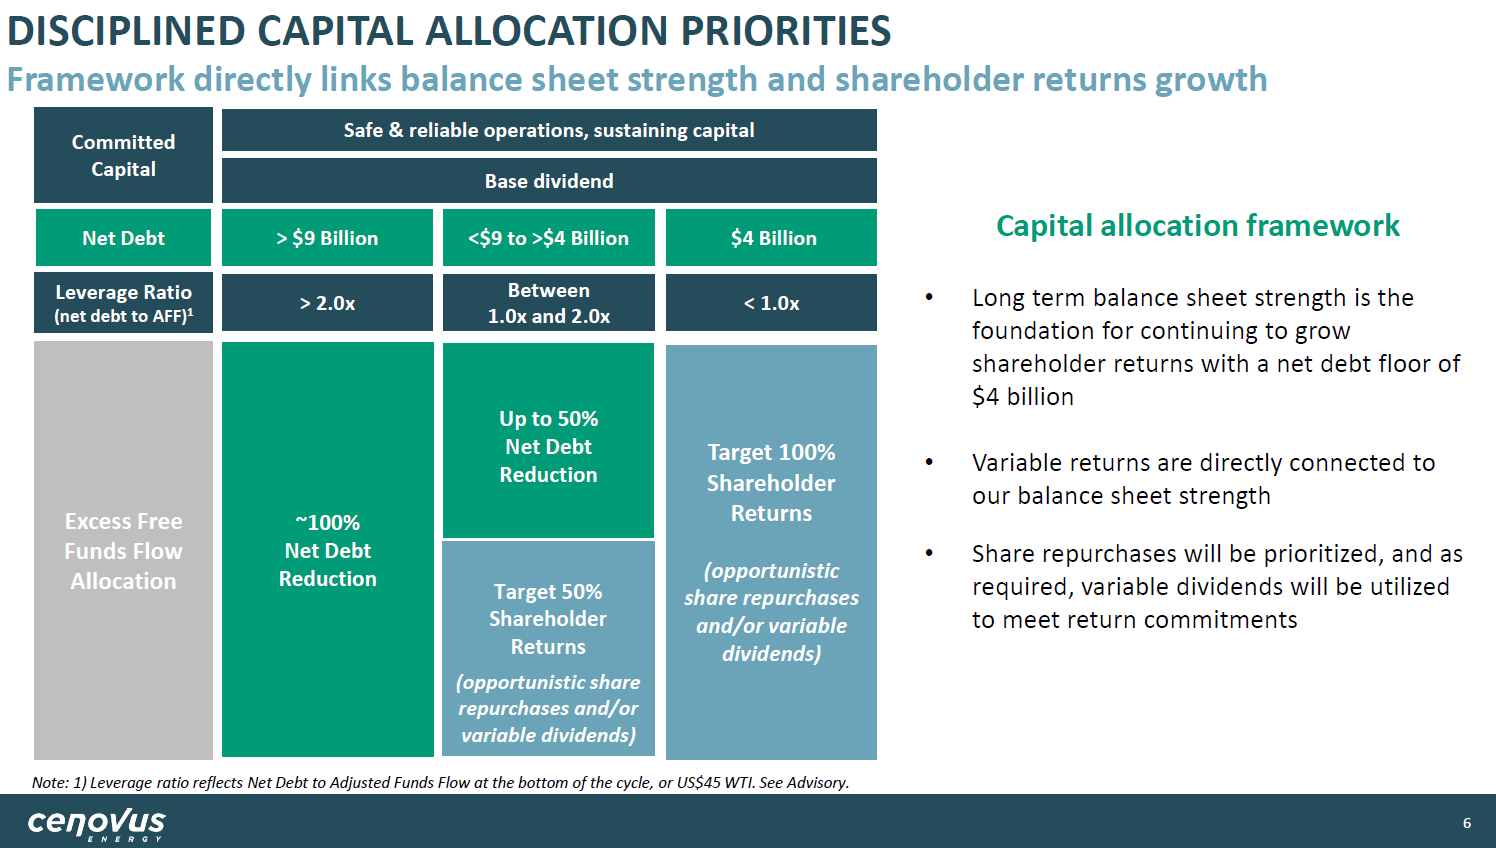
There are three levels of net debt, and depending on the “stage” Cenovus Energy is in, it will use its cash flows differently. The boundaries for these stages are set by looking at Cenovus Energy’s net debt to EBITDA level in a US$45 oil price environment. If oil traded at US$45 per barrel, the company would generate EBITDA of slightly more than C$4 billion. So a C$4 billion net debt position would mean a leverage ratio of less than 1, even in a scenario where oil prices are pretty low. We can thus say that the company would be pretty conservatively financed with net debt this low, which is why management does not see any advantage in reducing net debt further once that net debt level is reached. If net debt drops to C$4 billion, no more funds will be used for debt reduction — instead, all of the company’s free cash flow will be returned to the company’s owners.
With net debt at higher levels, Cenovus Energy will use some of its funds for debt reduction. Right now, we are in the middle tier from the above chart, as net debt stands at C$7.5 billion right now. The company will thus use half of its free cash flow for debt reduction while using the other half for shareholder returns via buybacks or additional dividends. Note that the company’s base dividend is being paid in any scenario, as the 50%/50% split only relates to what Cenovus calls its excess free funds, i.e. operating cash flow minus capital expenditures minus its regular dividend.
Cenovus has generated C$2 billion of excess free funds in Q2, thus C$1 billion was used for debt reduction, and $1 billion was used for buybacks under the company’s current program that covers ~7% of its shares. The C$1 billion buyback pace results in a 9.5% share count reduction per year, with prices where they stand today. It will thus take Cenovus less than a year to complete the current buyback program if it keeps the buyback pace at the current level.
If H2’s cash flows are comparable to Q2, the company would end the year with a net debt position of C$5.5 billion, and it would take the company until spring 2023 to hit the C$4 billion net debt target. This might be a conservative estimate, however, as actual debt reduction could be even faster. First, the company could generate higher free cash flows in H2 based on its loss-generating hedges falling off and due to lower interest expenses. On top of that, non-core asset sales could lead to additional cash proceeds that could accelerate the debt reduction effort.
This is reflected in CEO Alex Pourbais’ remarks during the Q2 earnings call:
“In terms of kind of forecast, we don’t forecast cash flow. But I look at where all of the analysts are, and I think most of them expect that we’ll probably be at that $4 billion floor sometime either before or around the end of the year. And I wouldn’t see anything that would move me off that view.”
So insiders and Wall Street analysts believe that the lower bound of the net debt target could be hit before spring 2023, which would mean that even higher cash returns will be coming just a couple of months from now. How those cash returns will be made up, between variable/special dividends and buybacks, depends on two factors. First, the attractiveness of buybacks naturally depends on the valuation CVE trades at — the lower the share price and valuation, the higher the payoff of doing buybacks. With CVE trading at less than 5x forward earnings and cash flow, buybacks are very attractive, I believe. There’s also a regulatory impact to consider, however. For Canada-listed companies, buybacks can’t be done without limits. Under CVE’s current normal course issuer bid, it can only buy back 7% of its shares, and once that program is finished, CVE has to apply to get a new program approved. That will work out eventually, but there will most likely be limits in terms of how much CVE can spend on buybacks in a short period of time. With CVE potentially returning 20%+ of its market capitalization to shareholders in 2023, it is not clear that it will be possible to do all of that via buybacks. Maybe CVE can only return 10% or 12% or 15% via buybacks, in which case it would have to do the remainder via dividends — which still would be compelling, of course.
Final Thoughts
Cenovus is a top-tier energy company — it’s active across the value chain, including production and refining, it owns low-cost, low-decline assets that require small investments, and it generates hefty earnings and cash flows. Even more of that cash will be flowing towards shareholders a couple of quarters from now, and potentially as early as the end of 2022. Even if it takes until spring or summer 2023, it is pretty clear that shareholders will be receiving pretty hefty payouts in the coming years, at least if oil prices remain at a supportive level.
I do believe that Cenovus is attractively priced right here, at less than 5x forward earnings and cash flows, and trading for an EV/EBITDA multiple of just 2.8. When buybacks and variable dividends increase, Cenovus could benefit from a rerating of its multiple, which could lead to substantial upside potential. And even if that were not to happen, I’m pretty happy as long as Cenovus can buy back shares aggressively at a low valuation, thereby generating a lot of long-term shareholder value.
Be the first to comment