

syahrir maulana/iStock via Getty Images
(This article was co-produced with Hoya Capital Real Estate)
Information
PIMCO, or the Pacific Investment Management Company, is an American investment management firm, owned by Allianz Asset Management of America since 2000. The firm focuses on fixed income and manages more than $2 trillion in assets. They offer not only Closed-End Funds, but also exchange-traded funds (“ETFs”) and Interval Funds. While PIMCO has made their name in fixed-income, they now offer both equity and allocation funds.
Naturally, with all those funds, performance will vary, even amongst funds that basically follow the same investment philosophy. Knowing which to avoid based on past results should aid investors in owning the better performers. Based on that rule, the PIMCO Strategic Income Fund, Inc. (NYSE:RCS) is a fund even PIMCO lovers might want to avoid; they have better choices. That said, RCS currently is at a low premium for a PIMCO CEF, which could mean a better future is ahead.
For more on PIMCO and their investment approach, they provide a PDF.
Exploring the PIMCO Strategic Income Fund
Seeking Alpha describes this CEF as:
The Fund aims to generate a level of income that is higher than that created by high-quality, intermediate-term U.S. debt securities. The Fund invests in three major regions: North America, Europe and, to a lesser extent, Latin America and will generally have at least 65% of its assets in U.S. or foreign government securities. RCS started in 1994.
PIMCO describes the RCS CEF’s investment goals and tactics as:
With the flexibility to build a global portfolio of income producing securities of U.S. and foreign issuers, including emerging market issuers, the fund seeks to generate, over time, a level of income higher than that generated by high-quality, intermediate-term U.S. debt securities.
Leveraging PIMCO’s core analytical and risk management capabilities, the fund’s managers can select what they believe to be the most attractive issues across the full range of fixed income sectors including corporate debt, government and sovereign debt, mortgage-related and other asset-backed securities and other income-producing securities of varying maturities.
The fund utilizes PIMCO’s global credit analysts who conduct individual security analysis as well as PIMCO’s extensive library of proprietary analytical software to help quantify risks and relative value in different securities.
Source: pimco.com RCS
RCS has $234m in asset under management (“AUM”), with PIMCO charging 136bps in fees, a respectable level for a fund using leverage. Currently, it takes 40bps to cover the 49% leverage ratio, funded mostly by Reverse Repurchase Agreements. The Forward yield is 11.4%.
PIMCO provides why they believe their CEF makes for a good fixed income investment.
With the flexibility to build a global portfolio of income producing securities of U.S. and foreign issuers, including emerging market issuers, the fund seeks to generate, over time, a level of income higher than that generated by high-quality, intermediate-term U.S. debt securities.
Leveraging PIMCO’s core analytical and risk management capabilities, the fund’s managers can select what they believe to be the most attractive issues across the full range of fixed income sectors including corporate debt, government and sovereign debt, mortgage-related and other asset-backed securities and other income-producing securities of varying maturities.
The fund utilizes PIMCO’s global credit analysts who conduct individual security analysis as well as PIMCO’s extensive library of proprietary analytical software to help quantify risks and relative value in different securities.
Source: pimco.com RCS
Holdings review
PIMCO hasn’t posted May data yet, so some data is from the end of April, with holdings from March unless noted otherwise. The next table shows how some characteristics have moved since the end of March.
| March 31st | April 30th | |
| Effective Duration (yrs) | 4.12 | 4.47 |
| Weighted Maturity (yrs) | 9.06 | 8.77 |
| Leverage | 50.31 | 46.32(6/6/22) |
| Premium | 7.89% | 3.86% (6/7/22) |
| Average Bond Price | $98.14 | N/A |
| Total Fees | 136bps | 136bps |
As of March 31st, the top industry exposures were:
PIMCO.com RCS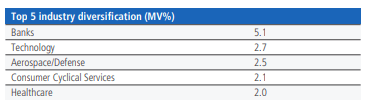
As of April 30th, the portfolio statistics were:
PIMCO.com RCS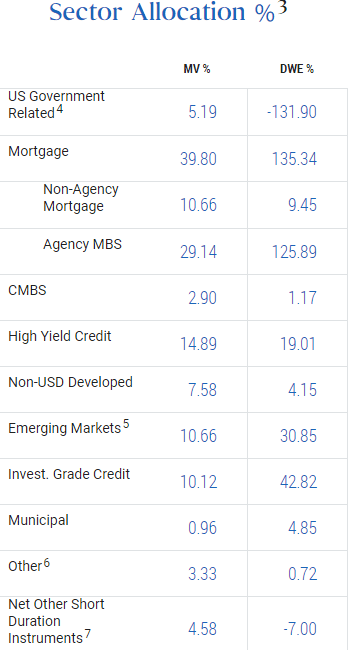
DWE stands for Duration Weighted Exposure, for which I found this definition:
The duration weighted exposure of each sector is a way of “rolling up” (combining) a two dimensional sample into a single number, effectively:average duration (for a sector) / average duration of fund x percentage in the sector.
Source: mutualfundobserver.com
According to PIMCO, RCS achieves the large negative value for the U,S. Government-related issues by investing in nominal and inflation-protected Treasuries, Treasury futures and options, agencies, FDIC-guaranteed and government-guaranteed corporate securities, and interest rate swaps.
As the next table shows, country weights also vary widely between MV and DWE.
PIMCO.com RCS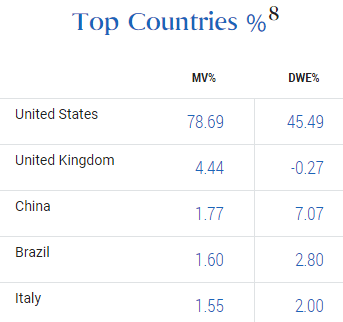
Unlike the above two, maturity only has Market Value listings.
PIMCO.com RCS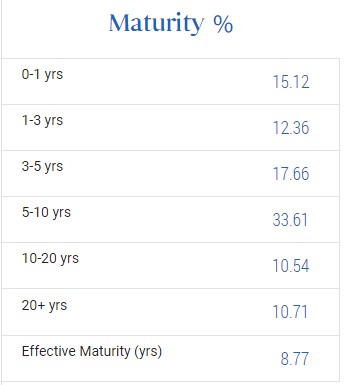
RCS’s effective duration and maturity are comparable to many of the other PIMCO Fixed Income CEFs.
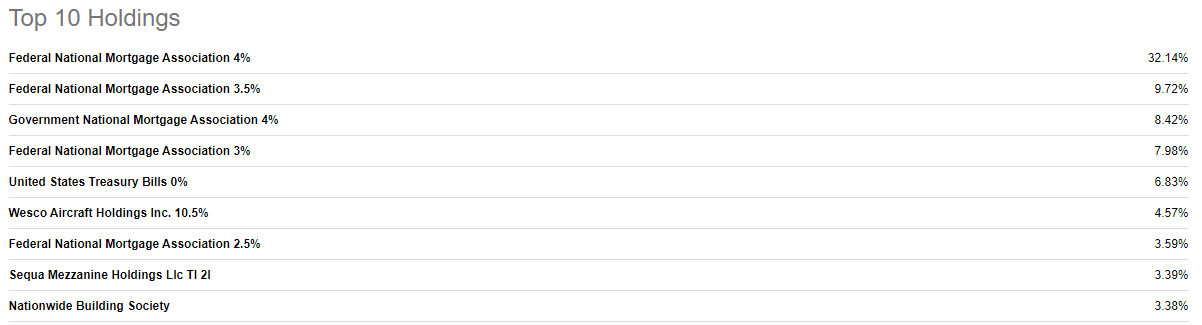
Top holdings (3/31/22 data)
The only complete holdings list I found was from the end of March.
PIMCO.com; compiled by Author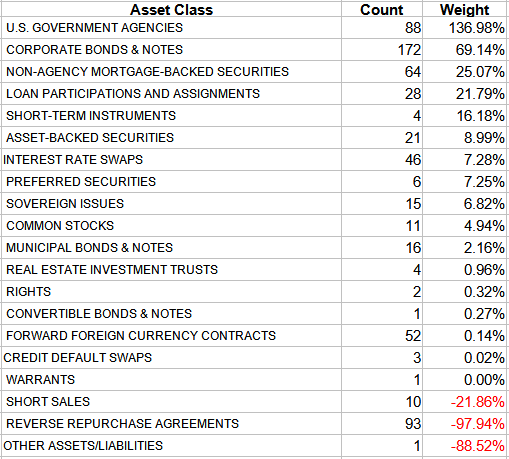
RCS uses currency forwards to hedge some of their non-USD exposure. Having large U.S. Government holdings shows in the ratings weighting of the CEF.
CEFConnect.com seekingalpha.com RCS Holdings 3/31/22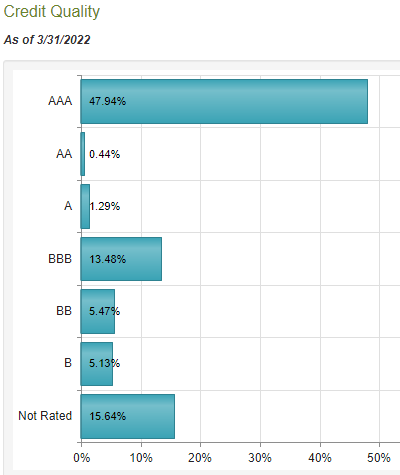
Distribution review
seekingalpha.com DVDs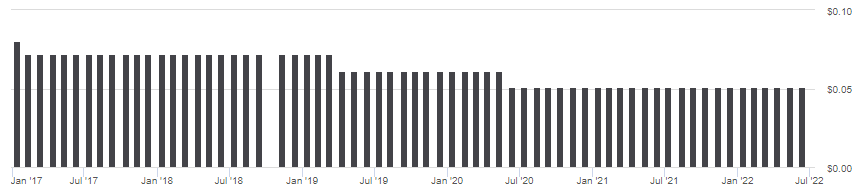
RCS has cut its payout three times since 2017, the last time from $.0612 to $.051 in June’20. Based on the analysis done by another Seeking Alpha contributor, ADS Analytics, they give RCS a high risk rating for future cuts compared to other PIMCO CEFs ( PIMCO CEFs Are Forced To Deleverage As Market Catches Up With Them).
Data on whether ROC was required for distributions is covered by IRS form 8937 for part of 2021. This explanation is provided on that form:
PIMCO Strategic Income Fund, Inc. does not have sufficient Earnings Profits to support taxable dividend character under Internal Revenue Code Section IRC Section 316. Accordingly, distributions in excess of Earnings & Profits are characterized as non-taxable returns of capital that reduce the cost basis of shares under IRC Section 301fc 2 .
Source: pimco.com RCS Form 8937
It lists some of the 2021 payments as:
PIMCO.com Tax Center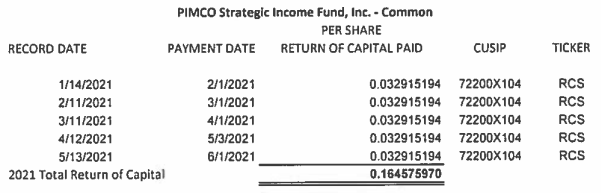
I did not find 2022 data, but the 2019 8937 form showed similar results. The latest UNII report shows the following:
PIMOC.com UNII report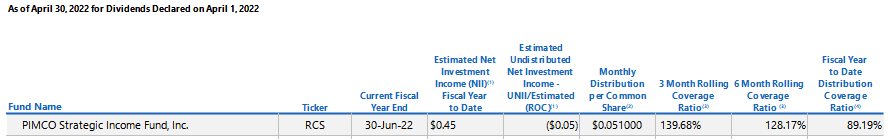
Based on this report, RCS has the second lowest Fiscal Year distribution coverage ratio, giving credence to the risk level assigned as to a possible payout cut. Documents I checked showed no indication that a managed distribution plan is used by this, or many PIMCO CEFs.
Price and NAV review
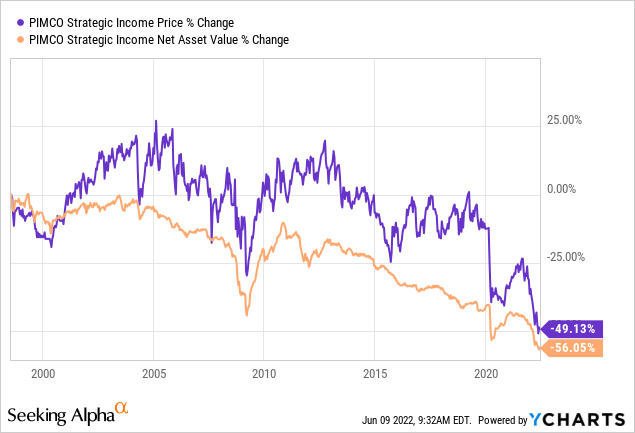
Both Price and NAV are down nearly 50% since RCS started in 1994. Investors who reinvested had a CAGR of 7.6% since inception; others only 4.4%. The next chart shows the relationship over time between RCS’s price and NAV.
CEFConnect.com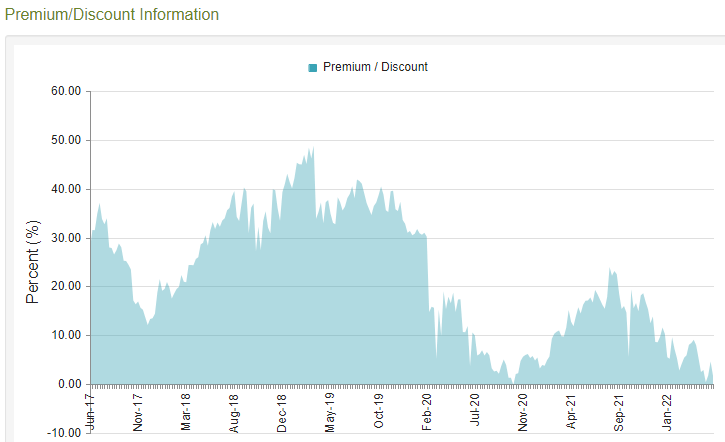
Except for a few short periods, RCS’s price hasn’t been below its NAV in almost 20 years, so the current premium of only 2.7% looks attractive. It was over 20% as recently as late 2021.
Portfolio strategy
One suggested recommendation I listed at the start was for RCS investors to consider selling and investing in another PIMCO CEF with a better track record unless the small premium means a better future for RCS from here. Here is a list of CEFs that PIMCO offers that I deemed to be alternatives.
PIMCO.com; complied by Author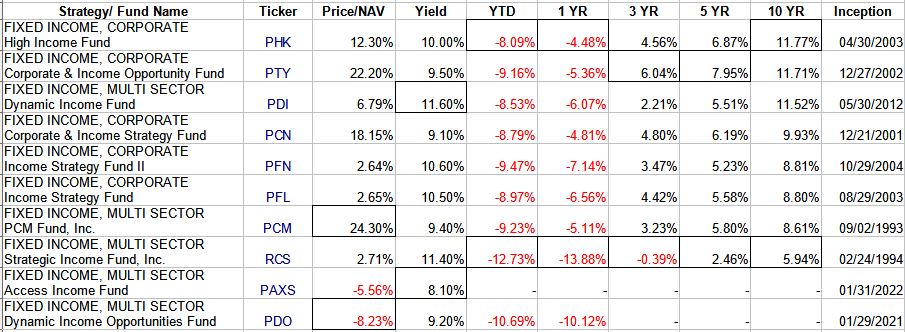
I boxed the best and worst value for each column. RCS has the worst value for returns across the board. Without having checked the Price/NAV movements for every CEF over the past two years, RCS premium has had a large decline, negatively effecting its price return. If investors believe that might reverse, RCS could be a good bet.
For investors who see PIMCO as the premier manager in this space, the two newer CEFs – PIMCO Access Income Fund (PAXS) and PIMCO Dynamic Income Opportunities Fund (PDO) – both sell at a discount. If they join the others at a premium, investor might want to ignore their short history and switch from RCS to either of those.
Final note
Here are some links to recent PIMCO CEF coverage on Seeking Alpha:
PHK And PTY: Top PIMCO Fixed Income CEFs Over Past Decade
PDI: 11.8% Yield, Diversified, Marginal Net Asset Premium
Be the first to comment