

Tony Anderson
Although the investment community seems to be incredibly worried about the construction space, the long-term outlook for that industry is certainly positive. Yes, we may experience a few quarters or even longer of pain. But investors who are value-oriented should take this opportunity to acquire stock in quality operators that are trading on the cheap. One such prospect that comes to mind is Quanex Building Products (NYSE:NX). Although fairly small with a market capitalization of $655.4 million, the company has a fairly large footprint and almost no debt. It has had a somewhat bumpy ride from a fundamental perspective in recent years. But when you consider how cheap shares are and you look at the general trajectory that fundamentals have taken, the overall picture for shareholders should be positive down the road. Because of this, I have decided to rate the business a solid ‘buy’ at this time, reflecting my belief that it will likely outperform the broader market moving forward.
A niche provider of building products
According to the management team at Quanex Building Products, the company produces and sells components for OEMs (original equipment manufacturers) in the building products industry. This description is rather vague because it’s meant to fit a vast portfolio of offerings the company provides. For instance, it produces and sells window and door components, kitchen and bath cabinet components, and more. To be more specific, under the window and door category, the company produces energy-efficient flexible insulating glass spacers, extruded vinyl profiles, window and door screens, and precision-formed metal and wood products. Other offerings include solar panel sealants, trim moldings, vinyl decking and fencing, water retention barriers, and Conservatory roof components.
Although Quanex Building Products is fairly small, it does have a large global footprint. During its 2021 fiscal year, the firm generated 22.8% average revenue from customers in Europe. A further 2.3% of sales came from customers in Canada, while customers in Asia accounted for 1.7% of revenue. All other foreign countries combined were responsible for only 0.6% of sales, while the US market made up the lion’s share at 72.6%. Given the company’s exposure to North America, and particularly the US, it should come as no surprise that its business should follow the general trend of the US housing market. Investors are concerned about this space because of rising interest rates and overall inflation. But at the end of the day, what matters most is that the firm has what it needs to weather any sort of storm that’s brewing. And with net debt as of this writing of just $6.5 million, overall leverage is quite low. That on its own significantly reduces risk for shareholders.
Author – SEC EDGAR Data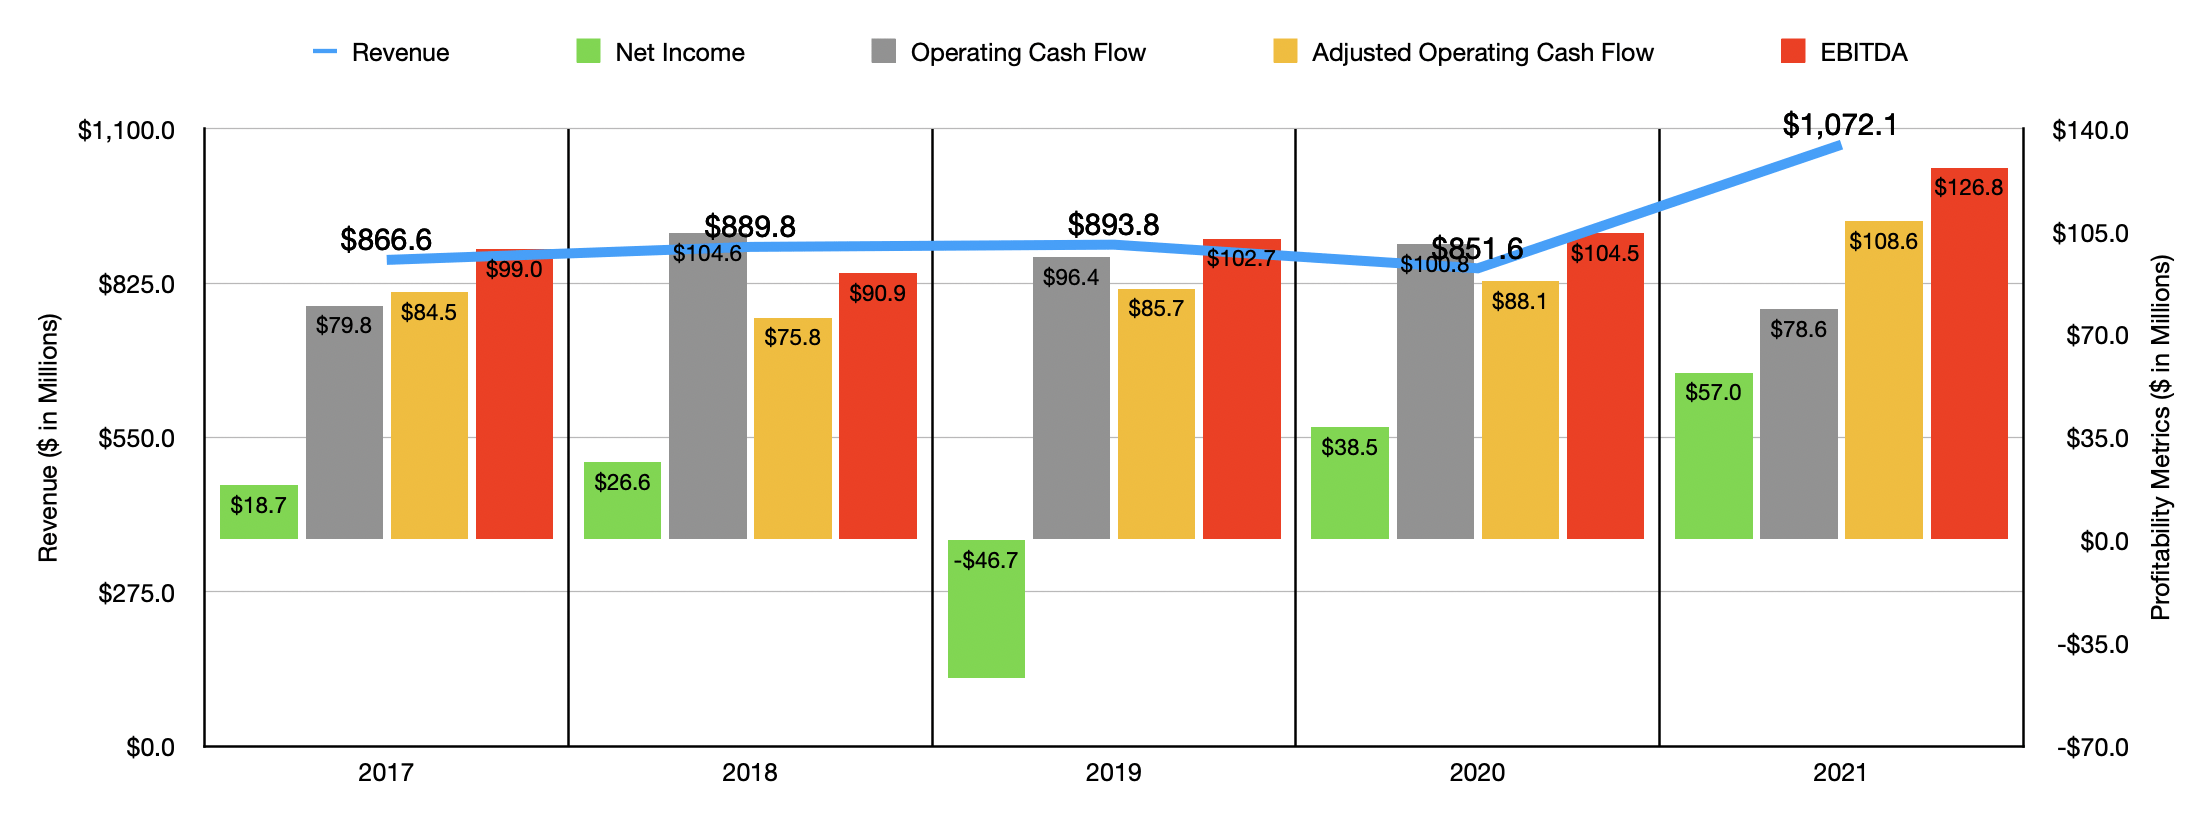
Fundamentally speaking, Quanex Building Products has been on an interesting ride in recent years. Between 2017 and 2019, sales rose year after year, climbing from $866.6 million to $893.8 million. In 2020, sales dropped modestly to $851.6 million before shooting up to $1.07 billion in 2021. For the company’s North American fenestration (door and window) products, sales in 2021 came in 20% higher than they were one year earlier because of a $74.7 million increase resulting from higher product volumes. Higher pricing and raw material surcharges added $20.2 million to the company’s top line. In Europe, the picture was even better, with revenue shooting up by 56%, with much of the improvement coming from the reopening of manufacturing facilities in the UK that were shut because of the COVID-19 pandemic. Higher pricing and raw material surcharges added $19.8 million to the North American cabinet components portion of the business, while higher volumes added a further $16.2 million under this category.
While the revenue trajectory for the company has been generally positive, the profitability side of the enterprise has been a little less certain. Ignoring the 2019 fiscal year when the business generated a loss of $46.7 million, we would have seen net income rise year after year, climbing from $18.7 million in 2017 to $57 million in 2021. Operating cash flow has been a bit lumpy. But if we adjust for changes in working capital, it would have risen from $84.5 million in 2017 to $108.6 million in 2021. A similar trend can be seen when looking at EBITDA, with the metric climbing from $99 million to $126.8 million over the same five-year window.
Author – SEC EDGAR Data
When it comes to the 2022 fiscal year, the picture for Quanex Building Products has been quite positive. In the first three quarters of the fiscal year, revenue totaled $914 million. That represents an increase of 17.1% over the $780.4 million generated in the same timeframe of the 2021 fiscal year. Net income for the company jumped from $36 million to $63.7 million. We also saw operating cash flow grow modestly from $47.4 million to $49.9 million. But if we adjust for changes in working capital, the metric would have risen from $81 million to $99.1 million. And finally, we have EBITDA, which grew from $89.5 million to $113.8 million.
For the 2022 fiscal year as a whole, management expects revenue of between $1.18 billion and $1.20 billion. At the midpoint, that would translate to a year-over-year increase of 11%. On the bottom line, the company anticipates EBITDA of between $150 million and $155 million. No guidance was given when it came to other profitability metrics. But if we assume that adjusted operating cash flow matches the year-over-year growth rate expected of EBITDA and if we annualize the data for net income, we get metrics of $130.6 million and $100.9 million, respectively.
Author – SEC EDGAR Data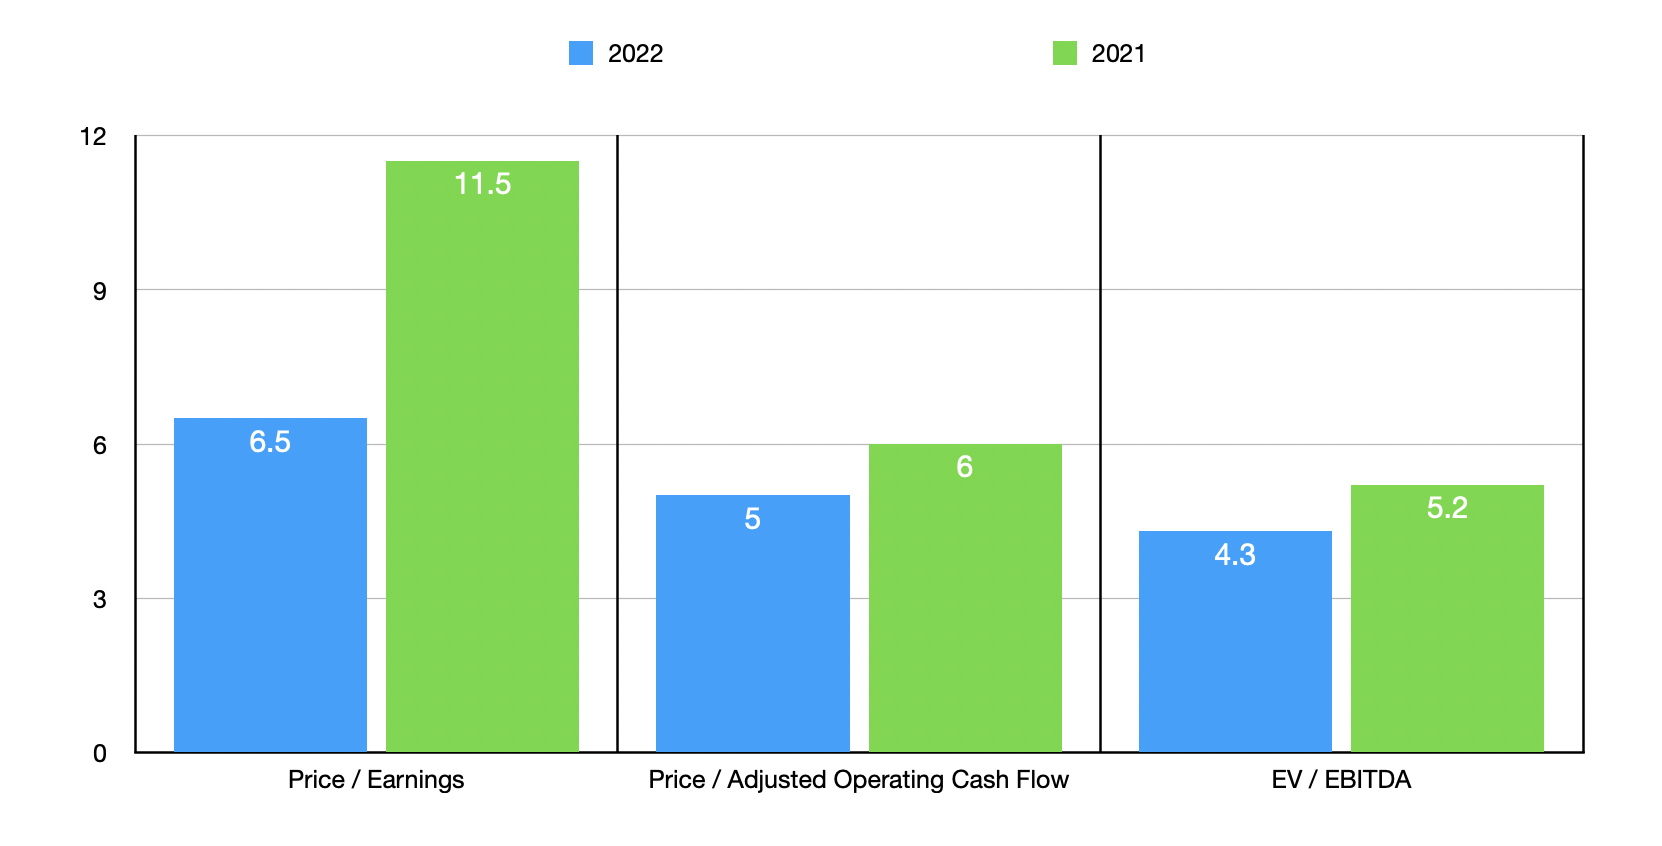
Using these figures, we get a forward price to earnings multiple of 6.5, a price to adjusted operating cash flow multiple of 5, and an EV to EBITDA multiple of 4.3. These stack up against the 11.5, 6 and 5.2, that we get using data from 2021. As part of my analysis, I also compared the company to five similar firms. On a price-to-earnings basis, these companies ranged from a low of 4.1 to a high of 38.6. Two of the five were cheaper than Quanex Building Products. On a price to operating cash flow basis, the range was from 8.3 to 26.6, with our prospect being the cheapest of the group. And using the EV to EBITDA approach, we get a range of between 2.6 and 14.1, with our prospect being cheaper than all but one of the firms.
| Company | Price/Earnings | Price/Operating Cash Flow | EV/EBITDA |
| Quanex Building Products | 6.5 | 5.0 | 4.3 |
| Insteel Industries (IIIN) | 4.1 | 26.6 | 2.6 |
| JELD-WEN Holding, Inc. (JELD) | 6.8 | 25.7 | 6.8 |
| American Woodmark Corp. (AMWD) | 38.6 | 13.7 | 14.1 |
| PGT Innovations (PGTI) | 17.9 | 8.3 | 9.3 |
| Apogee Enterprises (APOG) | 16.0 | 21.7 | 9.7 |
Takeaway
Fundamentally speaking, Quanex Building Products may not have experienced the most stable ride over the past few years. But all things considered, the company is a solid prospect with a low amount of true risk facing investors. I wouldn’t be surprised to see additional downside in the near term if current market conditions worsened. But for those focused on the long haul, shares of the company do look attractively priced right now. Because of this, I have decided to rate the company a ‘buy’.
Be the first to comment