


CHUNYIP WONG
When markets are jittery, value and yield-centered investing might offer a safe haven. Cheap valuations mean slimmer or non-existent growth premia and high dividends solace when share prices are declining.
Yet this investment philosophy has meaningful downsides, which can be illustrated by the example of the Invesco KBW Premium Yield Equity REIT ETF (NASDAQ:KBWY). KBWY is a passively managed fund providing exposure to a fairly concentrated portfolio of high-yield small- and mid-size U.S. real estate investment trusts, a traditionally dividends-rich corner of the market.
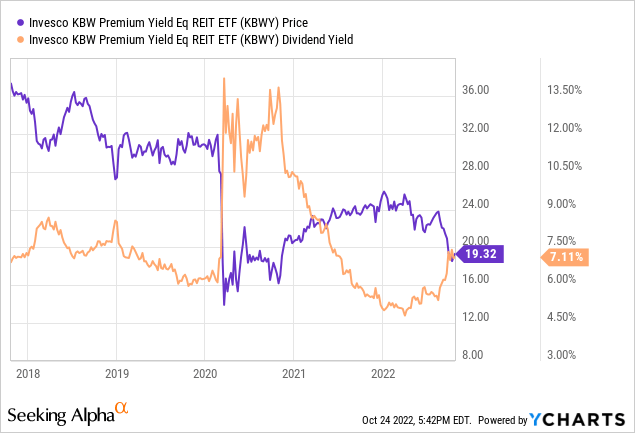
The fact is, I am highly skeptical about this ETF, even despite its generous dividend yield of ~7.1% and fairly depressed price after a ~25.5% decline this year that provokes buy-the-dip thoughts.
The essential reason is that its dismal past performance brilliantly illustrates the vulnerabilities of yield-centered value strategies. Another problem that argues against investing in this small-cap REITs play is worrisome dividend growth trends revealing the quality issues of the strategy. Considering these factors, I believe there is little to no reason to buy into it either for capital appreciation or dividends.
A closer look at the investment strategy
The KBW Nasdaq Premium Yield Equity REIT Index is the cornerstone of KBWY’s investment strategy. This is a quarterly rebalanced and reconstituted index with constituents drawn from the universe of dividend-paying mid- and small-cap equity REITs. More details could be found in the methodology document.
The index’s focus on the small size and higher yields, together with the modified dividend yield-based weighting schema tilts the fund towards the value factor, while also exposing it to significant risks, namely regarding quality (e.g., weak margins and balance sheet issues). I will touch upon that shortly.
Considering the selection pool is fairly small, it barely comes as a surprise that the fund has just 27 holdings (as of October 21), with the main five accounting for almost 28% of the net assets. This adds to risks as the portfolio would suffer should the prices of major holdings creep lower, and I am of the opinion that this more likely was one of the drivers of lackluster returns in recent years.
As the factsheet from September 30 illustrates, the fund was overweight healthcare REITs, with over 21% allocated, followed by office REITs accounting for 20.2%. Regarding the size factor, the median market capitalization of the holdings is ~$1.7 billion, with a weighted average of just around $3 billion, as of my estimates. Approximately 55.6% of the net assets are deployed to companies with less than $2 billion in market value or those that are typically considered small-caps. And uncoincidentally, KBWY has quality issues upon deeper inspection as a smaller size invites lower, more attractive multiples, yet frequently comes with overleveraged balance sheets, patchy growth, and fragile margins. For example, just 44.4% have at least B- Quant Profitability grade or better, while more than 24% have meaningful issues manifested in a D+ grade and worse. As a brief digression, I would prefer a portfolio that would have no less than an 80% of highly profitable holdings in case I was considering it as a long-term source of steady income and/or dividend growth.
The table below combines the data for the top 20 holdings.
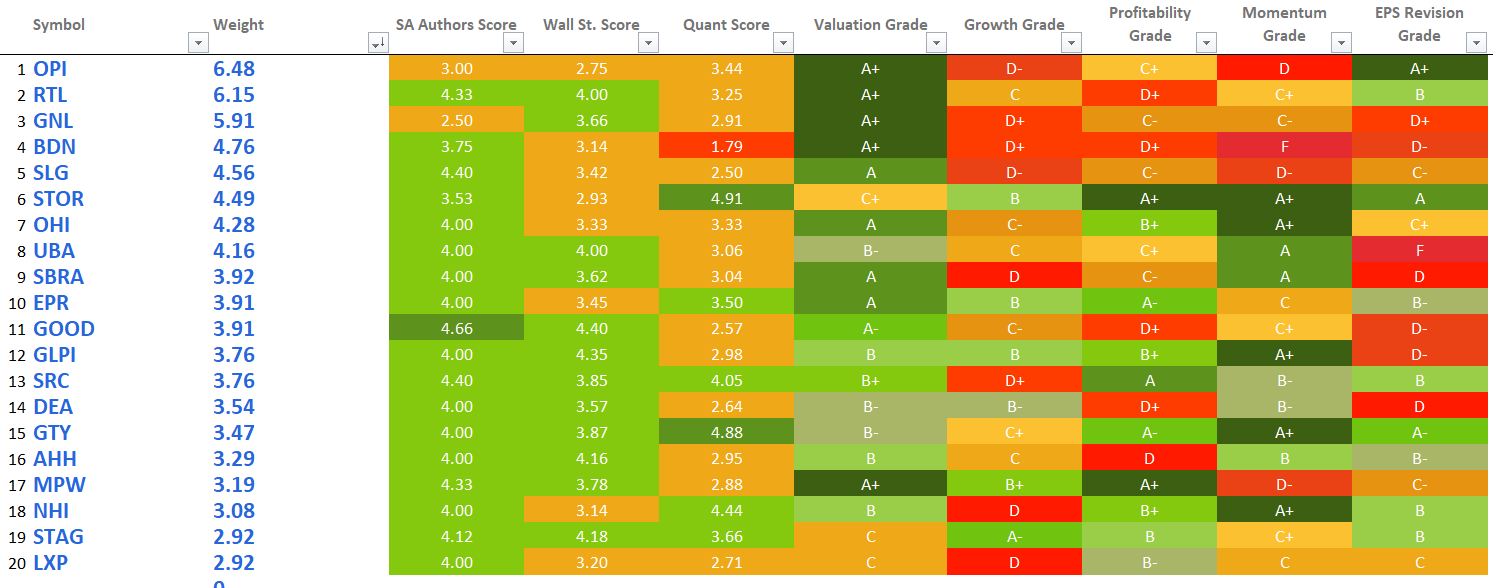
Created by the author using data from Seeking Alpha and the fund
As can be seen, most are deeply underpriced. For example, Office Properties Income Trust (OPI), KBWY’s most significant investment at the moment, sports an A+ grade, indicating that OPI is one of the cheapest in the real estate sector. Those that have at least a B- grade account for 78% of KBWY, a phenomenal result implying the fund did excel in selecting the most attractively valued names. However, it still comes with meaningful quality issues, and past performance, as discussed below, is barely alluring.
Chronic underperformance in recent years as the pandemic and higher interest rates took their toll
Did KBWY’s focus on (almost) the cheapest dividend-paying real estate players bear fruit in the past? As the table below based on the returns since inception illustrates (excluding December 2010 and October 2022), it did not.
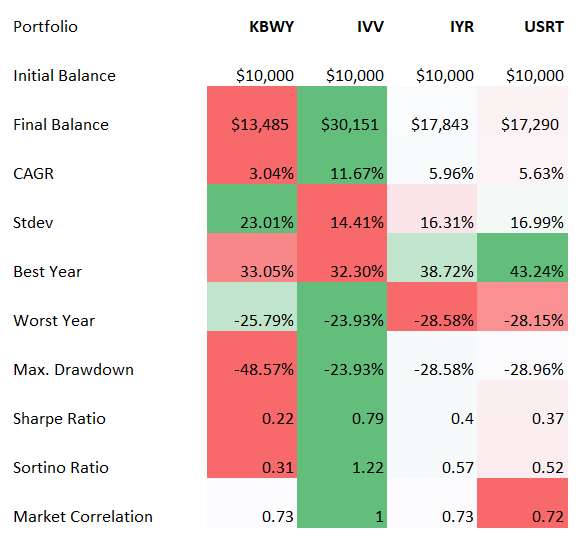
Created by the author using data from Portfolio Visualizer
Compared to the iShares Core S&P 500 ETF (IVV), which represents the market, iShares Core U.S. REIT ETF (USRT), and iShares U.S. Real Estate ETF (IYR), KBWY’s results look totally lackluster, as the ETF delivered a measly CAGR of just ~3%, yet demonstrated elevated volatility manifested in a standard deviation of over 23%. Please take notice that the analysis above is based on total returns, so it does incorporate dividends.
For better context, we should take a closer look at monthly and annual returns and at least make an attempt to figure out the reasons for such dismal results.
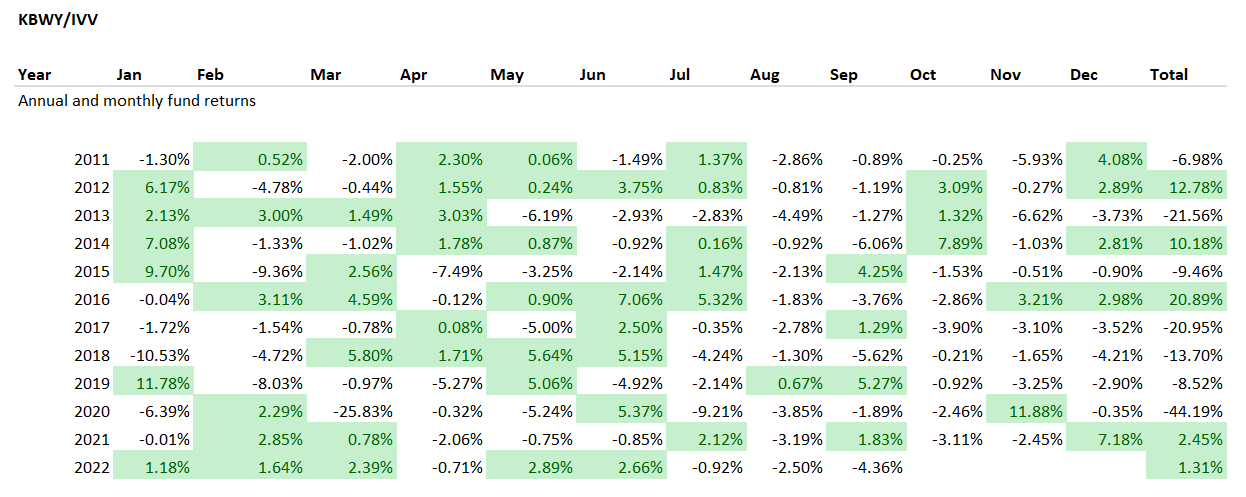
Created by the author using data from Portfolio Visualizer
Upon deeper inspection, we see that this value-centered ETF did have a few robust years in the past, like in 2016, while it also benefited from rotation back to cheaper names and those who bore the brunt of the pandemic and lockdowns (office REITs being an example worth mentioning) in 2021, and the value factor has also slightly contributed to its outperformance vs. IVV in the first nine months of 2022 (~1.3%). However, it is also clear that other years were rather sluggish, to say the least, with the pandemic-torn 2020 marred by a catastrophic 25.8% decline, while its much better diversified peer USRT fell by just 8.1% and IVV clocked an 18.4% return.
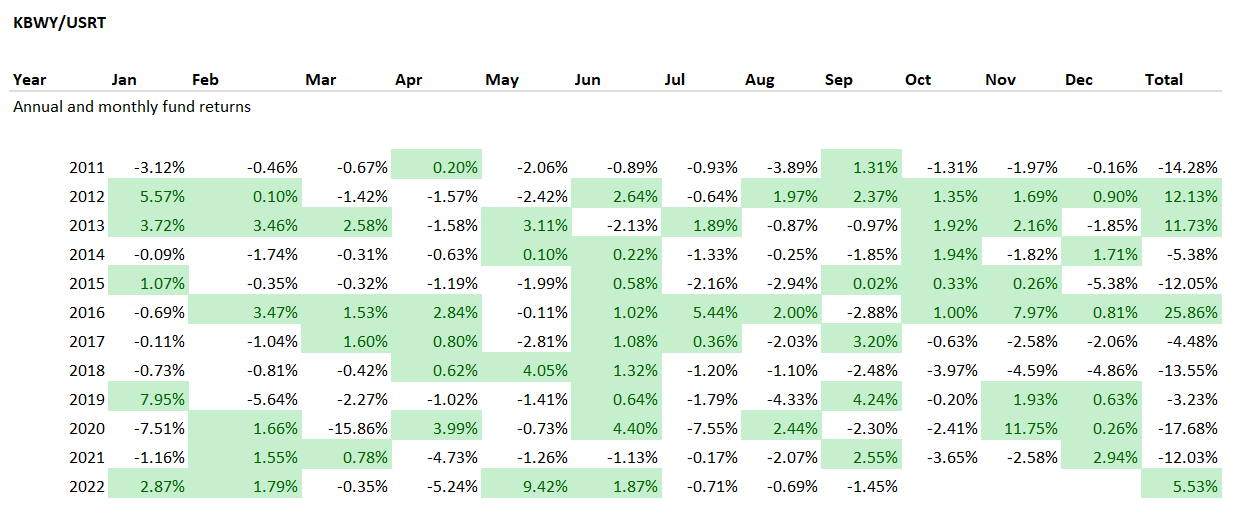
Created by the author using data from Portfolio Visualizer
Conclusion
There is no denying that KBWY excelled in selecting the cheapest players in the real estate sector, yet this does not cancel the fact value investing could fail in many cases. And the ETF’s performance is a cautionary tale for high-yield investors.
Despite sporting the market-leading yield, the fund delivered merely catastrophic performance in recent years, which effectively nullified the benefits of its rich dividends as illustrated by the total return, and, most importantly, not only the pandemic was the reason for underperformance.
The fund was battered twice; first, it was the coronavirus recession, second, inflation and the central banks’ efforts to tame it. This might look like a buying opportunity as the monetary policy should at some point in the future finally turn dovish when inflation will finally become comfortable and fully controllable, yet I would not say it is worth taking the risk.
Sluggish dividend growth (or better to say, an outright contraction, with the pandemic-induced dividend reset being the essential culprit) is yet another strong negative. Also, if we look at dividend reliability, there is a lot to criticize, as only ~27% of KBWY’s holdings have at least B- Safety grade, while almost 41% have serious issues, like The Necessity Retail REIT (RTL) with its D- rating and UMH Properties (UMH) with an F grade.
Next, KBWY’s elevated risk manifested in a too-high standard deviation and significant tracking errors partly explains the lackluster asset flows trends.
In sum, KBWY investors have exposure to a brilliant value mix, yet this is one of those disappointing examples when the value style simply does not work. In sum, I have little to no reason to consider KBWY as an investment opportunity even at the currently rather depressed price and with a seemingly attractive 7.1% yield.
Be the first to comment