


lleerogers/iStock Unreleased via Getty Images
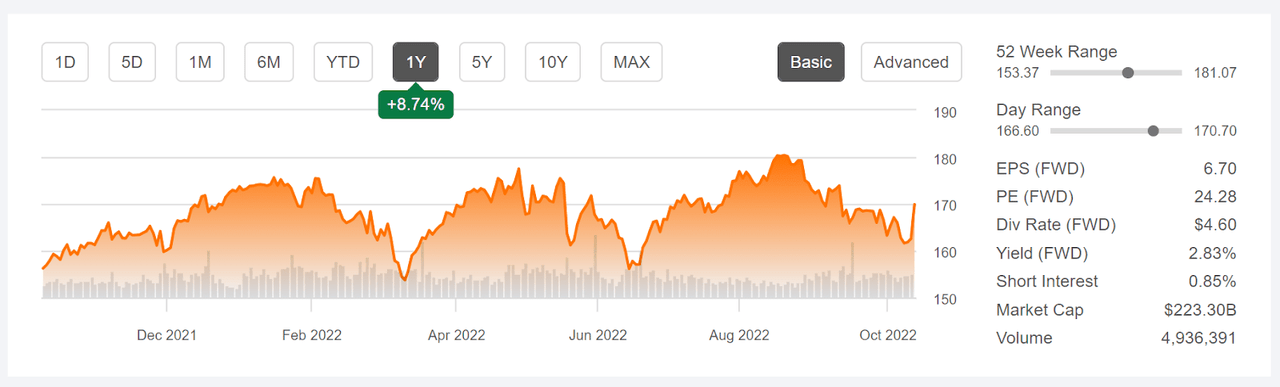
PepsiCo (NASDAQ:PEP) reported Q3 results before the market opened today, beating expectations on earnings and revenues. Management also raised the FY 2022 earnings outlook, with +12% in expected organic revenue growth vs. +10% in previous guidance. The shares are up 4.5% for the day, for a 12-month gain of 8.74% vs. -17.3% in price return for the S&P 500 (SPY).
Seeking Alpha
12-Month price history and basic statistics for PEP.
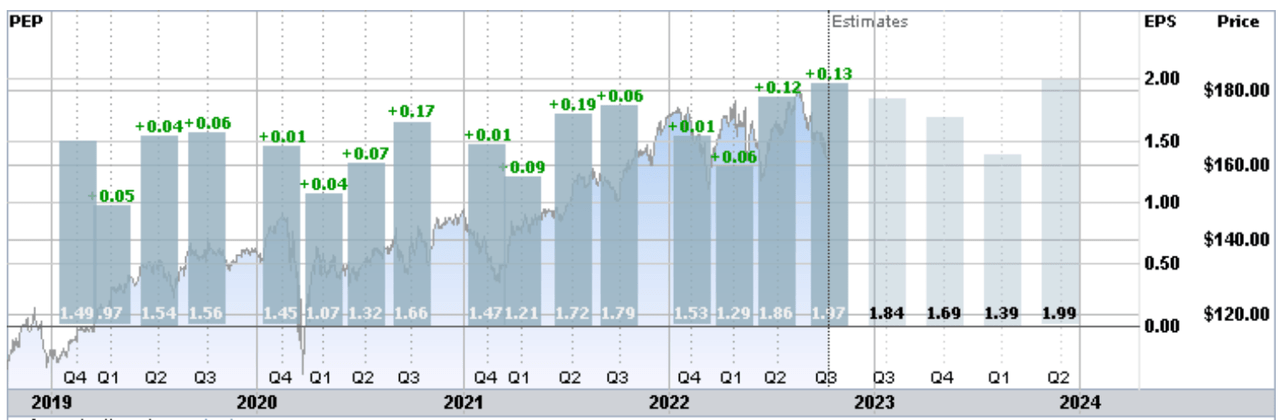
PEP has demonstrated consistent earnings growth over the past several years, with very little impact from the pandemic. Earnings have continued to grow even as inflation has risen, demonstrating PEP’s pricing power. The consensus outlook is for 7.3% annualized EPS growth over the next three to five years. This is not an especially high growth rate, but the stability in growth over recent years is impressive.
Etrade
Historical (4 year) and estimated future quarterly EPS for PEP. Green values are amounts by which EPS beat the consensus expected value.
Along with the impressive earnings growth, PEP also benefits from being in a defensive sector, consumer staples. The Consumer Staples Select Sector SPDR ETF (XLP) has returned a total of -1.47% over the past 12 months as compared to -16.5% for the S&P 500. PEP is the 2nd-largest holding in XLP. Over the 3 years through September, PEP and XLP have betas of 0.58 and 0.57 vs. the S&P 500.
In terms of current valuation, PEP is acceptable. The forward P/E, 24.3, is in the normal range of the P/E ratios over the past five to six years. PEP’s forward PEG ratio is between those of Coke (KO) and Keurig Dr Pepper (KDP).
I last wrote about PEP on April 13, 2022, six months ago, and I maintained a buy rating on the shares. The Wall Street consensus rating was a buy, but the consensus 12-month price target was only about 5.5% above the share price at that time. The question was whether there was enough potential upside for a long position to be worth the risk, not least because of the fairly high valuation at that time. When analyzing a stock, I put considerable weight on the market-implied outlook, a probabilistic price forecast that represents the consensus view among buyers and sellers of options. The market-implied outlook for PEP was bullish to the middle of 2023 and slightly bullish to January of 2023. The expected volatility calculated from the market-implied outlook was a modest 21%. Considering PEP’s low beta, which confers attractive risk reduction benefits, along with the bullish Wall Street consensus outlook and bullish market-implied outlooks, maintaining a buy rating on PEP was the obvious choice. Since the market close on April 13th, PEP has returned a total of -1%, as compared to -12.8% for the Consumer Staples SPDR ETF and -18.6% for the S&P 500.
For readers who are unfamiliar with the market-implied outlook, a brief explanation is needed. The price of an option on a stock is largely determined by the market’s consensus estimate of the probability that the stock price will rise above (call option) or fall below (put option) a specific level (the option strike price) between now and when the option expires. By analyzing the prices of call and put options at a range of strike prices, all with the same expiration date, it is possible to calculate a probabilistic price forecast that reconciles the options prices. This is the market-implied outlook. For a deeper explanation and background, I recommend this monograph published by the CFA Institute.
I have calculated updated market-implied outlooks for PEP and I have compared these with the current Wall Street consensus outlook in revisiting my overall rating.
Wall Street Consensus Outlook for PEP
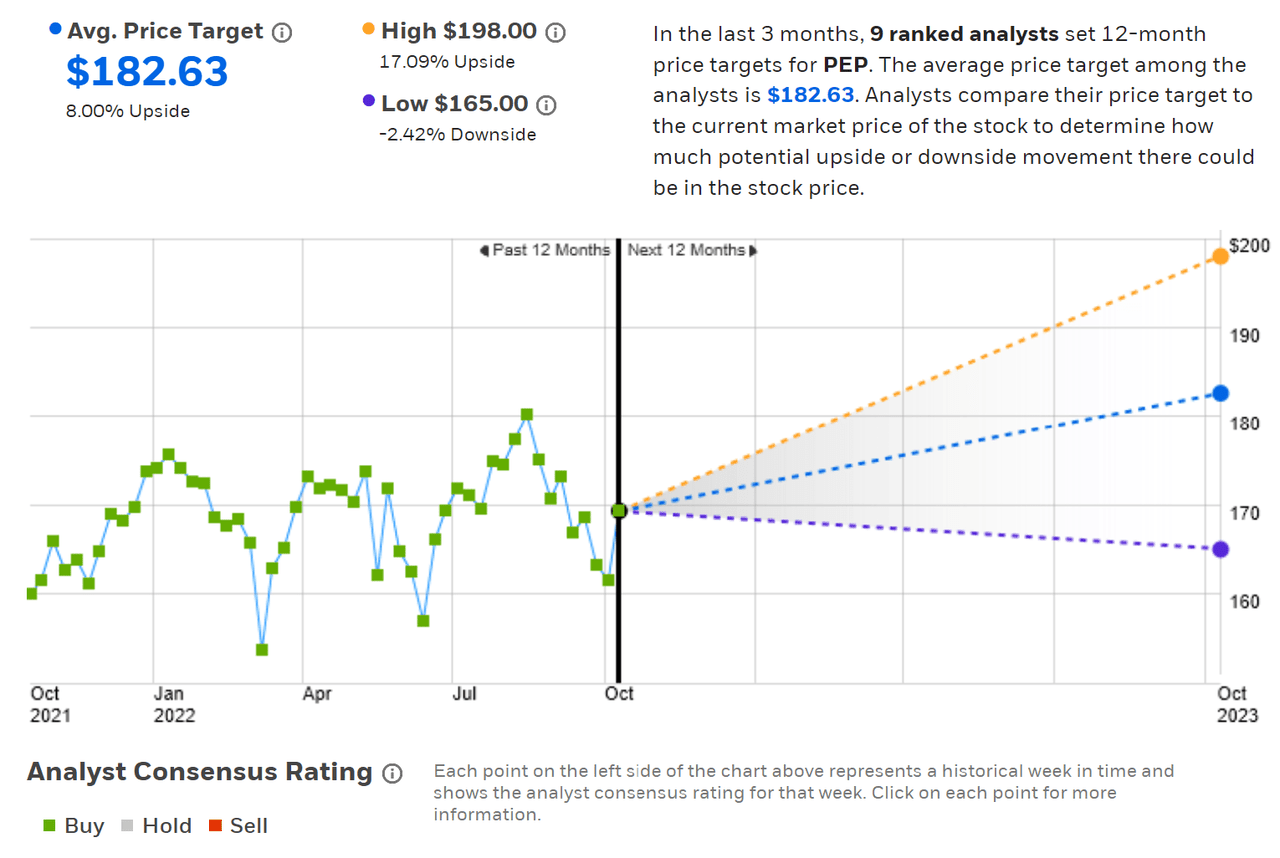
ETrade calculates the Wall Street consensus outlook for PEP using ratings and price targets from nine ranked analysts who have published opinions in the past three months. The consensus rating is a buy, as it has been for all of the past year. The consensus 12-month price target is 8% above the current share price. The consensus price target, $186.63, is slightly higher than it was six months ago, at about $179. There’s a fairly low dispersion among the individual price targets, adding confidence in the predictive usefulness of the consensus.
ETrade
Wall Street consensus rating and 12-month price target for PEP.
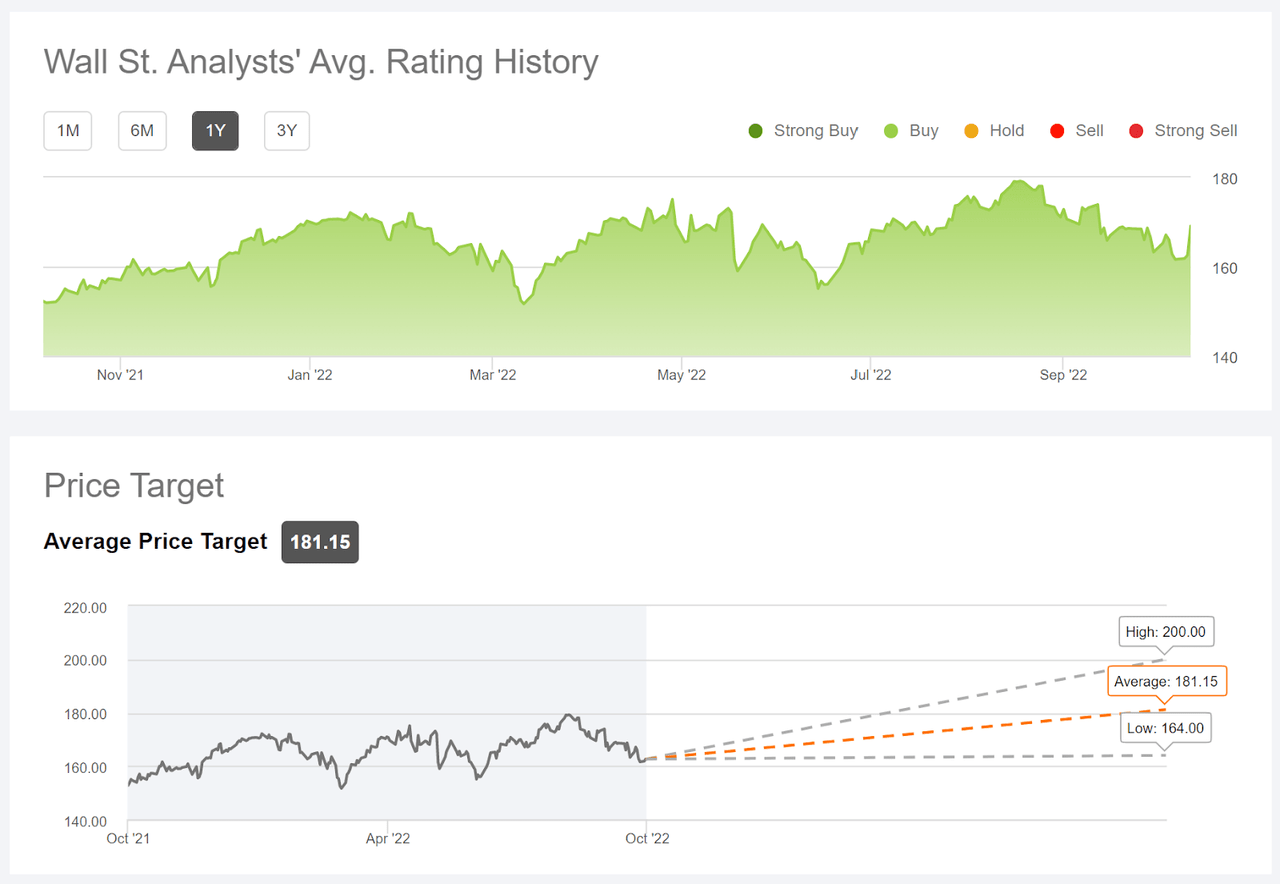
Seeking Alpha’s version of the Wall Street consensus outlook uses price targets and ratings from 22 analysts who have published their views within the past 90 days. The consensus rating is a buy and the consensus 12-month price target is very similar to the value calculated by ETrade, implying a 7.1% price return over the next year.
Seeking Alpha
Wall Street consensus rating and 12-month price target for PEP.
The Wall Street consensus rating continues to be bullish and the consensus 12-month price target implies a total return of 10.4% over the next year (averaging ETrade’s and Seeking Alpha’s consensus price targets and adding the dividend).
Market-Implied Outlook for PEP
I have calculated the market-implied outlooks for the 3.3-month period between now and Jan. 20, 2023, and the 8.1-month period from now until June 16, 2023, using the prices of call and put options that expire on these dates. I selected these specific expiration dates to provide a view through the end of 2022 and to the middle of 2023. In addition, the options that expire in January and June tend to be among the most liquid, adding confidence in the representativeness of the outlooks.
The standard presentation of the market-implied outlook is a probability distribution of price return, with probability on the vertical axis and return on the horizontal.
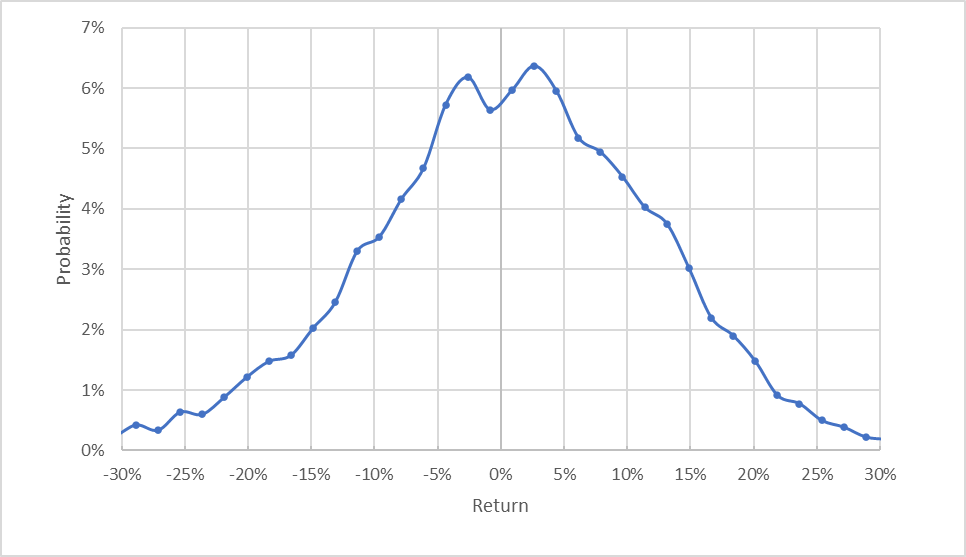
Geoff Considine
Market-implied price return probabilities for PEP for the 3.3-month period from now until January 20, 2023.
The market-implied outlook to mid-January is generally symmetric, although there’s a clear tilt in probabilities favoring larger-magnitude positive returns relative to negative returns of the same magnitude. Compare, for example, the probabilities of having returns of +10% or +15% to those for returns of -10% or -15%. The expected volatility calculated from this distribution is 25.8% (annualized), somewhat higher than the expected volatility calculated back in April, 21%. Given the rise in overall market volatility over this period, however, the increase in PEP’s volatility is quite minor.
To make it easier to compare the relative probabilities of positive and negative returns, I rotate the negative return side of the distribution about the vertical axis (see chart below).
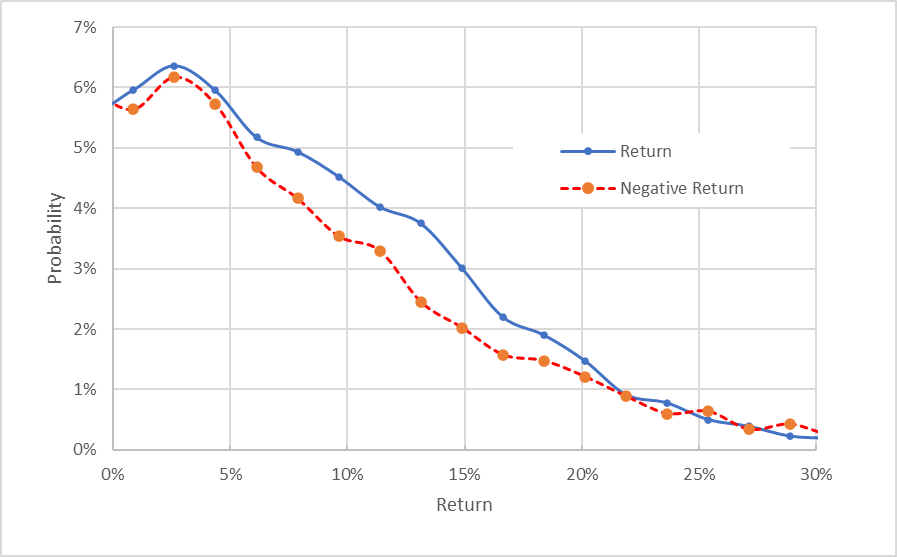
Geoff Considine
Market-implied price return probabilities for PEP for the 3.3-month period from now until January 20, 2023. The negative return side of the distribution has been rotated about the vertical axis.
This view shows how consistently the probabilities of positive returns exceed those of negative returns of the same size (the solid blue line is above the dashed red line over the left ⅔ of the chart above). This is a bullish outlook for PEP.
Theory indicates that the market-implied outlook is expected to have a negative bias because investors, in aggregate, are risk averse and thus tend to pay more than fair value for downside protection. There’s no way to measure the magnitude of this bias, or whether it is even present, however. The expectation of a negative bias in the outlook reinforces the bullish interpretation.
The market-implied outlook for PEP for the next 8.1 months also is bullish and is qualitatively similar to the shorter-term view. The expected volatility calculated from this distribution is 25.5% (annualized).
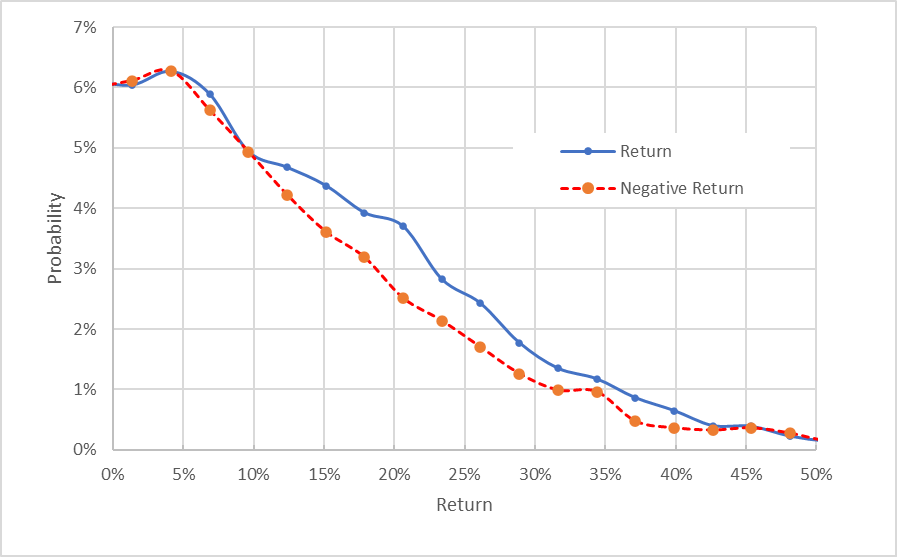
Geoff Considine
Market-implied price return probabilities for PEP for the 8.1-month period from now until June 16, 2023. The negative return side of the distribution has been rotated about the vertical axis.
The market-implied outlooks from now until the middle of 2023 are consistently bullish and the options used for this analysis were obtained after PEP jumped about 4.5% following the Q3 earnings report. The expected volatility, about 25.6% (annualized), is quite low for an individual stock. This is to be expected for a low-beta stock and particularly for one with such a stable earnings history.
Summary
PepsiCo has substantially outperformed both the S&P 500 and the Consumer Staples sector over the past year. The company has been able to raise prices to counter inflation, demonstrating the company’s considerable price power. The just-reported Q3 EPS is meaningfully above the EPS for Q3 of 2021 and 2020. The Wall Street consensus rating is a buy, as it has been for all of the past year. The consensus 12-month price target corresponds to a total return of 10.4% over the next year. As a rule of thumb for a buy rating, I want to see an expected total return that is at least ½ the expected volatility (25.6%). PEP falls somewhat short of this threshold, as was the case six months ago. The market-implied outlooks to early- and mid-2023 are both bullish. Even though the consensus price target is lower than I would prefer, PEP’s solid earnings trajectory, the Wall Street consensus buy rating, and the bullish market-implied outlooks convince me to maintain the buy rating on PEP.
Be the first to comment