


Marco Bello
Q3 recap and thesis
PayPal (NASDAQ:PYPL) release its Q3 earnings report (“ER”) last week. The results are mixed the way I see it, and the market responded negatively with an 11% price correction after the ER. To wit, on the positive side, its Q3 results beat consensus estimates on both lines. Its Non-GAAP EPS came in at $1.08. It is 3 cents below an EPS of $1.11 in Q3 2021, but it beats consensus estimates by $0.12. It raked in total revenue of $6.85B, a robust 10.8% growth YOY, and beats consensus estimates slightly by $30M. Furthermore, it also raised its non-GAAP EPS guidance for full-year 2022 to a range of $4.07-$4.09 (vs. the prior range of $3.87-$3.97).
On the negative side, its revenue guidance was lowered to $27.53B for the full-year 2022. It is both lower than its prior outlook of $27.85B and also the Consensus estimate of $27.87B. Indeed, there are large uncertainties ahead and competition is intensifying. The global payment landscape is ever evolving, and management has to keep updating their products and services fresh and relevant. Many of its initiatives will come at a cost and face uncertain outcomes for years. These initiatives include its ongoing addition of Apple Pay, instore Tap to Pay functionality in selected locations, its crypto transfers between PayPal and other wallets, and also the expansion of its buy-now-pay-later offerings. I anticipate all these efforts would add to its general & administrative expenses, R&D expenses, and also possibly higher transaction costs (at least for some time). All these costs would weigh on the bottom line. As an indication of such pressure, it suffered a 630-basis-point operating margin contraction during the first half of 2022.
These above issues, when combined with the macroeconomic uncertainties, have kept its stock prices in a trading window between $70 to $100 since April as you can see from the following chart. And this leads me to the thesis of today, which is twofold. Firstly, I see the above uncertainties to persist in the next few quarters and as a result, keep trapping its price within this trading range. And secondly, I see such a trading window as a blessing in disguise for GARP (growth at reasonable prices) investors in the long term, as to be elaborated on immediately below.
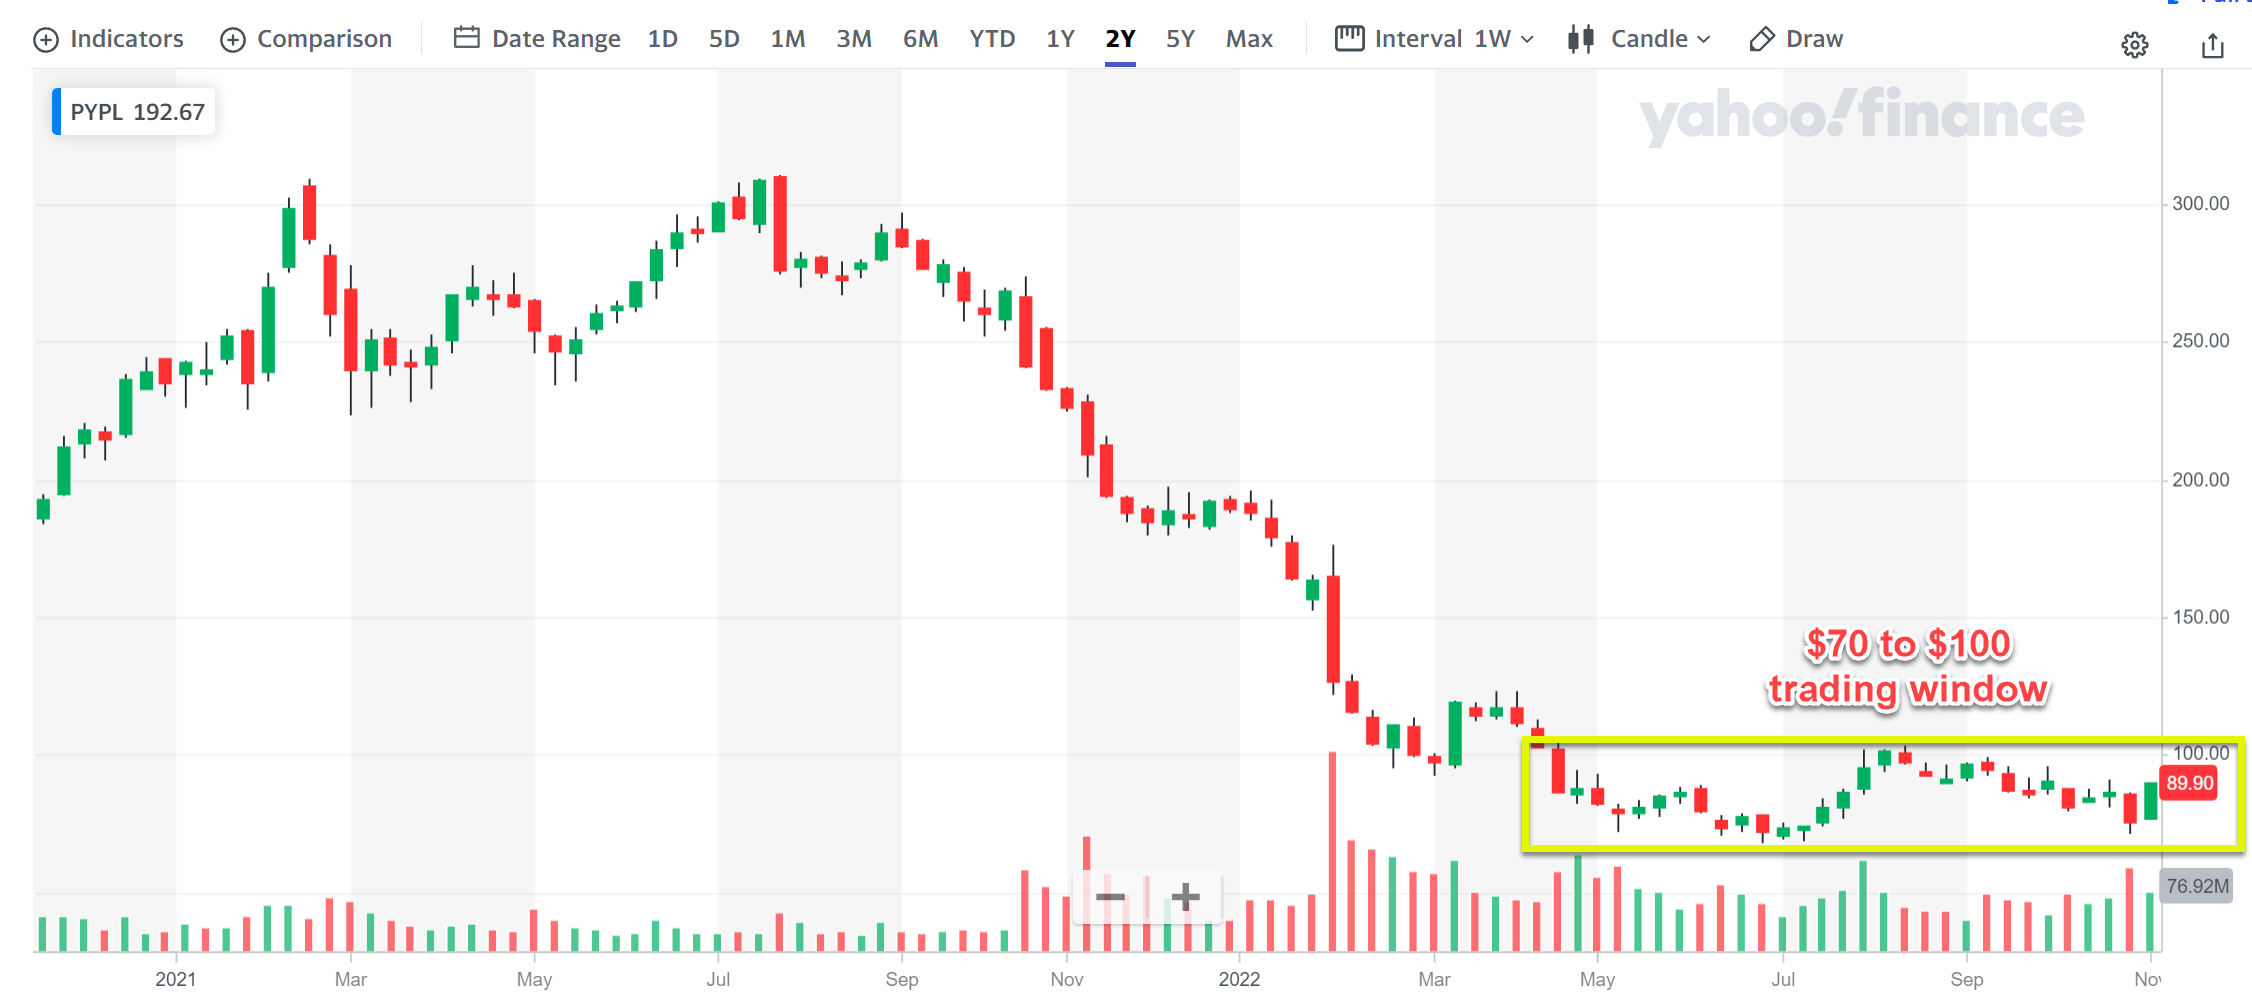
Source: Yahoo! data
PYPL profitability viewed from a vantage point
Let’s start by broadening our view past the quarter results. And I will start by comparing its profitability against other businesses at a macroscopic level using the so-called Fama French analysis. The details of the method have been provided in our earlier article. The data used in this article were obtained from the Dartmouth Tuck Business School database. This article then processed the raw data following the Fama-French method. A brief recap of the method:
The method is named after Eugene Fama and Ken French. Fama shared the Nobel Prize in economics with Lars Peter Hansen and Robert Shiller. The Fama French method is considered a significant improvement over the CAPM method because it adjusted for outperformance tendency.
The two charts below show the two results: PYPL’s profitability factor and valuation factors compared to the general market. Past results have shown that these two factors have truly held up over all time periods.
- The OP factor (Operating Profitability). The operating profitability factor in period t is defined as the operating income divided by the sum of book equity and minority interest for the last fiscal year ending in time period t-1.
- The P/E factor (the Price/Earnings ratio). The P/E factor is based on total earnings before extraordinary items, from Compustat.
The chart below shows the OP factor of PYPL contextualized against the overall market by percentile. As seen, PYPL is boast superb profitability relative to the overall market. Its OP is on average 16.5% in the past 5-years, slightly below the 50% percentile of the overall market (shown by the thin red line). Furthermore, as detailed in my blog article, OP underestimates PYPL’s profitability and ROCE (return on capital employed) is a more accurate profitability metric here. Measured by ROCE, PYPL’s profitability is 57.8% on average in the past 5 years since 2018, close to the top 10% percentile (shown by the thin cyan line). The ROCE for the overall market is about 20% on average in the long term, quite close to the median OP in recent years.
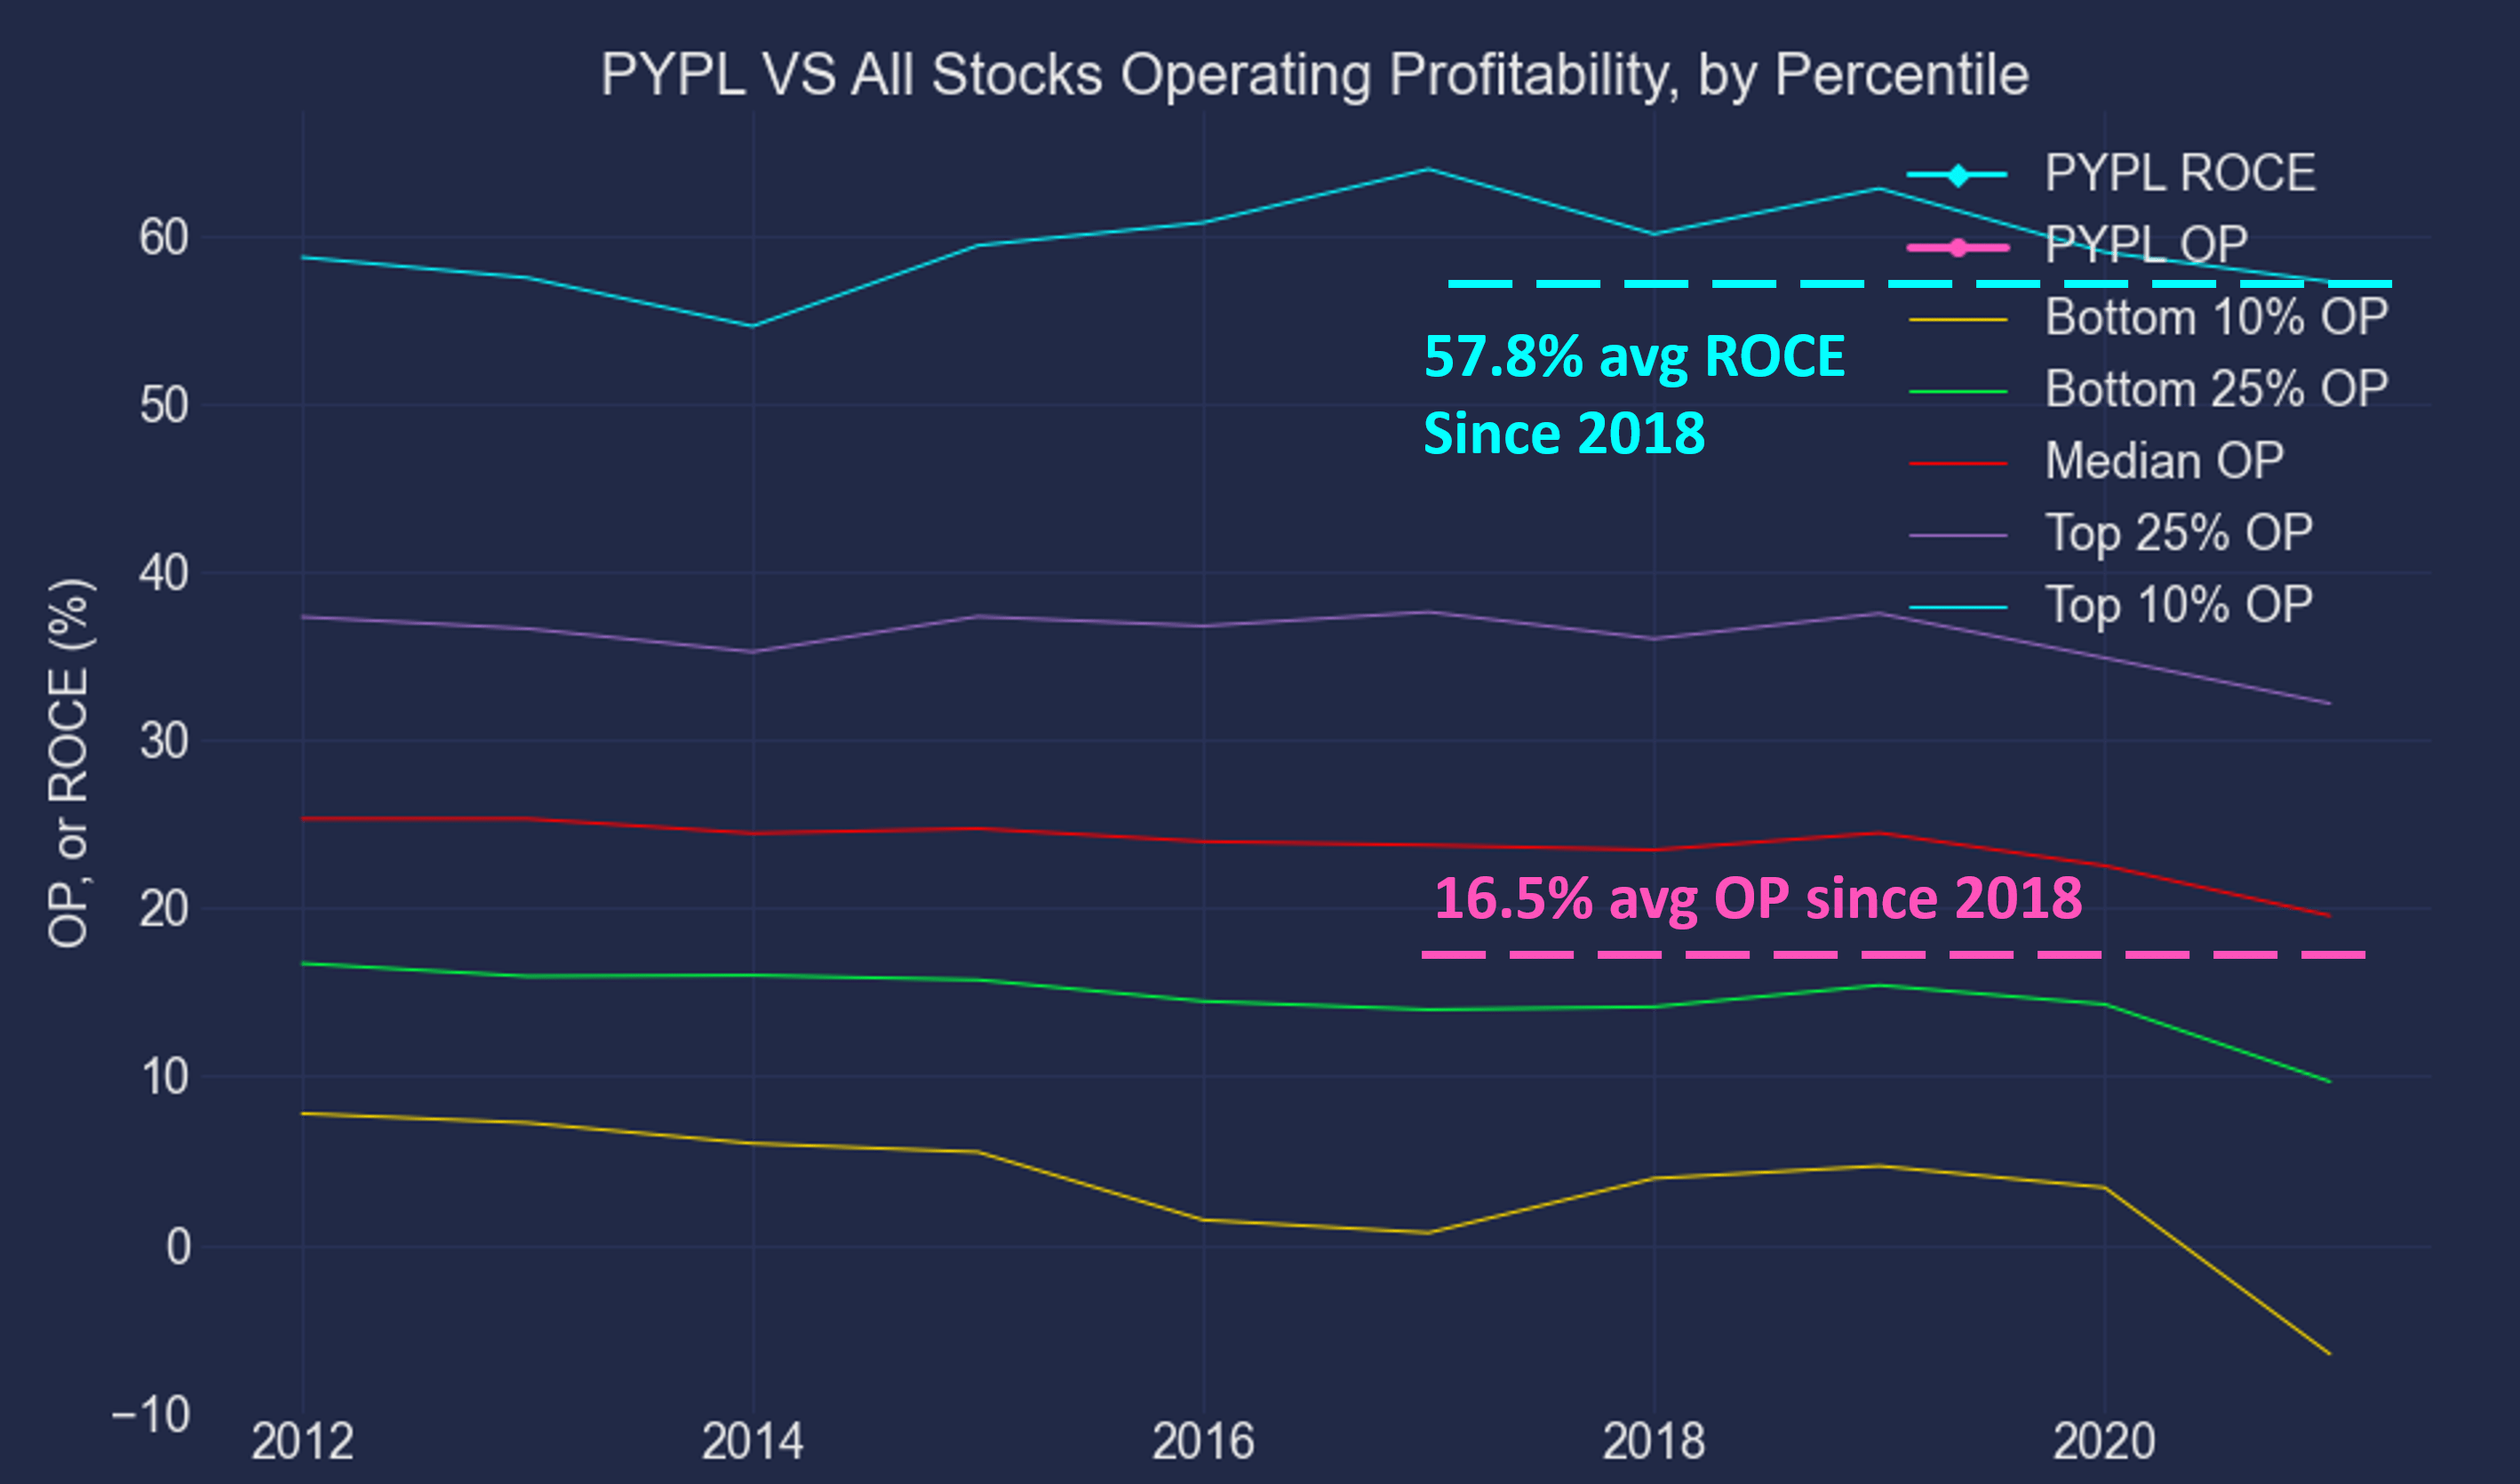
Source: Author
Fama French reveals $70 ~ $100 window as a blessing
The next chart shows its P/E factor, and you can see why I view the $70 ~ $100 window as a blessing in disguise. As you can see, consensus estimates project an FW EPS of around $4.23, leading to a current FW P/E of 21.28x. Such a P/E is well below the current market median (the thin green line), a stark contrast to its super OP factor as just mentioned above. Recall that its OP factor is well above the market median, and its ROCE factor is close to the top 10% percentile.
At a price near $70, the contrast is even starker. With the consensus estimates EPS, a price of $70 leads to an FW P/E of only 16.5x. And such a P/E is close to the bottom 25% percentile of the overall market (as shown by the thin red line below). While even at the upper bound of this range, a price of $100 translates to an FW P/E of 23.6x. It is still quite reasonable and is only slightly above the market median, still leaving a huge margin of safety given its superb profitability.
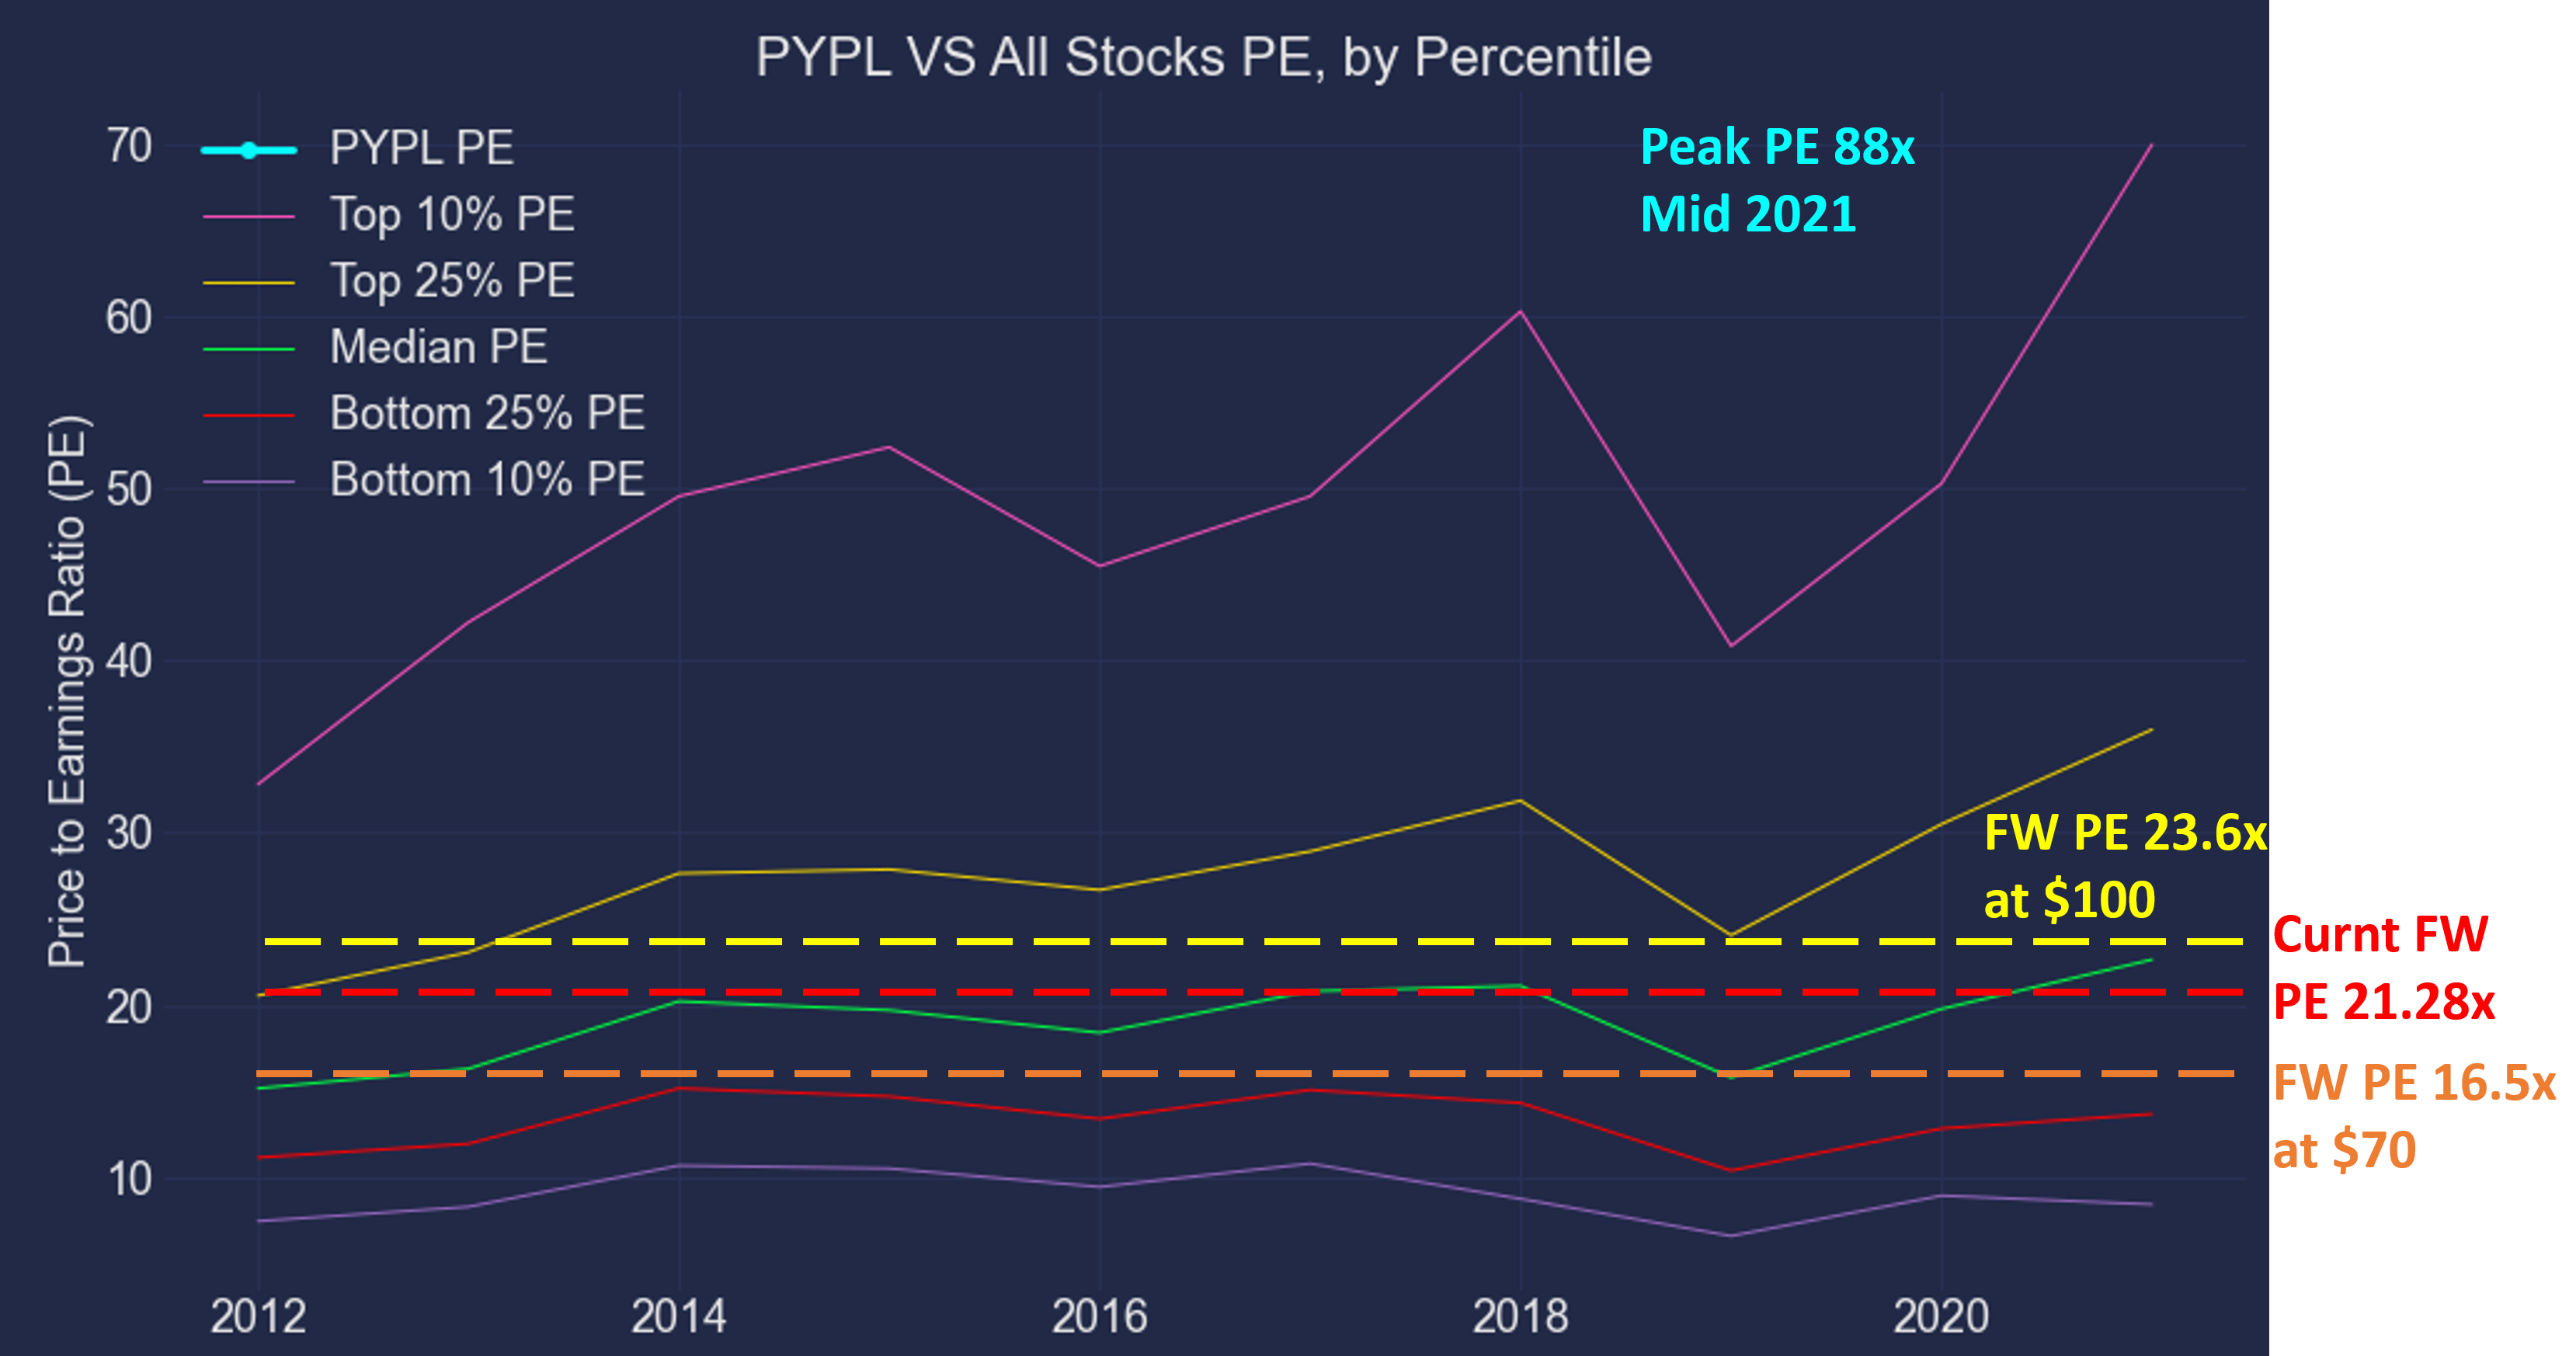
Source: Author
PYPL’s business outlook and growth initiatives
As such, I see the trading window as a good opportunity for GARP investors to accumulate shares. Looking past the immediate uncertainties aforementioned, the various PYPL platforms are among the most popular payment methods. And users worldwide still love using the various PayPal apps (this author’s own family alone has 2 avid users). As seen in the survey below, PYPL claim several spots among the 20 best mobile payment systems in 2022, including its PayPal Payments Pro (top 3), Venmo (top 6), and also PayPal Here (top 10).
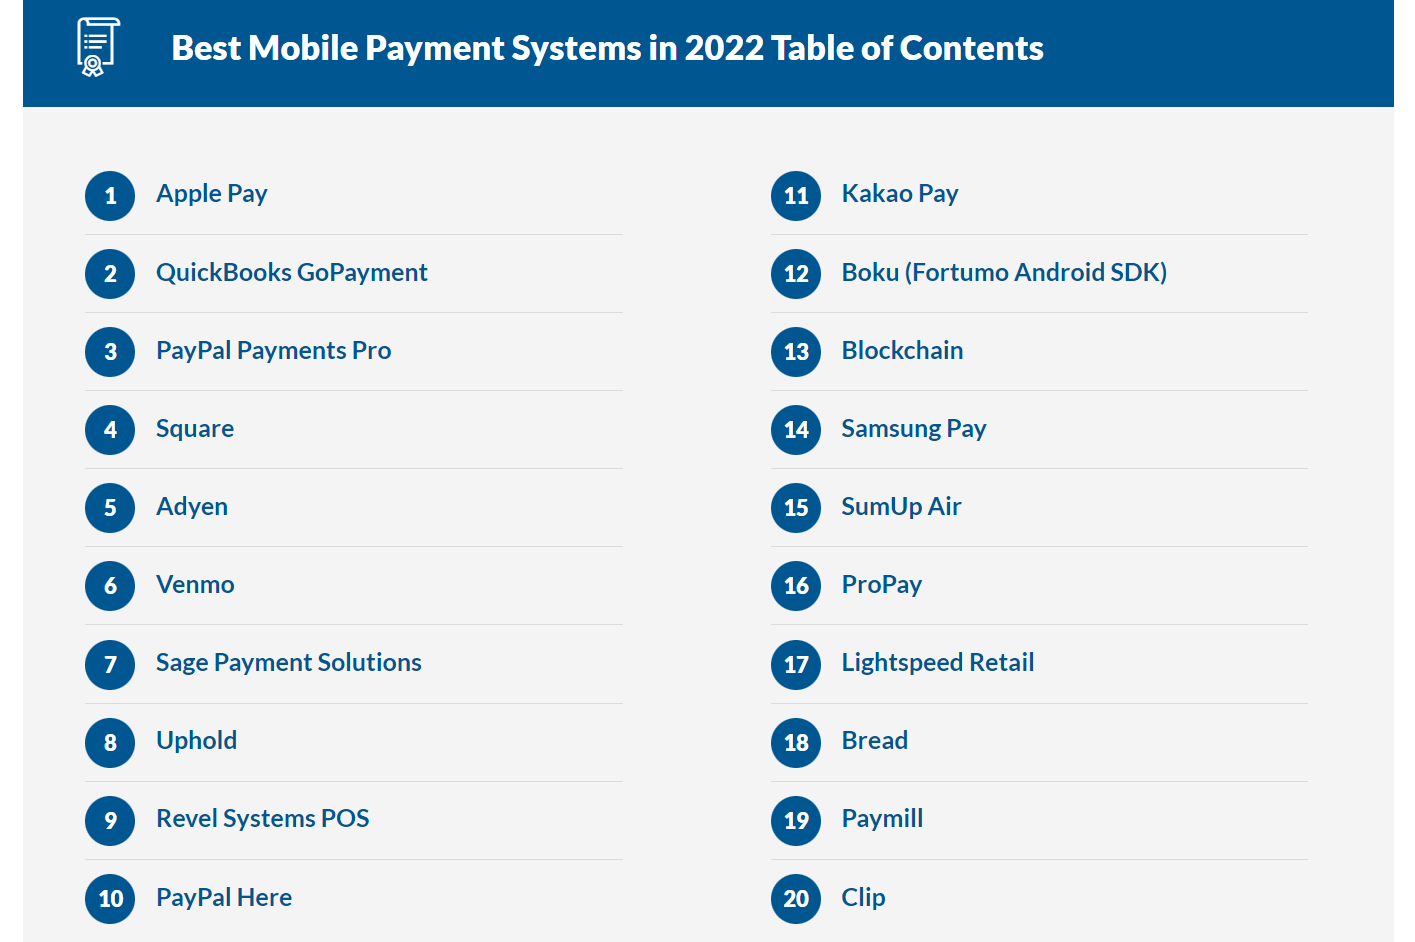
Source: financesonline.com/best-mobile-payment-systems/
At the same time, PYPL is still growing its user base at a healthy clip (about 9% YoY rates in recent quarters) and it has a few initiatives to keep the momentum going. Venmo and the addition to Apple pay are two notable examples as CEO Daniel Schulman pointed out during the ER (slightly edited with emphases added by me)
We are working with Apple to enhance our offerings for PayPal and Venmo merchants and consumers. Leveraging Apple’s Tap to Pay on iPhone technology, U.S. merchant customers will soon be able to accept contactless debit or credit cards and mobile wallets, including Apple Pay, using an iPhone and the PayPal or Venmo iOS app… Next year, U.S. customers will be able to add PayPal and Venmo network-branded credit and debit cards to Apple Wallet and use them anywhere Apple Pay is accepted. Venmo is now live as a new payment option for select Amazon customers, ramping to full availability for U.S. Amazon customers this holiday season.
With these initiatives, management anticipates an addition of another 8-10 million Net New Actives (“NNAs”) in Full-Year 2022. As you can see from the chart below, management also expects the TPV (total payment volume) to keep growing at a robust rate of ~8.5% on a spot basis. When currency headwinds are adjusted, the growth is even more impressive at ~12.5%.

Source: PYPL Q3 ER
Risks and final thoughts
As mentioned earlier, PYPL faces some large uncertainties ahead and also competition intensification. There is a multitude of players competing in the same space. If you recall from an earlier chart, in the mobile payments space alone, there are easily more than 20 top options for users and merchants. In the longer run, the FinTech evolution will keep posing unpredictable challenges. PYPL has to keep updating its products and services fresh and relevant. I anticipate its many initiatives to keep adding to its costs and weigh on the bottom line in the near term. In the near term, besides cost control, the company also faces geopolitical risks, inflation pressure, and global supply chain disruptions as commented by CEO Daniel Schulman in the ER (abridged and emphases added by me):
Russia, Ukraine and China are contributing to increased global uncertainty and incremental inflationary and supply chain pressures. And more specific to PayPal, forecasting normalized consumer e-commerce spending, as we come out of the pandemic, is exceedingly complex.
All told, the thesis here is that these above issues would continue to trap its stock prices between $70 to $100 in the new future. However, I see such a trading window as a blessing in disguise for GARP investors to accumulate shares. Viewing from a macroscopic level, the discrepancy between its valuation factor and profitability factor is simply too large to ignore. A price of $70 leads to an FW P/E of only 16.5x, close to the bottom 25% percentile of the overall market. And a price of $100 translates to an FW P/E of 23.6x, close to the market median. Yet, its profitability is near the top 10% percentile.
Be the first to comment