

jansucko/iStock via Getty Images
Part I – Introduction
Chicago-based Coeur Mining (NYSE:CDE) released its first-quarter 2021 results on May 4, 2022.
Note: I have followed CDE quarterly since 2019 with 16 articles and counting. This new article is a quarterly update of my article published on February 20, 2022.
1 – 1Q22 results snapshot
Coeur Mining’s quarterly revenue was $188.40 million, representing a decrease of 6.8% year-over-year. Net income was $7.68 million or $0.03 per diluted share, compared to an income of $2.06 million or $0.01 per share last year. Revenues were weak due to a lower gold production affected by COVID-19 restrictions.
The company is still suffering from the temporary closure of its silver mine, Silvertip, located in northern British Columbia, Canada. From the company:
Coeur temporarily suspended mining and processing activities at Silvertip in early 2020 due to unfavorable market conditions as well as ongoing operational challenges. The Company has since conducted additional technical work and exploration activities to evaluate and support a potential expansion and restart of the operation.
However, on the positive side, Kensington mine in Southern Alaska received the permits to extend the tailings and waste rock capacity by up to 10 years. Furthermore, Rochester expansion is advancing with 80% of capital committed.
CDE: Rochester presentation (Coeur Mining)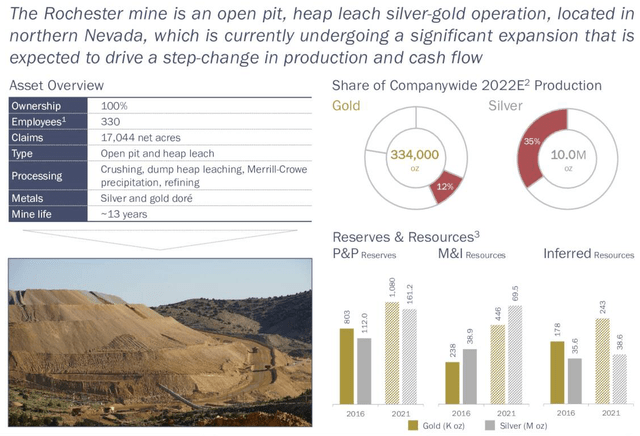
Below indicated are the 1Q22 highlights from the company’s presentation:
CDE: 1Q22 Highlights Presentation (Coeur Mining)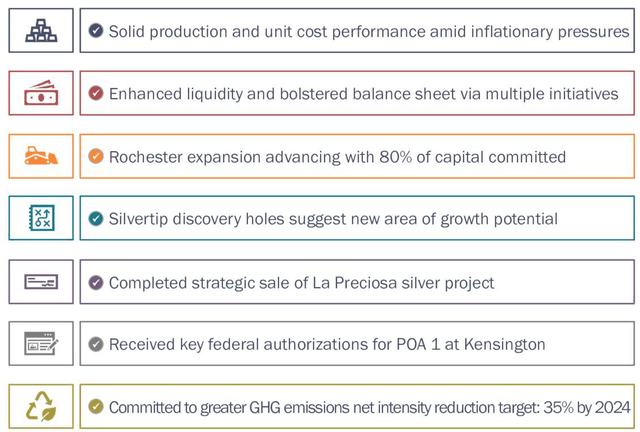
CEO Mitch Krebs said in the conference call:
As those who follow the sector are keenly aware, lingering effects from COVID and inflationary pressures were two key themes during the quarter. However, COVID-related disruptions appear to be dissipating and we’re managing our way through the supply chain shortages, disruptions and higher cost environment through our commitment to continuous business improvement initiatives at each of our operations.
2 – Investment thesis
The investment thesis for this gold and silver miner is to invest carefully, notably since the silver price has dropped significantly and is down over 20% on a one-year basis.
CDE: Gold Silver performance 1 Year (Fun Trading with Stockcharts)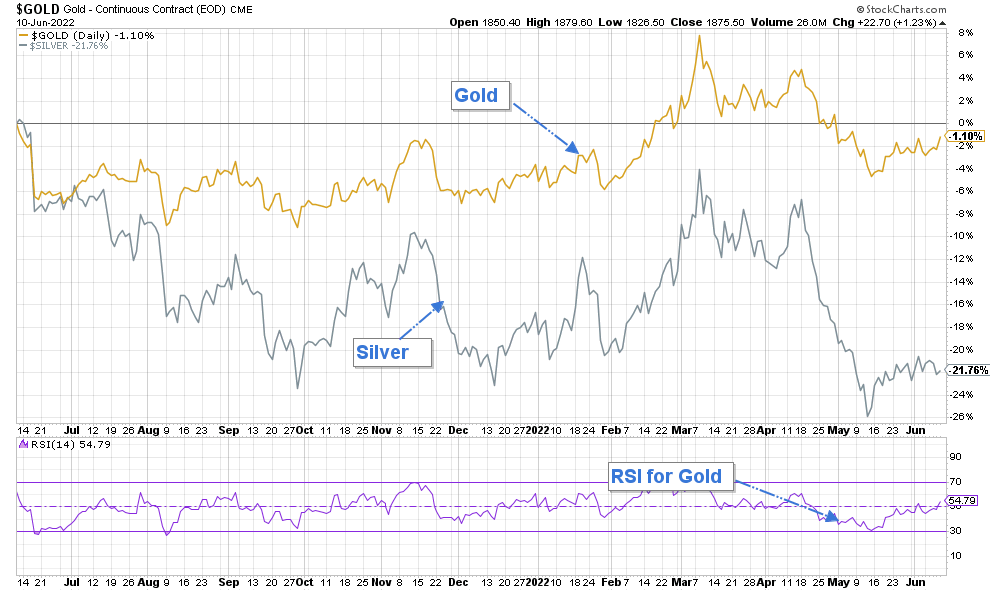
I recommend trading short-term LIFO in the gold/silver price volatility and keeping a small long-term core position for higher grounds.
The gold price is trading around $1,840 per ounce due to multi-year high inflation, reaching over 8.5%. The Fed is expected to act against inflation again this week by raising interest in June between 50-point and 75-point. This hawkish action is generally a negative for gold and silver.
3 – Stock Performance
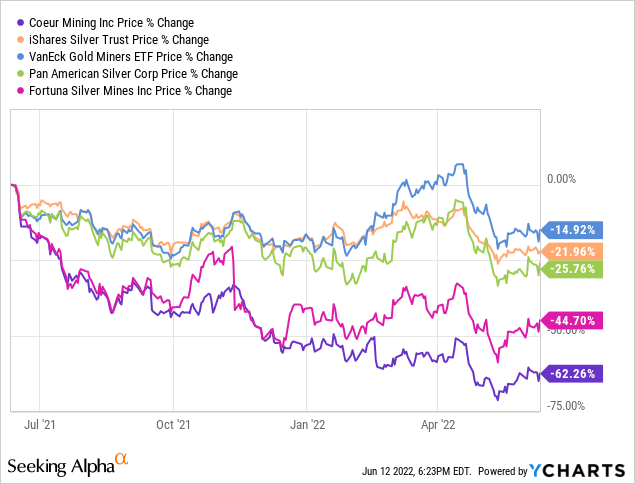
CDE sank dramatically in November 2021, underperforming the iShares Silver Trust ETF (SLV) and the VanEck Vectors Gold Miners ETF (GDX), and even Pan American Silver (PAAS) and Fortuna Silver Mines (FSM). The stock plunged 62% on a one-year basis.
4 – Gold And Silver Production In 1Q22
Strong performances at Palmarejo mine and Wharf mine were offset by weaker than expected executions at Rochester and Kensington, leading to low quarterly revenues and costs.
4.1 – Palmarejo mine. Solid quarter.
CDE: Palmarejo gold and silver production history (Fun Trading)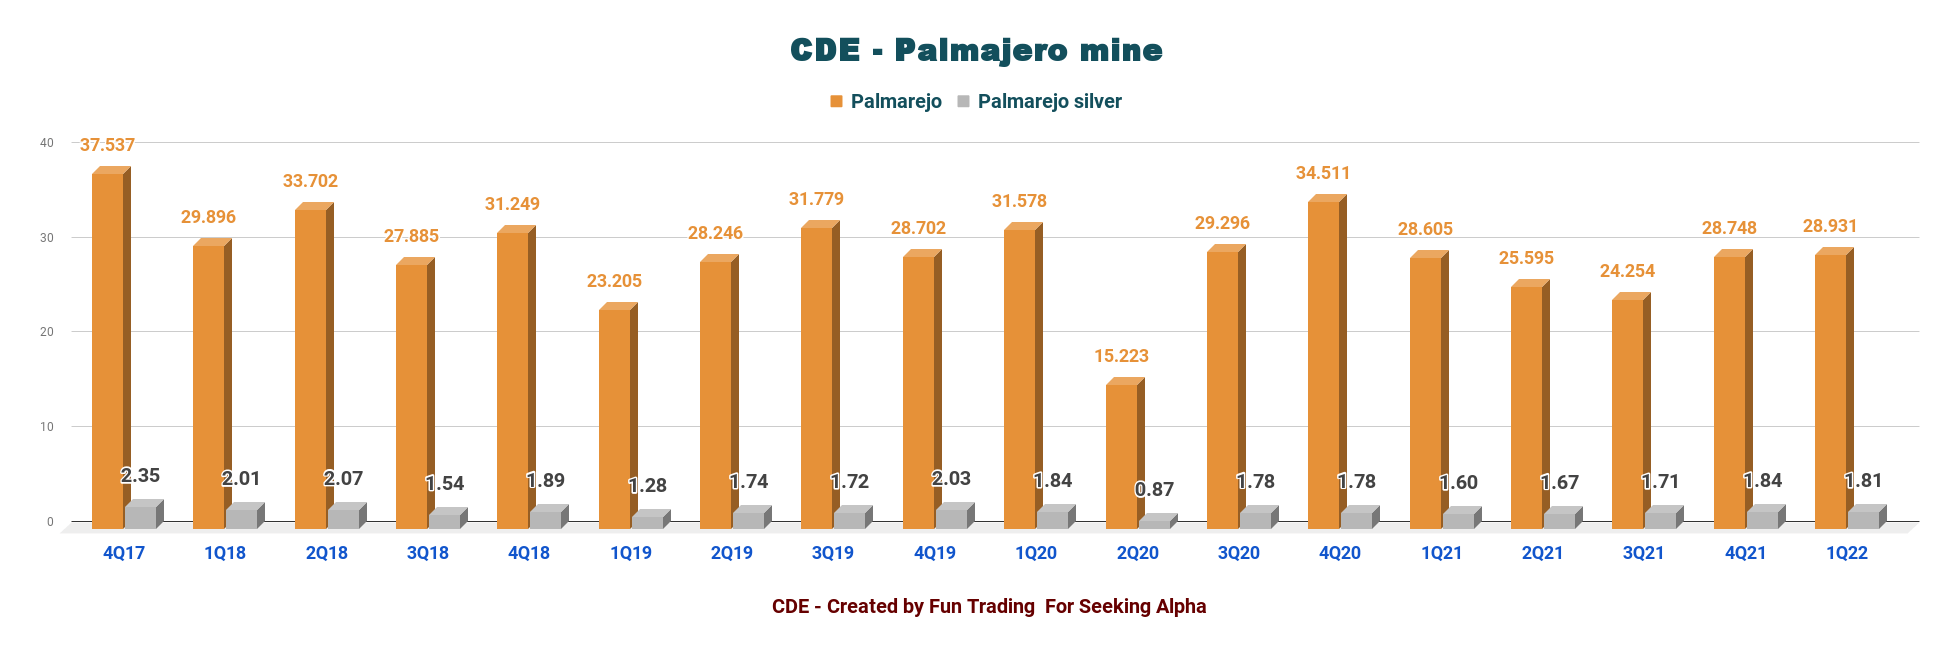
4.2 – Kensington mine. Low production this quarter.
CDE: Kensington gold production history (Fun Trading)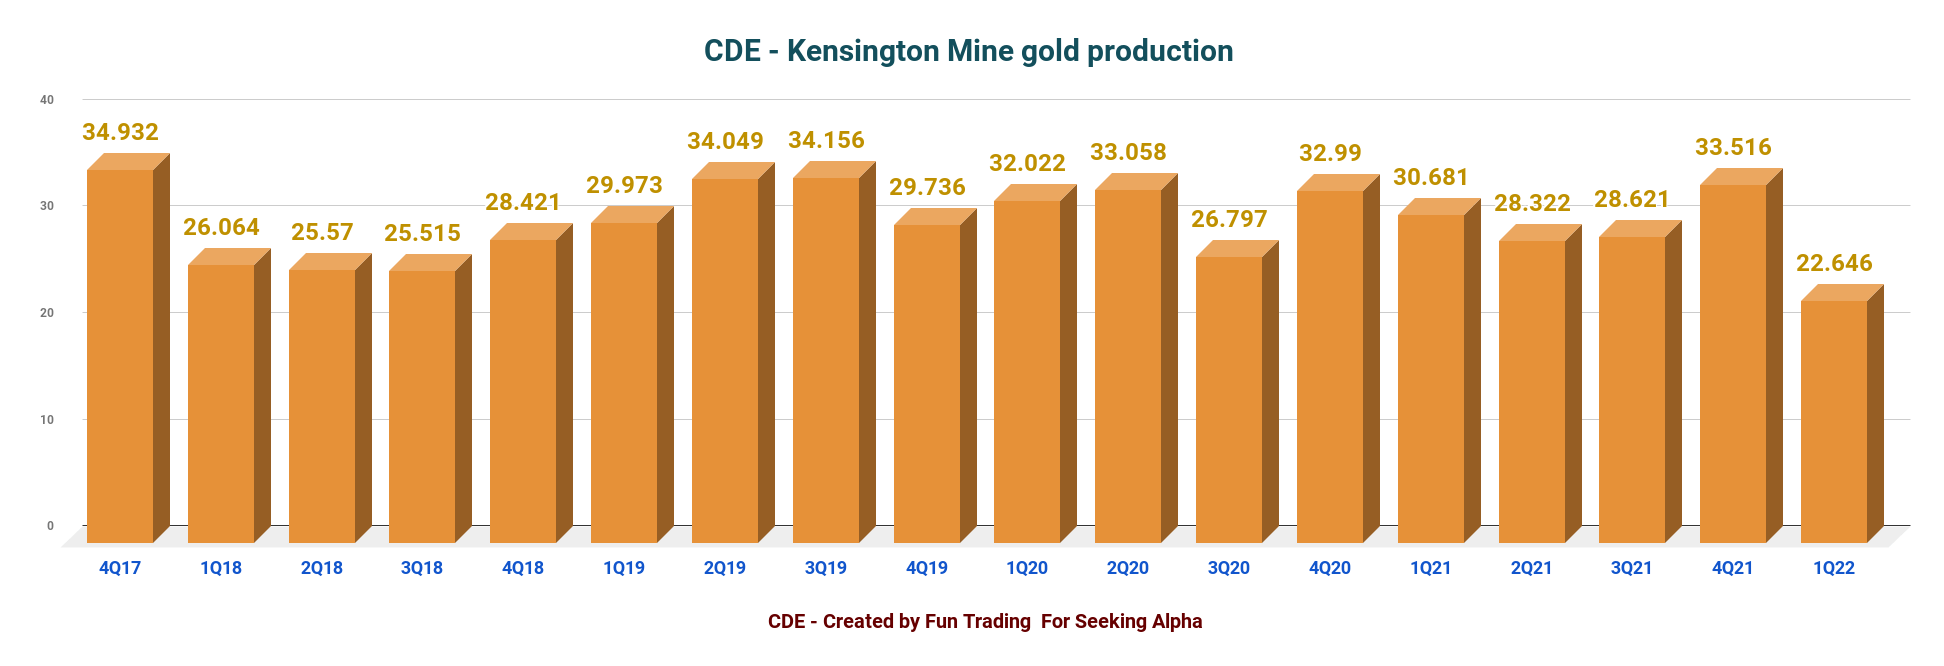
4.3 – Coeur Mining metal production
Gold and silver sales were 69% and 31% of quarterly revenue. The company’s U.S. operations were approximately 56% of the first-quarter revenue.
Metal sales totaled 75,409 oz of gold and 2.463 million oz of silver in 1Q22.
Average realized gold and silver prices for the quarter were $1,721 and $24.06 per ounce, respectively, compared to $1,645 and $24.18 per ounce in the prior period.
Lower production in 1Q22 is mainly due to lower placement rates in the prior quarter.
CDE: Quarterly gold and silver prices history (Fun Trading)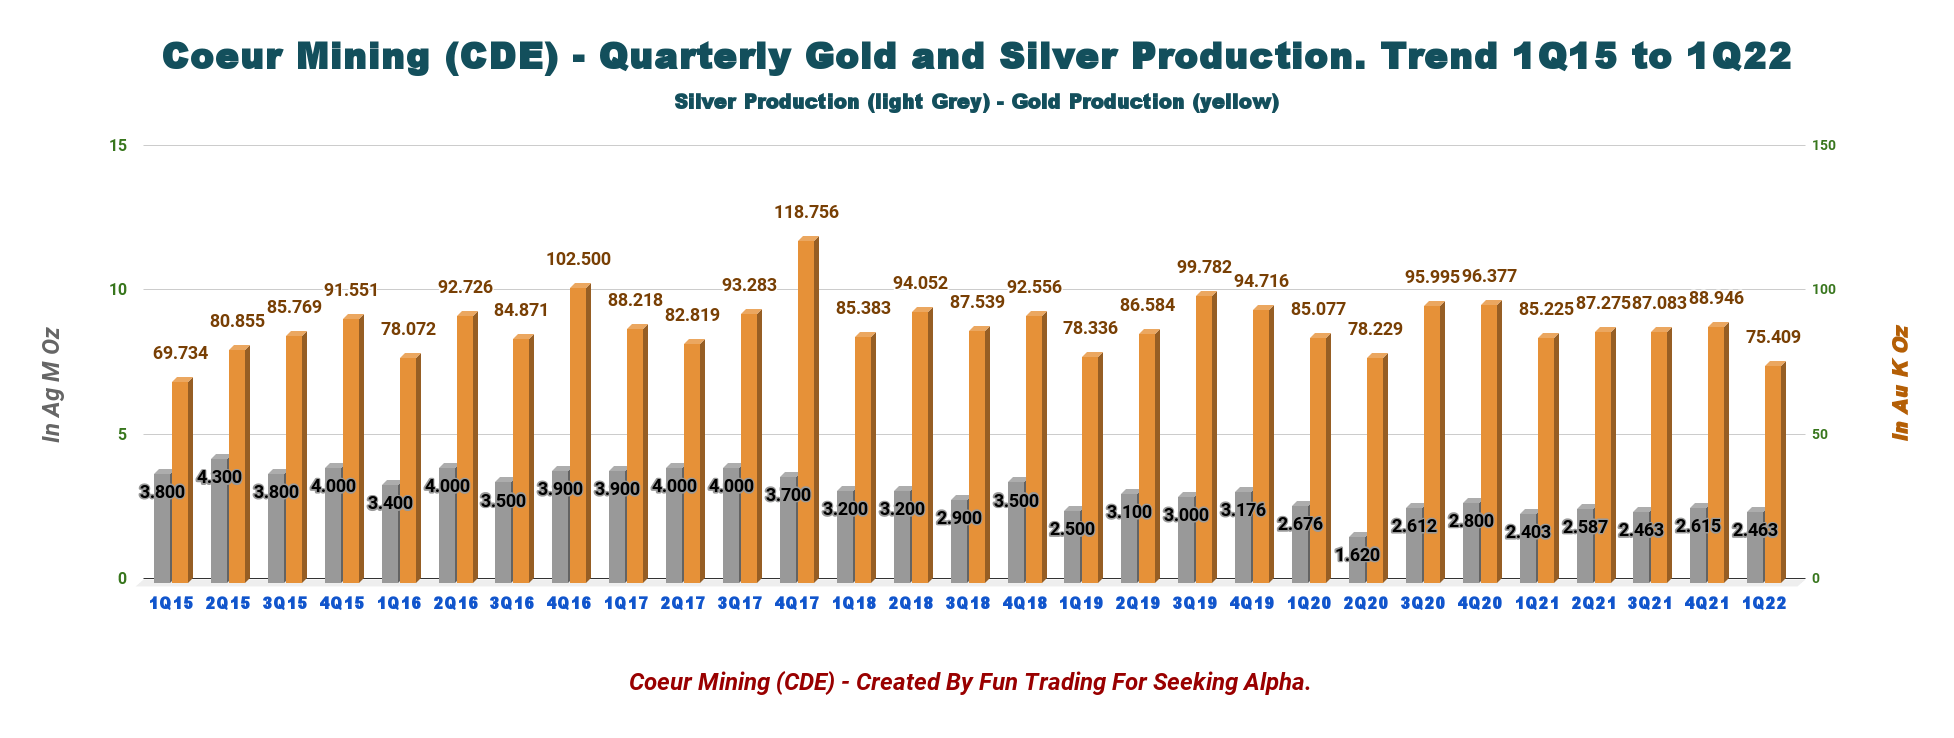
Gold production for the first quarter was down 11.5% compared to the same quarter last year.
CDE: Production gold and silver per mine in 1Q22 (Fun Trading)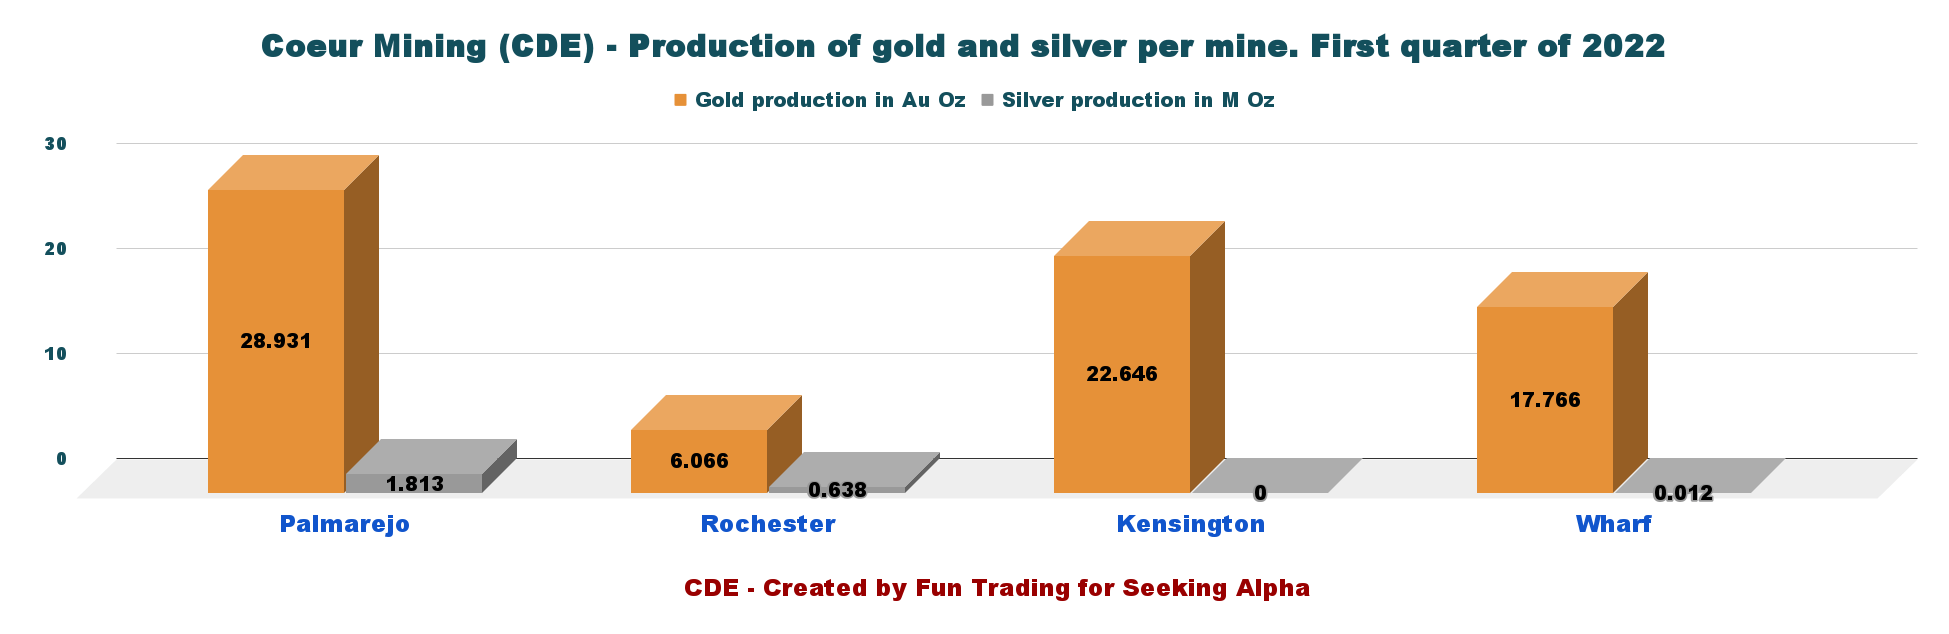
Below is the historical price for both metals.
CDE: Quarterly gold and silver prices history (Fun Trading)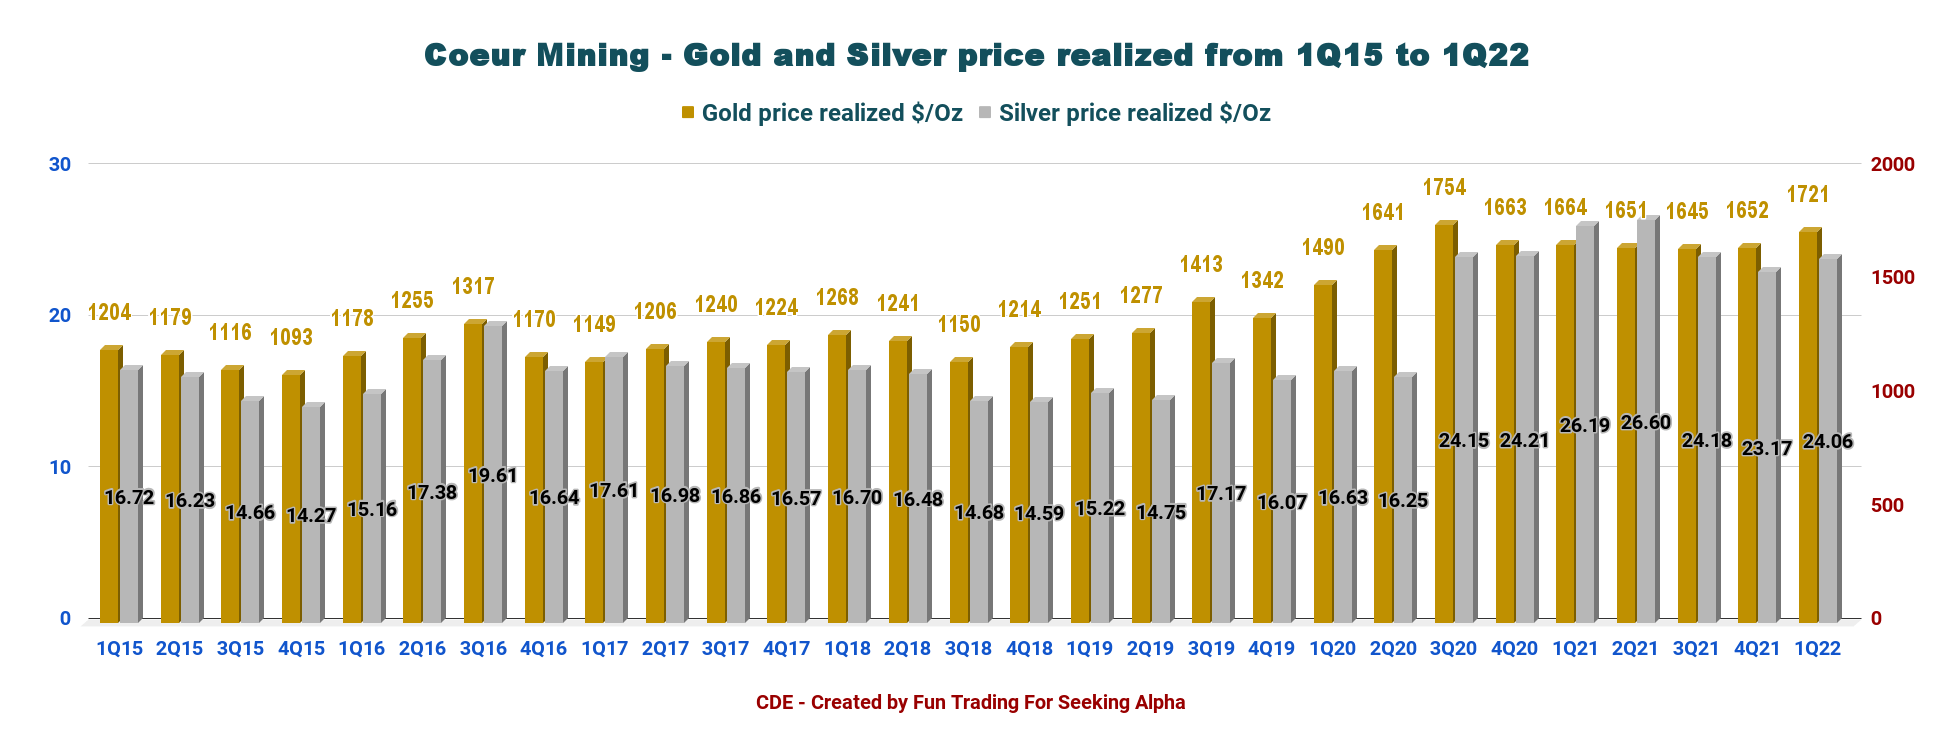
Silvertip is expected to restart production in 2023, while Rochester expansion will be completed in early 2023.
CDE: Silvertip mine Presentation (Coeur Mining)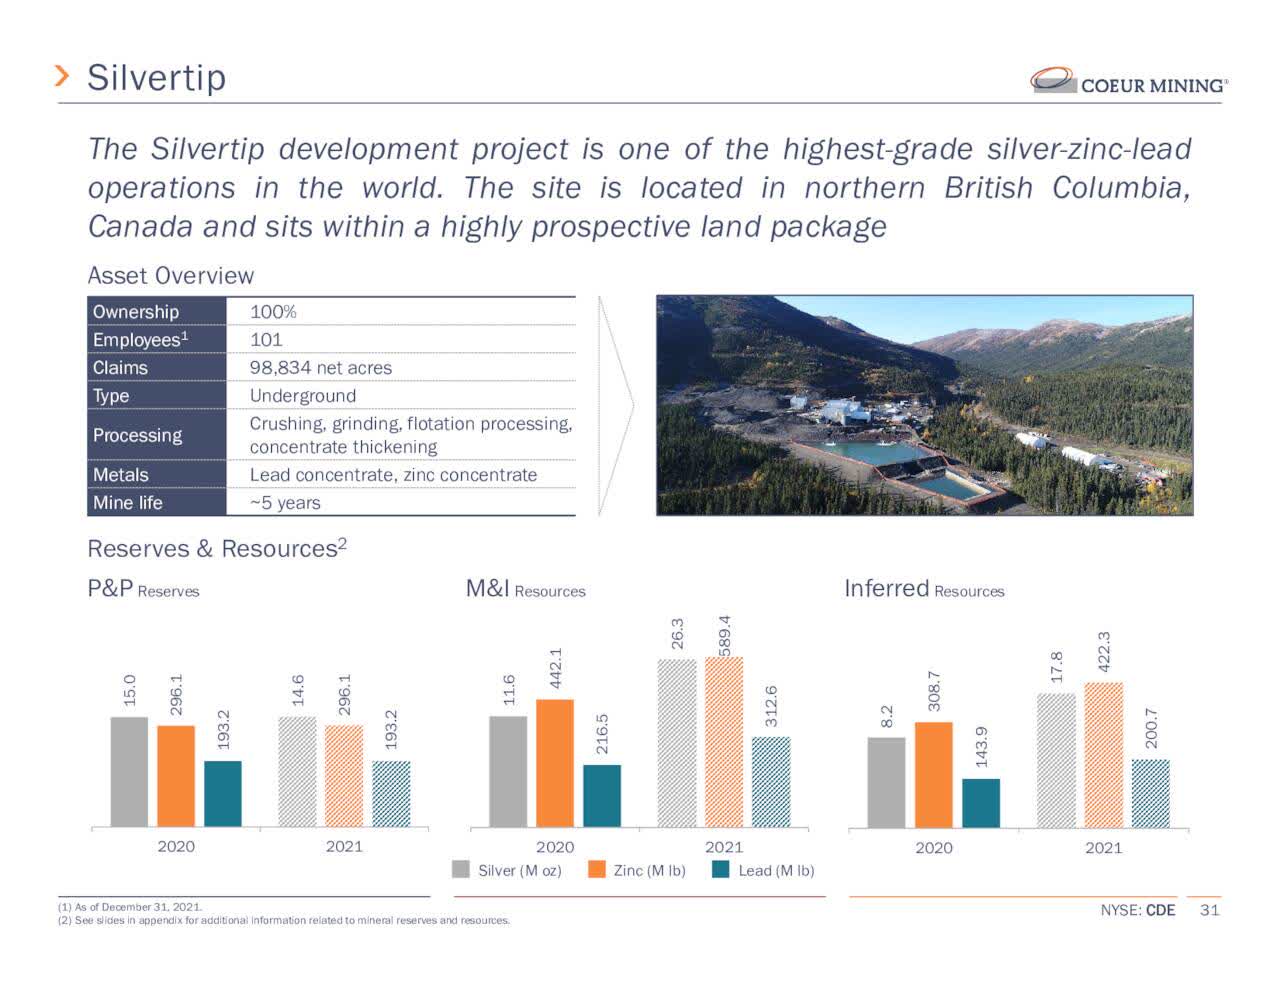
Part II – Coeur Mining: Financials In 1Q22 – The Raw Numbers
| Coeur Mining | 1Q21 | 2Q21 | 3Q21 | 4Q21 | 1Q22 |
| Total Revenues in $ Million | 202.12 | 214.86 | 207.97 | 207.88 | 188.40 |
| Net income in $ Million | 2.06 | 32.15 | -54.77 | -10.76 | 7.68 |
| EBITDA $ Million | 49.29 | 84.07 | -14.58 | 27.91 | 39.96 |
| EPS diluted in $/share | 0.01 | 0.13 | -0.21 | -0.05 | 0.03 |
| Cash from operating activities in $ Million | -4.36 | 58.06 | 21.85 | 34.94 | -6.43 |
| Capital Expenditure in $ Million | 59.42 | 78.22 | 71.27 | 100.87 | 69.50 |
| Free Cash Flow in $ Million | -63.78 | -20.16 | -49.42 | -65.93 | -75.93 |
| Total cash $ Million | 154.07 | 124.08 | 85.02 | 56.66 | 73.33 |
| Total Debt (including lease obligation) In $ Million | 412.1 | 414.25 | 419.42 | 487.50 | 485.51 |
| Shares outstanding in Million | 244.5 | 252.1 | 254.7 | 257.15 | 263.56 |
Data Source: Company release
Analysis: Revenues, Free Cash Flow, Debt, And Production Details
1 – Revenues and trends – Revenues were $188.4 million in 1Q22
CDE: Quarterly revenues history (Fun Trading ) Coeur Mining posted $188.40 million in revenues, with an EBITDA of $39.96 million and cash flow loss from operating activities of $6.43 million. The adjusted net income was a loss of $13.8 million, or $0.05 per share.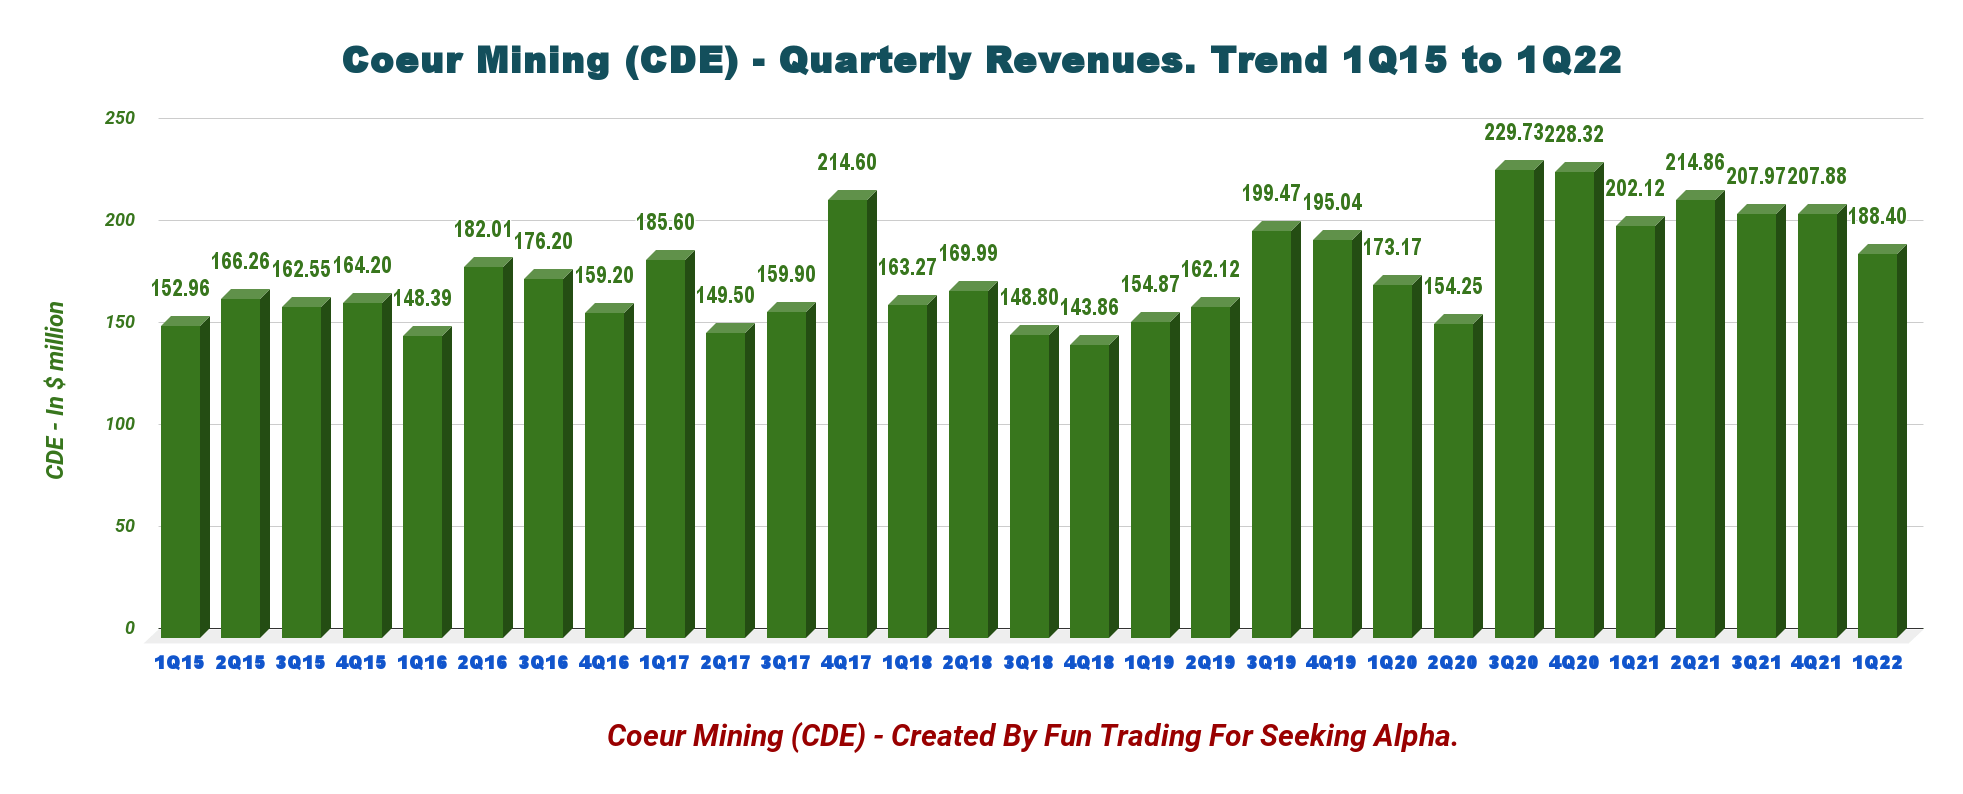
The company reported a net income of $7.68 million, or $0.03 per diluted share, compared with $0.06 per share a year ago.
2 – Free cash flow was a loss of $75.93 million in 1Q22
CDE: Quarterly Free cash flow history (Fun Trading)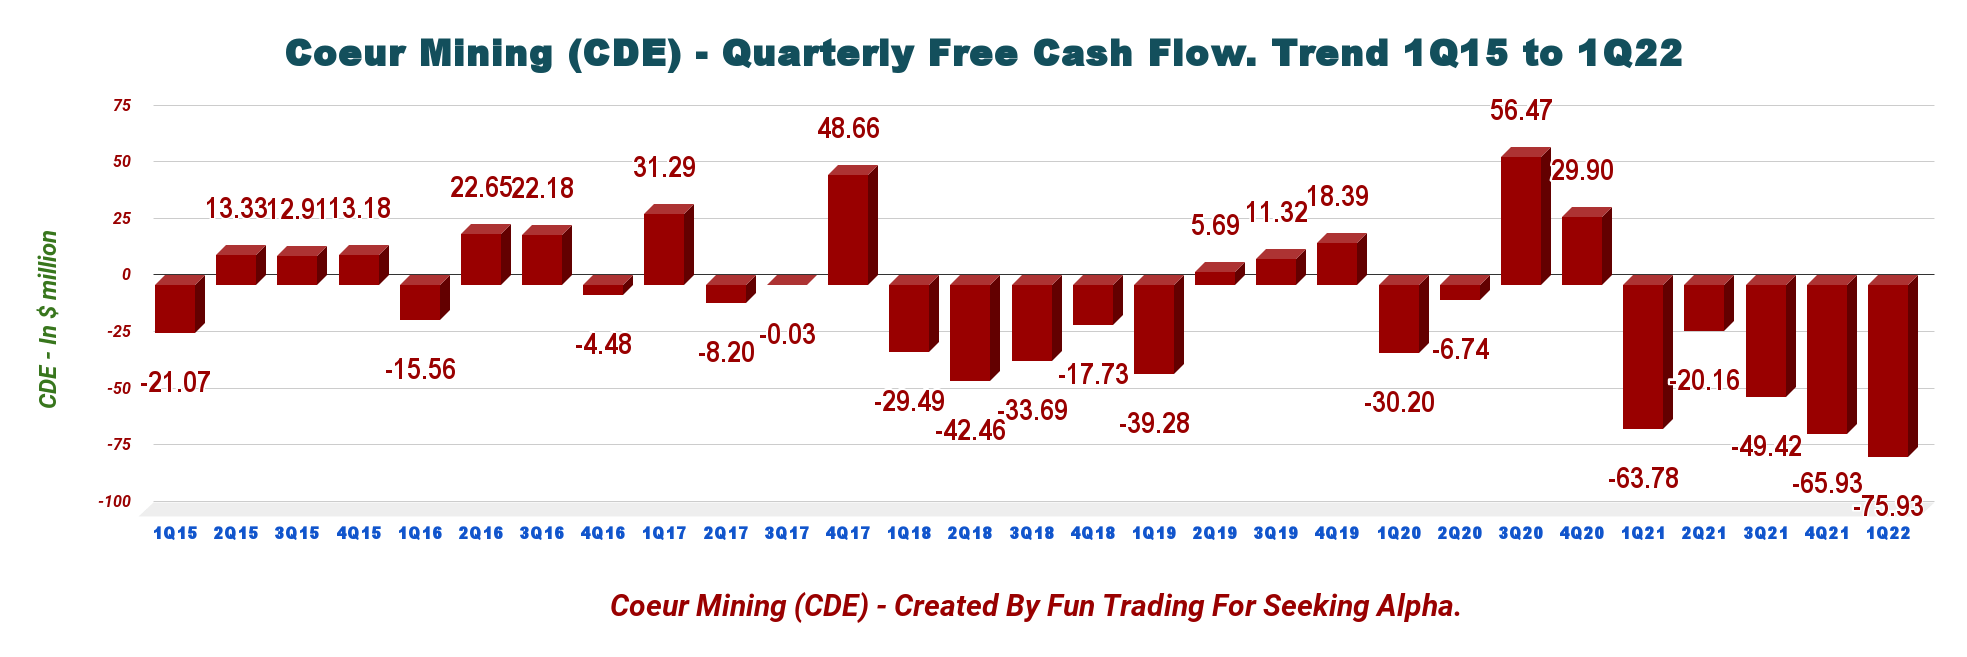
Note: Generic free cash flow is cash from operations minus CapEx
Coeur Mining’s free cash flow for the first quarter of 2021 was a loss of $75.93 million, and the trailing 12-month free cash flow was a loss of $211.44 million.
The company’s CapEx in 1Q22 was $69.5 million.
3 – Available capital, net debt, liquidity, and hedges.
CDE: Quarterly Cash versus total debt history (Fun Trading)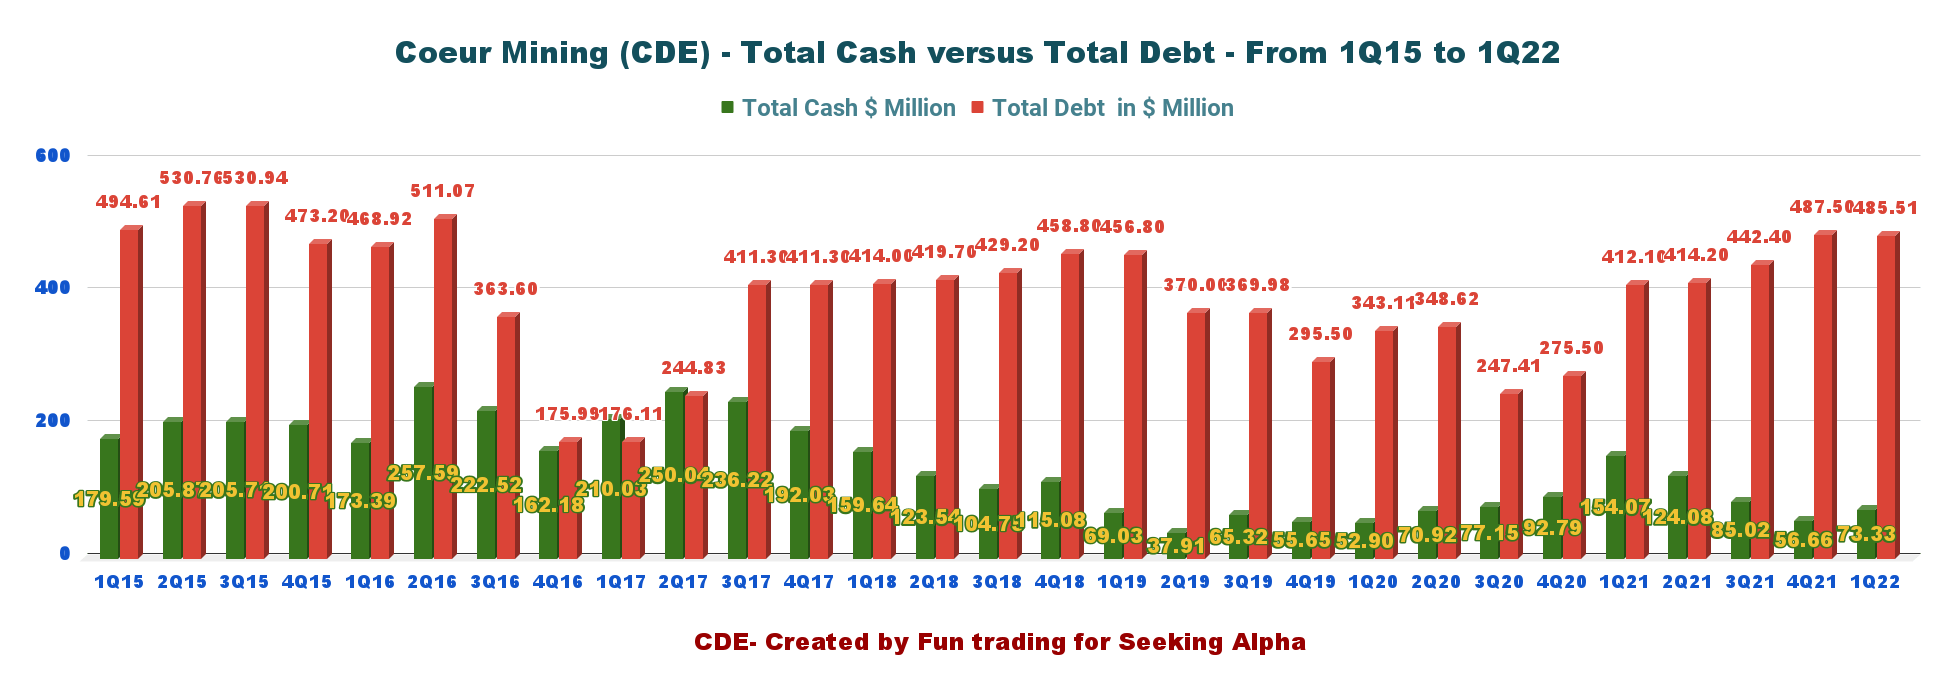
Total debt was $485.51 million, and net debt was $412.2 million. Net debt to adjusted EBITDA is 0.9x. Cash, cash on hand, and marketable securities were $73.33 million.
For financial ratios and Metal sales hedges, please see below:
CDE: Balance sheet and liquidity (Fun Trading)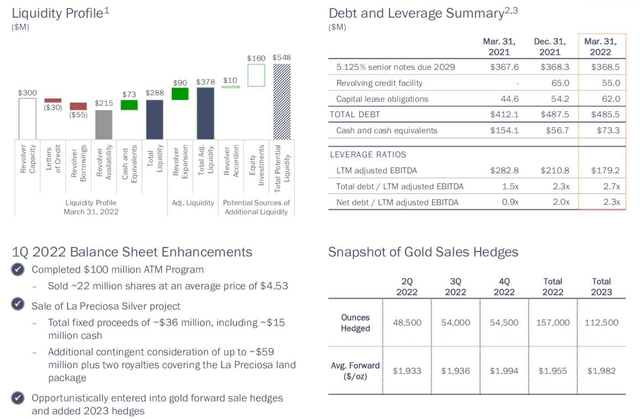
4 – 2022 Outlook
2022 gold production is expected to be between 315K-383K oz, while silver production is between 9,000 to 11,000 Koz.
CDE 2022 guidance Presentation (Coeur Mining)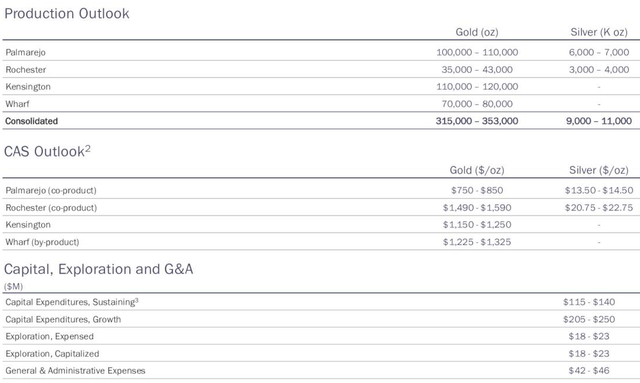
Technical Analysis And Commentary
CDE TA Chart short-term (Fun Trading)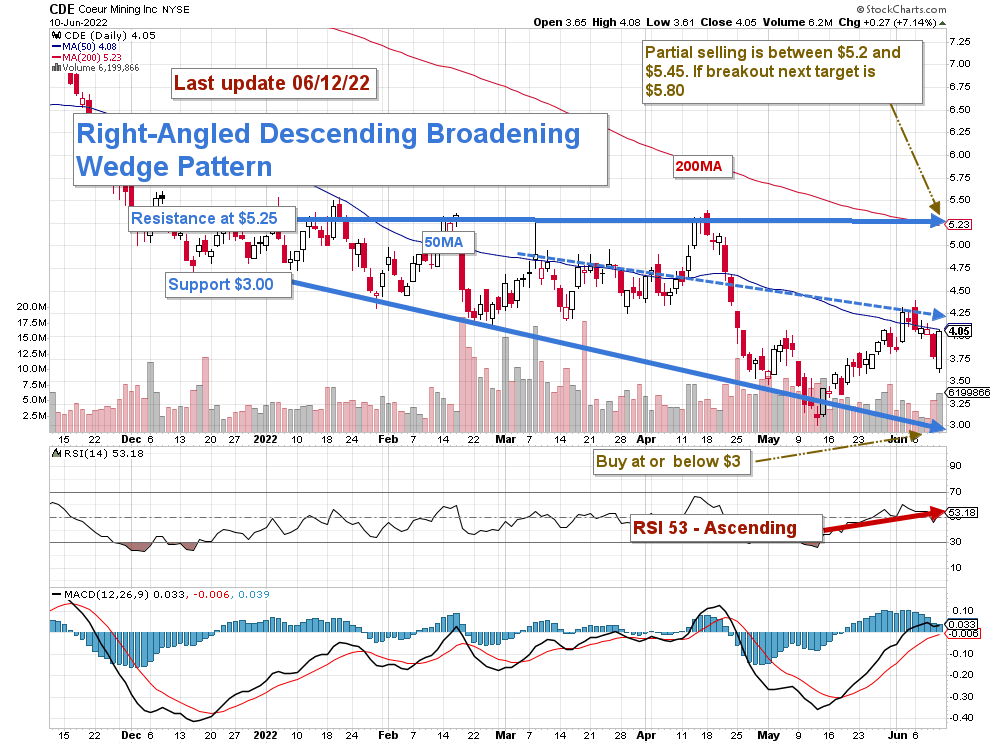
CDE forms a right-angled descending broadening wedge pattern with resistance at $5.25 and support at $3.00. Mid-resistance/support is $4.25. The trading strategy is to sell about 35%-50% of your position LIFO and keep a core long-term position for a higher target back, around $6 to $7.
I suggest taking profits (about 35%-50%) between $5.45 and $5.2 and waiting patiently for a retracement below $3.30 to accumulate again.
CDE is highly correlated to the gold and silver prices and could drop rapidly depending on the Fed’s action against rampant inflation, which seems out of control lately.
The market expects the FED to hike interest 50-point or 75-point this coming week. The release of the CPI last week showed concerning inflation and may push the FED to turn very hawkish, hurting gold in the process.
However, the Gold price has fared very well the past few weeks after suffering a significant drop early last month due to the first FED’s 50-point hike. Gold closed at $1,870 last week after a potential recession spooked the market. However, I think it is only temporary, and gold will likely weaken in the short term.
Be cautious and watch the gold and silver prices like a hawk.
Note: The LIFO method is prohibited under International Financial Reporting Standards (IFRS), though it is permitted in the United States by Generally Accepted Accounting Principles (GAAP). Therefore, only US traders can apply this method. Those who cannot trade LIFO can use an alternative by setting two different accounts for the same stock, one for the long term and one for short-term trading.
Warning: The TA chart must be updated frequently to be relevant. It is what I am doing in my stock tracker. The chart above has a possible validity of about a week. Remember, the TA chart is a tool only to help you adopt the right strategy. It is not a way to foresee the future. No one and nothing can.
Author’s note: If you find value in this article and would like to encourage such continued efforts, please click the “Like” button below to vote for support. Thanks.
Be the first to comment