

JasonDoiy
Our view
PayPal Holdings, Inc (NASDAQ:PYPL) is a digital payments provider serving more than 390 million consumer active accounts and 34 million merchants across more than 200 markets.
Since 2013, PayPal has achieved impressively consistent growth across all fundamental drivers of its business from user accounts to payment volume. All of this has contributed to earnings growth of 18% annually across the same period. The company has used these profits to return cash to shareholders through repurchases and to fuel growth through strategic investments.
In a theme noted in our recent analysis of Netflix Inc. (NASDAQ:NFLX), PayPal saw a boost to active users during the Covid-19 pandemic as e-commerce adoption accelerated. Amidst market exuberance, the company’s share price reached an all time high of $308.50 in July 2021. The share price has since crashed back to earth falling almost 70% to its current price of $94.50 as of 6 October 2022. Even so, we feel that it is still a bit too expensive at that level.
While the outlook for PayPal is positive, there are signs that the future may not be as strong as the past. Active users and transaction volumes continue to grow but at slower rates than in recent years, while increased transaction expenses are putting pressure on margins.
At the current price, PayPal’s operating business is valued at 24 times net income. While the company has historically traded at 35 times earnings or more, we don’t feel that it is prudent to assume this level of valuation multiple will be achieved longer-term. Even if we assume net earnings grow at 10% p.a. – 15% p.a. over the next decade, the implied annual compound returns range from 9% – 17%. At the current valuation, we feel that PayPal is trading at or near intrinsic value.
PayPal is a business with very strong fundamentals and is certainly a business we would love to own. However, as value investors, we are looking for opportunities which are at a significant discount to intrinsic value. Unfortunately, we missed it at is recently low of $67. Should it return to that level, we will have to seriously reassess our “hold” rating.
Trading Performance
PayPal generates revenue from two broad areas:
-
Transaction revenues: revenues charged to merchants and consumers on a transaction basis primarily based on the volume of activity, or Total Payment Volume, completed on their platform.
-
Value add services: revenue from other value add services such as through partnerships, subscription fees, gateway fees, and other services that they provide to merchants and customers and the interest and fees on its variety of consumer and merchant credit products.
Transaction revenues are the primary source of revenue accounting for almost 90% of revenue in FY21.
Transaction revenues
Prepared by author. Data from company reports.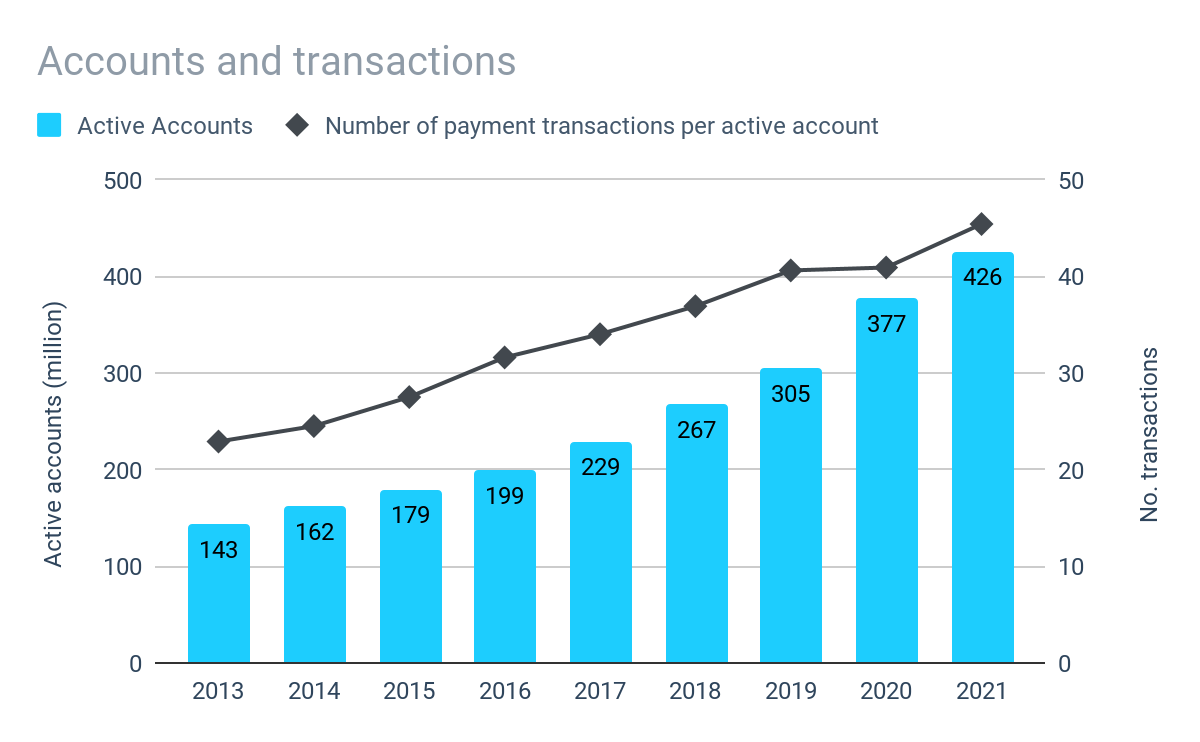
A key driver of transaction revenues is the number of active accounts and the number and value of payments made. The number of active accounts has grown from 143 million in FY13 to 426 million in FY21, equivalent to compound annual growth of 13%. At this growth rate, PayPal has been doubling its active users every 3 years.
Annual growth in user accounts has consistently been in double digits for the past decade. User growth peaked at 17% in 2017 but has gradually slowed to 13% in 2021 (with the exception of a boost to users in 2020 as a result of the pandemic). As of Q2 2022, growth in annual active accounts has slowed to as low as 6% annually.
As the number of active users has grown, so has the volume of transactions being processed on the company’s platform. In fact, the total number of transactions being completed through PayPal has outpaced the growth in active accounts as users also have used PayPal more frequently. Since 2013, the number of transactions per active account (“TPA”) has almost doubled from 23 per year to 45 per year. As of Q2 2022, this continues to grow at 12% on an annualized basis.
Prepared by author. Data from company reports.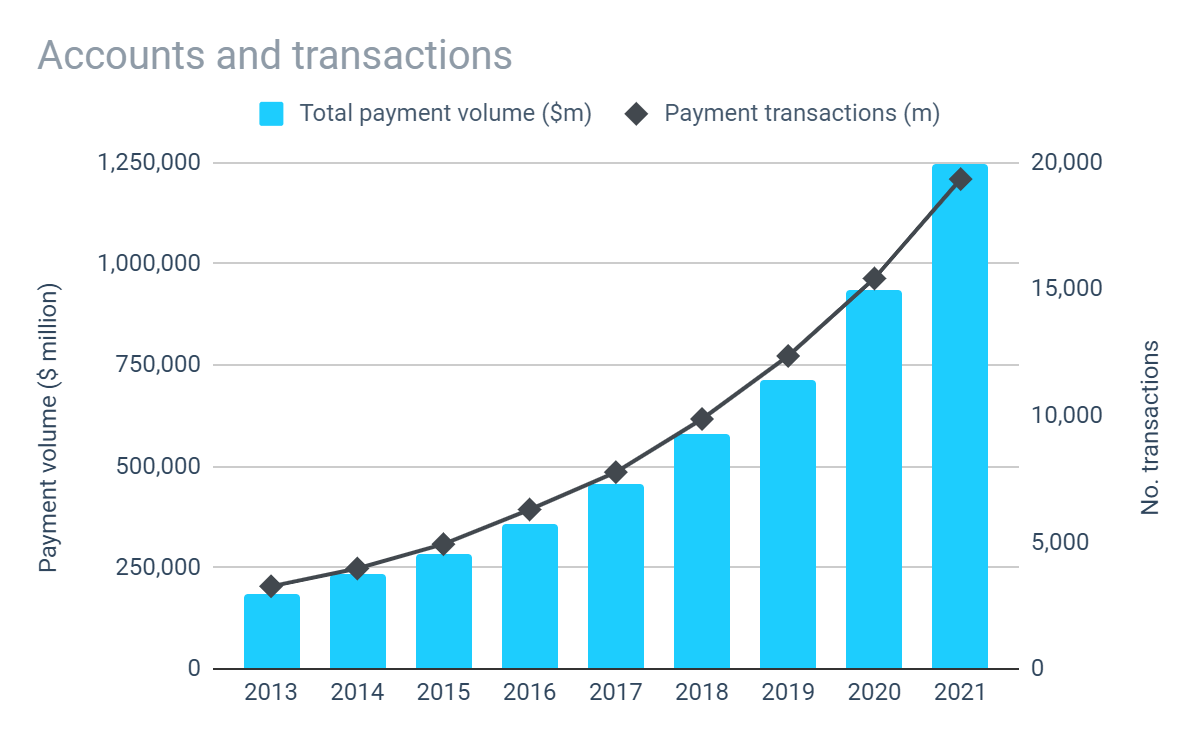
While the number of transactions completed is important, so too is the value of transactions or Total Payment Volume (“TPV”). TPV has outpaced the number of transactions as average transaction values have gradually increased from $57 in 2013 to $64 in 2021. Albeit at 1% p.a. growth, transaction value has grown at a rate below inflation.
Prepared by author. Data from company reports.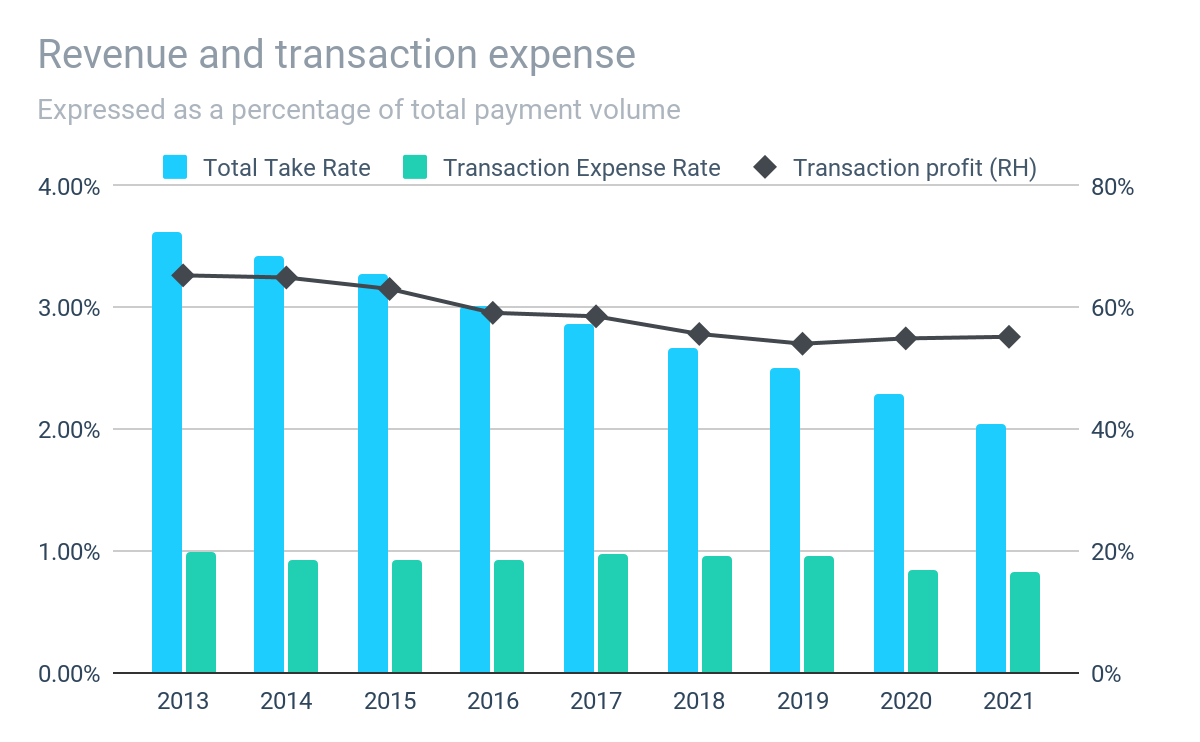
The number and value of transactions processed alone is not the only factor which influences PayPal’s financial performance. How much it can charge users and how much it pays to third-parties such as payment processors and financial institutions is key to converting transactions into profits.
PayPal generates revenue from the fees it charges users to receive payments on their platform. These fees may include a fixed and variable element. Total Take Rate (“TTR”) – which is revenue expressed as a percentage of Total Payment Volume – has been declining. For every dollar of TPV, the amount of revenue generated by PayPal has fallen by 40% from 3.6 cents in 2013 to 2.0 cents in 2021. TTR has stabilized at around 2.0 cents on the dollar in the first 6 months of FY22.
At the same time, the Transaction Expense Rate (“TER”) (the amount charged by third parties to process transactions expressed as a percentage of TPV) has also declined but by a lesser amount than TTR.
As a result, transaction margin – which measures the profitability of transactions – has declined from 65% in 2013 to 55% in 2021, a decline of 20%. This trend continues with transaction margin declining to 49% in Q2 2022.
Value-add services
Prepared by author. Data from company reports.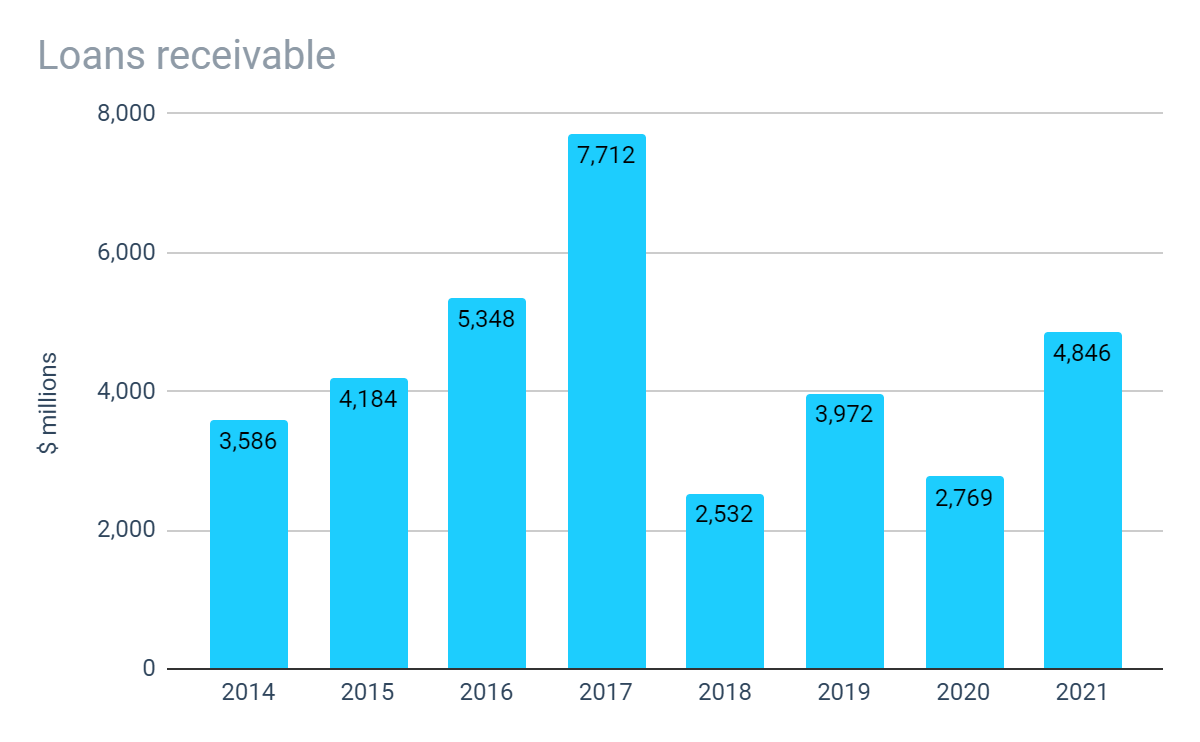
As part of its “value-add services”, PayPal offers credit services to both consumers and merchants.
To consumers, it offers a revolving credit facility in the UK and installment credit (buy now, pay later) across a number of major markets including US, Europe, Australia and Japan. These installment loans allow consumers to pay for a product over a period usually 12 months or less. Until 2018, the company also had a US consumer credit business which it sold to Synchrony Bank.
PayPal offers merchant finance products for certain small and medium-sized businesses. Merchants can borrow a certain percentage of their annual payment volume processed by PayPal and are charged a fixed fee for the loan or advance based on the overall credit assessment of the merchant. Loans and advances are repaid through a fixed percentage of the merchant’s future payment volume that PayPal processes. The company also offers more traditional small business loans with periodic repayments.
As of 31 December 2021, the company had $4.9 billion of loans and interest receivable, the majority related to its consumer credit offering. At this level it is a sizable portfolio, but in the context of its $8.9 billion of tangible equity or $4.2 billion of net income in FY21, is not at a level where we are concerned about the company’s ability to absorb the impact of a heightened level of non-performing loans in an economic downturn.
Profitability
Prepared by author. Data from company reports.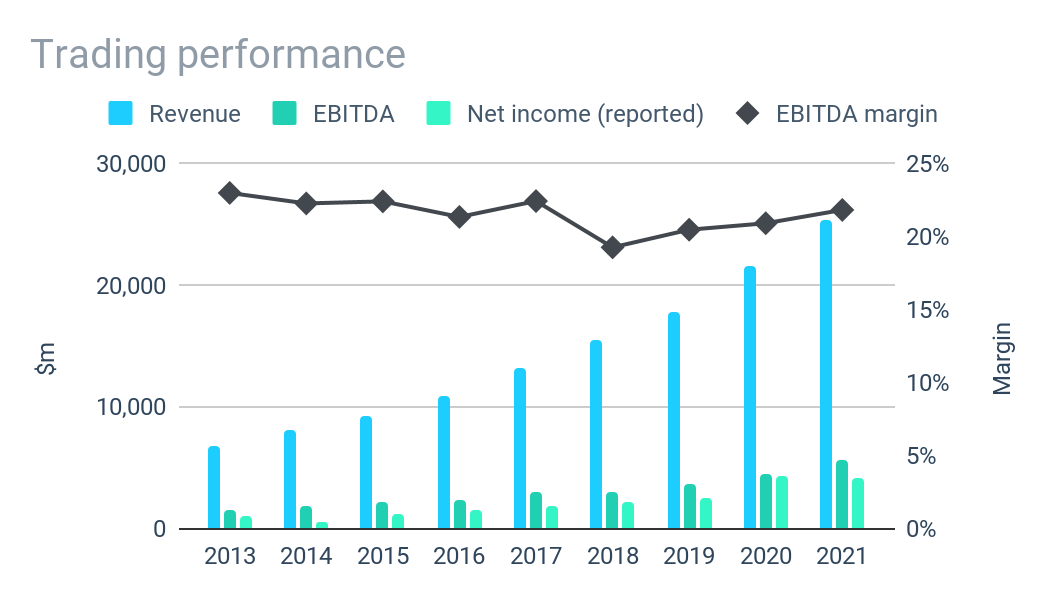
Strong growth in users and payment value has contributed to annualized top line growth of 16% in the period 2013 – 2021. However, growth has been slowing in recent years.
While transaction margins have been declining, overall operating margins have remained steady as the company has benefited from increased scale. As a result, net income has outpaced revenue growth with annualized growth of 18% since 2013.
The results for the first 6 months of 2022, indicate a further slowing of top line growth with annualized growth in the first 6 months of FY22 running at 7% – 9%, while operating margins have also declined.
Cash Flow
Prepared by author. Data from company reports.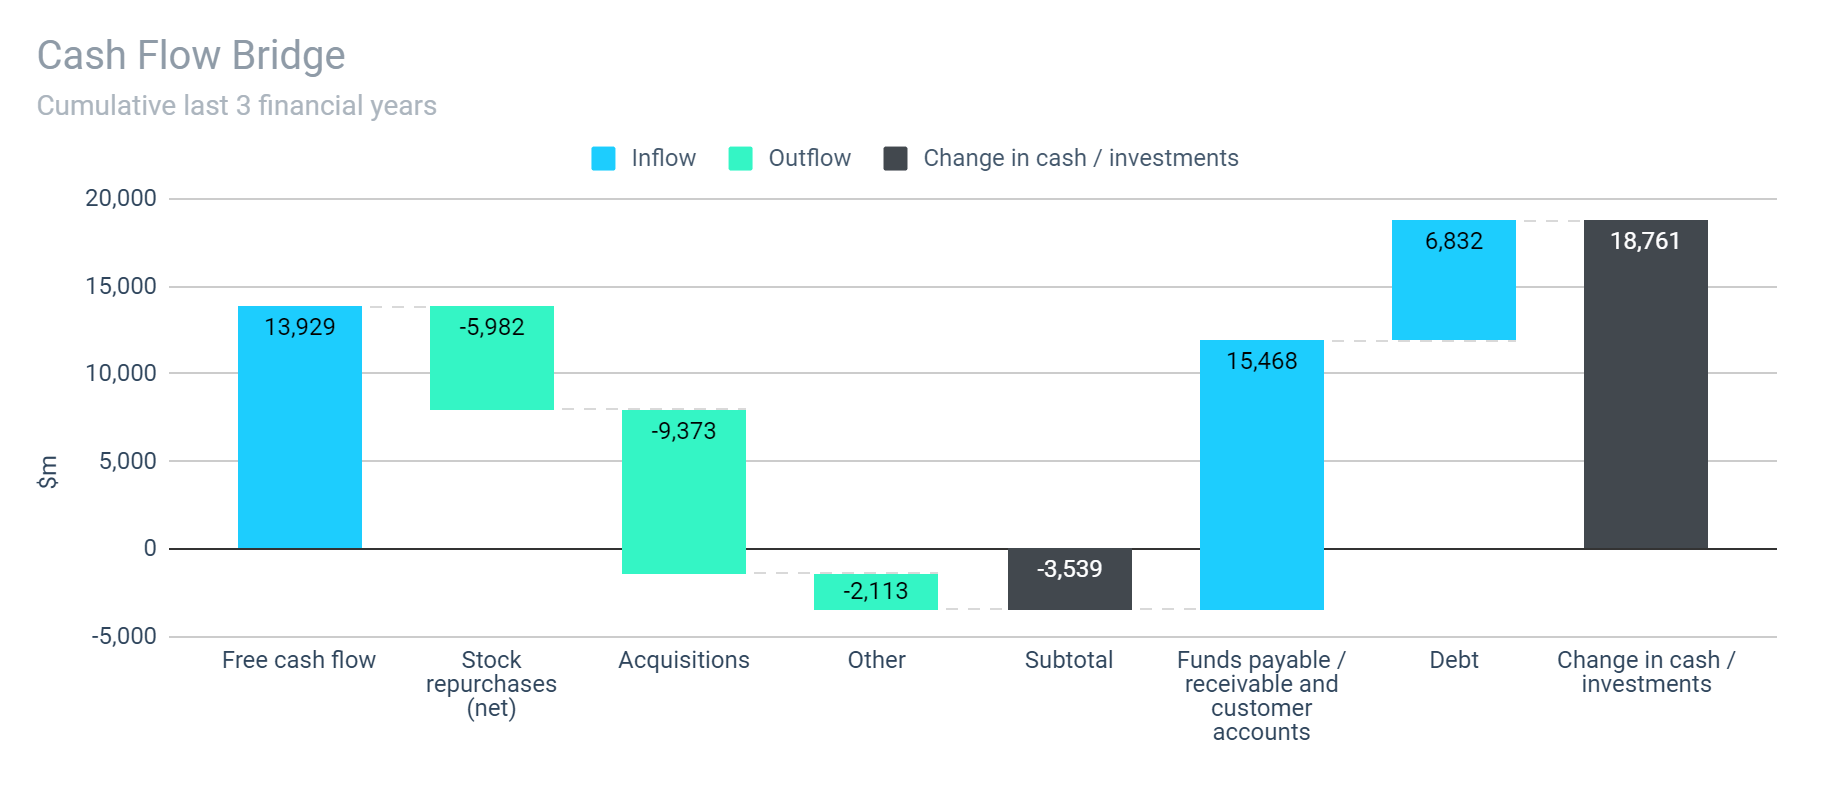
PayPal’s growth and ongoing operations require limited tangible fixed asset investment meaning effectively 100% of net income converts to free cash flow. The main use for this free cash has been stock repurchases and strategic investments.
Under existing repurchase programs, as of 30 June 2022, the company is authorized to repurchase a further $18 billion of its shares, equivalent to more than 4 years net income at FY21 levels . The company has never paid a dividend and there is no intention to do so in the foreseeable future.
Aside from repurchases, the other key use for cash has been further investment, either in the form of acquisitions or increasing the amount of loans under the company’s credit programs, with a further $2.9 billion invested in the past 3 years.
In January 2020, PayPal acquired Honey Science Corporation (“Honey”) for $4 billion almost entirely in cash. Honey is a Google chrome extension which automatically finds and applies coupons at checkout. PayPal hopes this will simplify and personalize shopping experiences for consumers while driving conversion and increasing consumer engagement and sales for merchants.
In October 2021, PayPal acquired Paidy, a two-sided payments platform that primarily provides buy now, pay later solutions (installment credit offerings) in Japan. The company paid $2.7 billion almost entirely in cash. PayPal made a further four minor acquisitions that year for a combined $542 million also funded almost entirely with cash.
The large inflow of cash from customer deposits reflects an increasing amount of cash being held in PayPal accounts by its customers. However, these are effectively liabilities of PayPal with the cash being held separately from PayPal’s own funds.
Balance Sheet
Prepared by author. Data from company reports.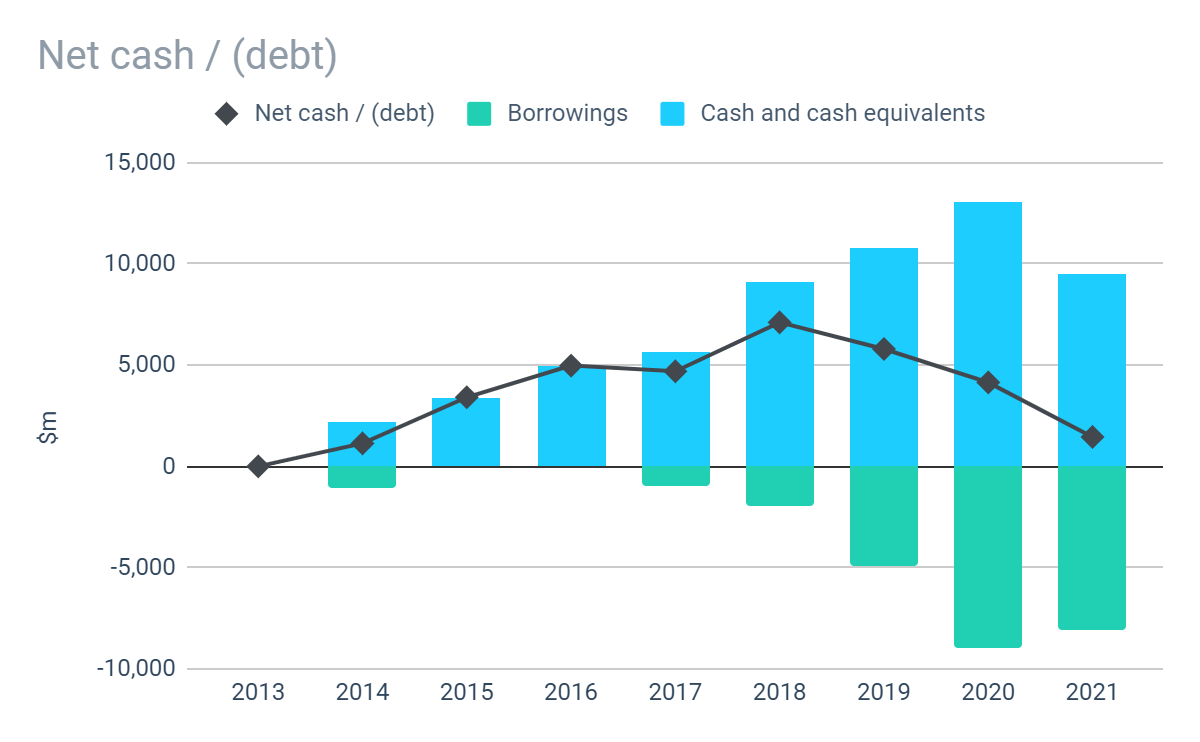
PayPal’s borrowings have increased but so has the level of cash and short term investments and net debt remains negligible. Even ignoring these cash reserves, total borrowings are equivalent to just 1.5x EBITDA at FY21 levels.
Risks
Competition
The global payments industry is highly competitive, continuously changing, highly innovative, and increasingly subject to regulatory scrutiny and oversight. The company competes with traditional payment processors as well as newer entrants from the tech sector such as Apple and Google. It is uncertain how blockchain technology will impact the payment processing industry longer term.
Economic conditions
Pressure on consumer spending could reduce transaction volume which will reduce transaction revenues and overall profitability. A recession could also impact the recover-ability of its consumer and merchant credit products resulting in write-offs.
Valuation
As of 6 October 2022, the company’s shares trade at around $94.50, giving a total market capitalization of $109 billion. Excluding cash reserves and short-term investments of $9.5 billion, this implies a valuation of $100 billion for the operating business.
Our approach to valuing operating businesses centers around determining the true underlying earnings power of the business or “owner earnings”. PayPal’s reported net income is a reasonable proxy for owner earnings. Based on FY21 net income, the operating businesses are valued at around 24 times earnings.
Rather than attempting to value the company, our analysis looks at the potential returns to investors across a number of scenarios. The assumptions used in our analysis are as follows:
| Assumptions | Lower | Mid | Upper |
| Earnings growth | 10% | 13% | 15% |
| Reinvestment rate | 60% | 40% | 20% |
| Price-to-earnings multiple | 22.0 | 22.5 | 25.0 |
| Implied compound annual return (10Y) | 9% | 13% | 17% |
Historically, net income has grown at 16% p.a., although this has slowed slightly in recent years. PayPal’s shares have historically traded at a price-to-earnings ratio in excess of 35 and as high as 50 for prolonged periods of time. However, it would not be prudent to assume these continue indefinitely, especially as interest rates rise and earnings growth slows.
Even under reasonably strong growth assumptions of 10% – 15% annually for the next decade, the implied annual returns range from as low 9% at the lower end to a more respectable 17% at the upper end.
To look at this analysis in another way, the target buy price to achieve an annual compound return of 20% under each scenario would be as follows:
| Implied target price | Lower | Mid | Upper |
| Target price | $39 | $55 | $76 |
| Versus price at valuation | -59% | -42% | -20% |
PayPal’s 52 week low of $67.60 is more than 10% below the implied target price at the upper end of our assumptions. If the valuation was to return to this level, we understand the attraction for investors to buy at that price.
Conclusion
PayPal is a fundamentally strong and attractive business with a history of consistent double digit growth in users, volume, net earnings and free cash flow. The outlook for PayPal is positive, albeit growth appears to be slowing compared with historical levels. If our rating was based purely on business fundamentals, PayPal would be a clear “buy”.
While the implied returns may be sufficient for many investors, at the current valuation we don’t feel there is sufficient margin of safety relative to required rates of return. For that reason, we rate PayPal as a “hold” rather than a “buy”… for now at least.
Be the first to comment