

Grassetto/iStock via Getty Images
As I write, the stock market has touched its June lows, and breadth is terrible. Almost 94% of all stocks are below their 20-day moving average. As you can see from the chart below, this is a rare event, a feat accomplished only once in the last 20 years, at the Pandemic lows.
Barchart.com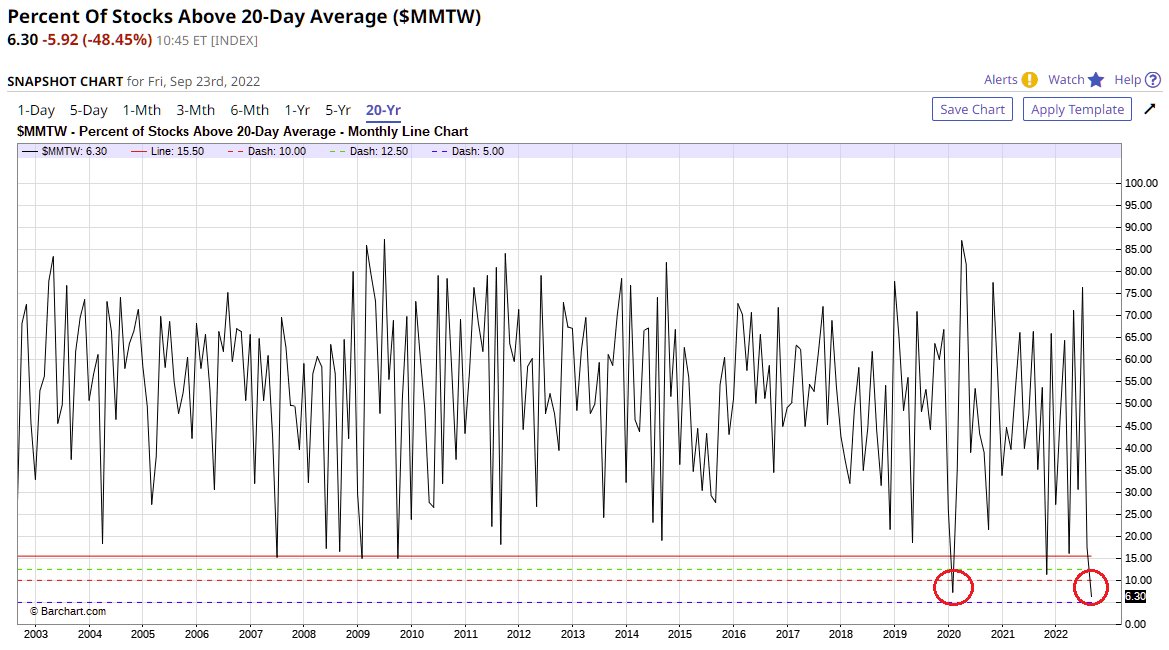
Today the S&P 500 has touched its June lows of 3662, and 97% of its 500 stocks are below their 20-day moving average. Paradoxically, a level of oversold that has preceded every turnaround of the last 5 years.
Barchart.com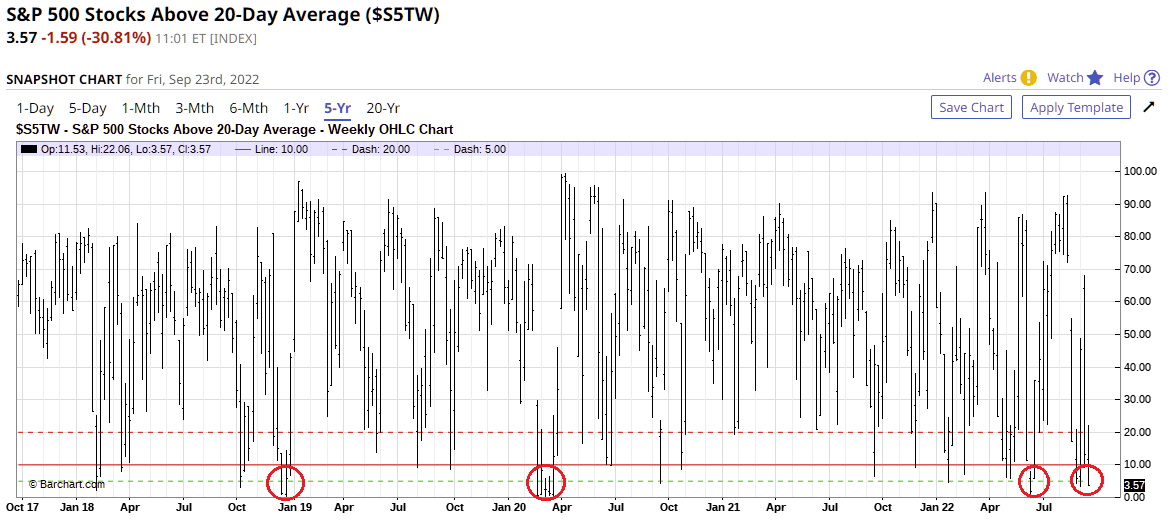
Individual investors have reached a level of bearishness exceeded only twice before in 30 years: the Financial Crisis of 2008-09 and the Oil Crisis in 1990.
Stockcharts.com
Only 5% of the Russell’s 2000 stocks are above their 20-day moving average.
Barchart.com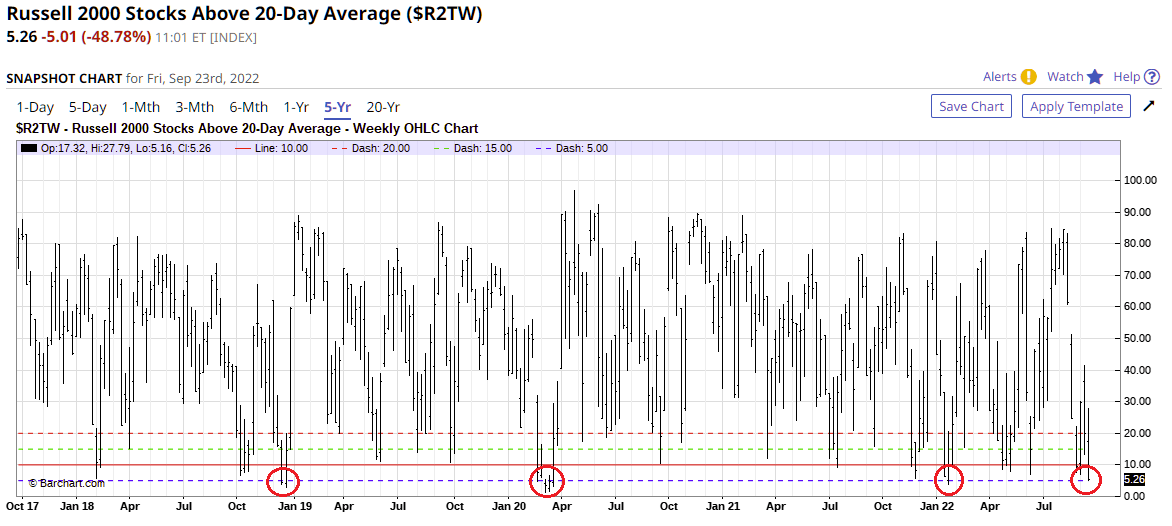
The Nasdaq Composite is equally bearish. Of its 2,500 stocks, only 5% are above their 20-day moving average.
Barchart.com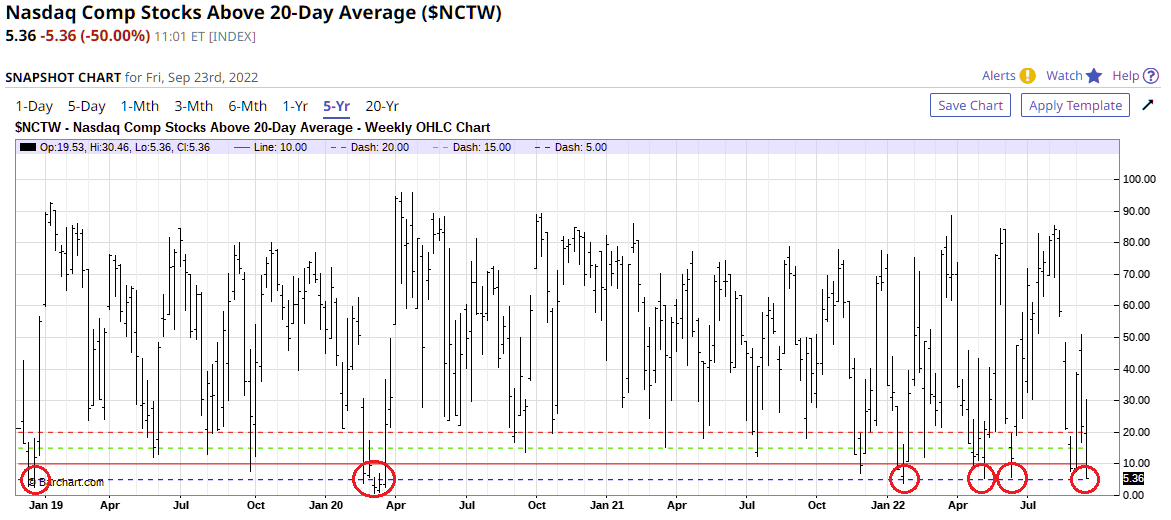
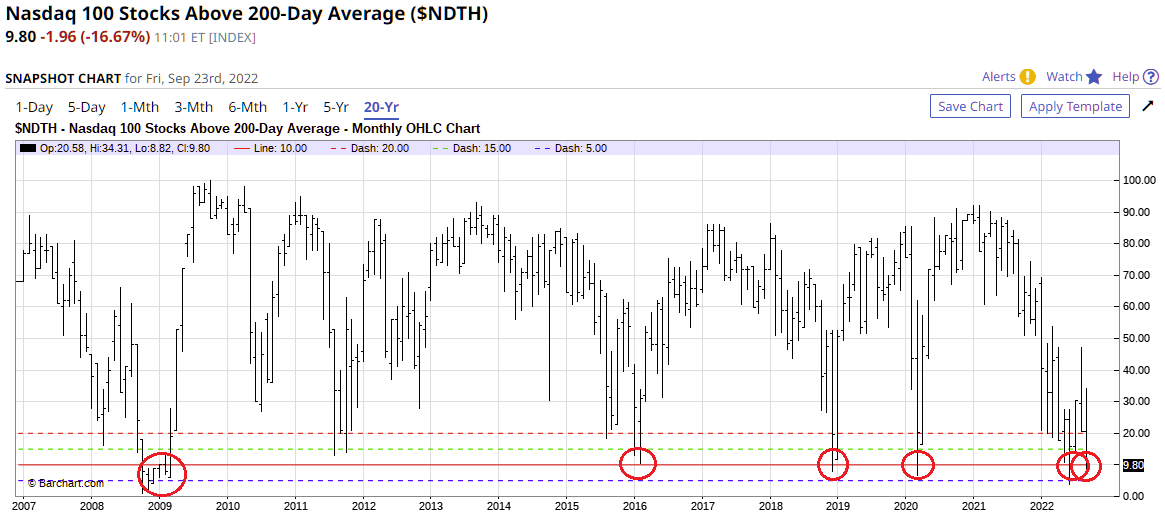
Lastly, on the Nasdaq 100, only 5% of its stocks are above their 50-day moving average and less than 10% above their 200-day moving average.
These are levels of oversold, which, although common of late for the NDX 100, are nevertheless extremely rare over the longer term, and denote panic selling in tech stocks.
Barchart.com Barchart.com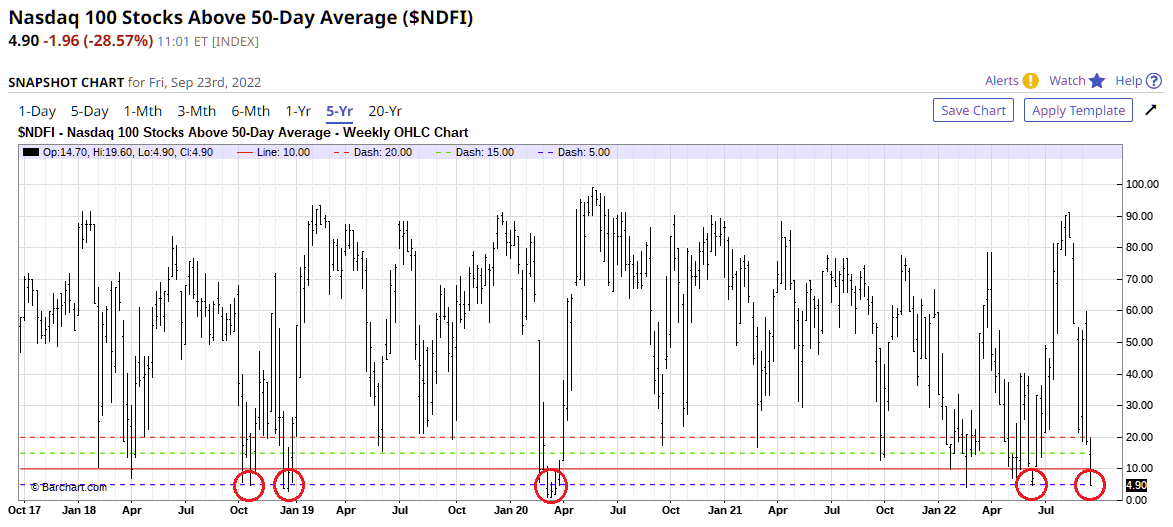
Takeaway
The art of trading and investing is measuring probabilities.
As the percentage of stocks above their 20-day moving average descends below 10%, this percentage approximates -2 standard deviations (STD) below the mean, with only a 4.4% (or less) probability of continuing.
Author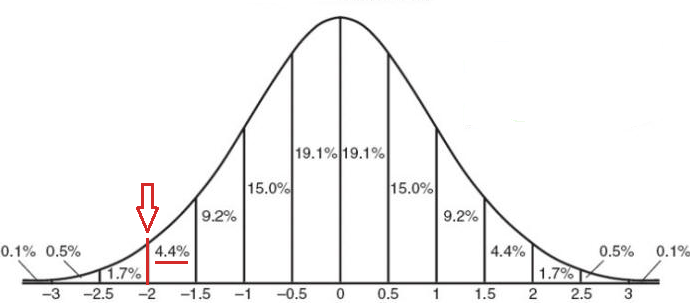
When a market reaches a level of oversold that stretches beyond -2 standard deviations and approaches even -3 standard deviations, the math says you buy that market.
Panic selling is the epitome of buying opportunities – a market – time when emotions so completely overtake a market that investors want out at any cost.
As Jason Zweig wrote (emphasis added):
The market is a pendulum that forever swings between unsustainable optimism (which makes stocks too expensive) and unjustified pessimism (which makes them too cheap). The Intelligent Investor is a realist who sells to optimists and buys from pessimists.“
What to Buy?
In the list below, there are clickable links. For each chart that you access, there is a “Compare Symbols” box wherein you can change the accompanying exchange-traded fund (“ETF”) symbol to the leverage you prefer (1x, 2x, or 3x).
According to your level of risk, all these ETFs are a high-probability buy at this point:
- The Percentage of Stocks in the Dow Industrials above their 20-day moving average, paired with the DIA (1x), or DDM (2x), or UDOW (3x)
- The Percentage of Stocks in the Nasdaq 100 above their 20-day moving average, paired with the QQQ (1x), or QLD (2x), or TQQQ (3x)
- The Percentage of Stocks in the SPX 400 above their 20-day moving average, paired with MDY (1x), or MVV (2x), or MIDU (3x)
- The Percentage of Stocks in the SPX 500 above their 20-day moving average, paired with the SPY (1x), or SSO (2x), or SPXL (3x)
- The Percentage of Stocks in the SPX 600 above their 20-day moving average, paired with the IWM (1x), or UWM (2x), or TNA (3x).
Be the first to comment