

Pgiam/iStock via Getty Images
Our Investment Thesis
Is expressed in the above bullet-points, where odds for, and size of near-term capital gains are put on a comparable basis.
The dominance of Palomar Holdings, Inc. (NASDAQ:PLMR) in following the outcome of that analysis compared to investment-comparable alternatives makes reading the rest of this article worth your time and effort if you are interested in rates of near-term capital gains. Gains which are likely to be multiples of what market-index averages regularly offer.
Description of Principal Investment Subject
“Palomar Holdings, Inc., an insurance holding company, provides specialty property insurance to residential and commercial customers. The company offers personal and commercial specialty property insurance products, including residential and commercial earthquake, commercial all risk, specialty homeowners, inland marine, Hawaii hurricane, and residential flood, as well as other products, such as assumed reinsurance, commercial flood, real estate error and omission, and real estate investor products. It markets and distributes its products through retail agents, wholesale brokers, program administrators, and carrier partnerships. The company was formerly known as GC Palomar Holdings. Palomar Holdings, Inc. was incorporated in 2013 and is headquartered in La Jolla, California.” – Source: Yahoo Finance
Yahoo Finance
Alternative Investment Competitor Rewards and Risks
Figure 1
blockdesk.com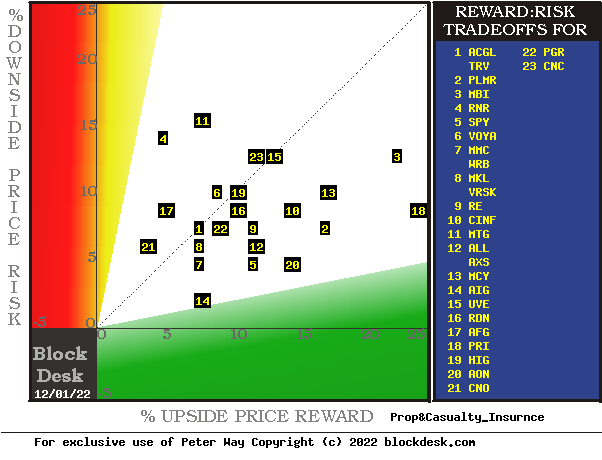
(used with permission)
Upside price rewards are from the behavioral analysis (of what to do right, not of errors) by Market-Makers [MMs] as they protect their at-risk capital from possible damaging future price moves. Their potential reward forecasts are measured by the green horizontal scale.
The risk dimension is of actual price drawdowns at their most extreme point while being held in previous pursuit of upside rewards similar to the ones currently being seen. They are measured on the red vertical scale.
Both scales are of percent change from zero to 25%. Any stock or ETF whose present risk exposure exceeds its reward prospect will be above the dotted diagonal line.
Best reward-to-risk tradeoffs are to be found at the frontier of alternatives down and to the right. As a market-index “norm” currently, the S&P500 Index ETF is at location [5]. The current “frontier” trade-off of Risk vs. Reward extends from AIG at [14] to AON at [20] and to PRI at [18]. Our present primary interest is in PLMR AT [2].
Is the added reward of PLMR worth the added risk compared to SPY at [5]? A fuller description of investing considerations should add to investors’ decisions of the suitability and credibility of the available investment alternatives. Figure 2 presents some of those considerations, drawn from outcomes of prior MM forecasts having the same up-to-down earlier expectation proportions as those of today.
Figure 2
blockdesk.com blockdesk.com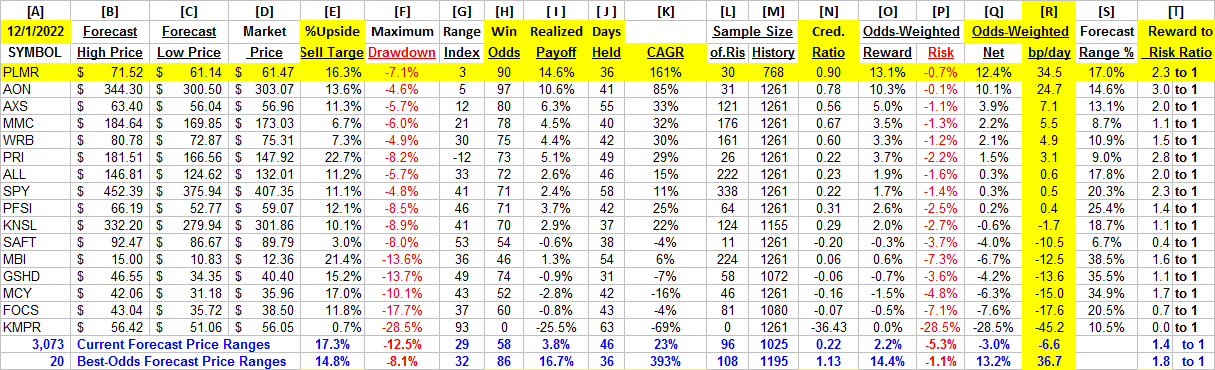
The advantage of determining Market-Maker forecasts for coming stock prices is that they offer many dimensions more than typical “street analyst” forecast of a single target-price at one point in time. Instead of only one higher (or lower) future price, the MM forecasts are drawn from market data valid across relevant (typically shorter) periods of time for both the upper and lower price limits seen as likely to be encountered in such a period.
That range of coming prices for each investment candidate is clearly split into upside and downside prospects by its today market price. We note what proportion of that whole forecast price range is between the today market quote and the low-end prospect, the downside exposure. We label that % of the range as the Range Index [RI] and note it in column [G] of Figure 2. It gets used to identify and average all prior RIs of similar size as a suitable sample of subsequent market outcomes in column [L], as a proportion of all price-range forecasts for the stock in the past 5 years of market days [M].
With those samples, scaled individually to each candidate’s relevant prior-sample outcomes, we now can make appropriate direct comparisons of answers to questions of:
How big a capital gain might be expected from this stock in the next few months? [ I ] Out of the sample, what are the Odds (how likely) that any one will be profitable? How long, on average, [J] might it take for a typical sample holding to come to a disciplined termination? In that average holding period, how bad an interim price drawdown might need (by outside circumstances) to be experienced? How credible [N] is the current upside forecast [E] compared to what history realized [ I ]? Given [E] and [F], what is the current Reward to Risk [T] ratio?
Key attention-grabbers should be column [E], the % upside price changes between [D] and [B], and (based on past forecasts like today’s) how likely those forecasts are to come about in the next 3 months: Column [H], Win Odds.
Those odds are from [L] Sample Size prior forecasts with upside-to-downside price change balances like today’s, indicated by [G] Range Indexes, where the numeric tells what % proportion of the full [B] to [C] range lies between [D] and [C].
We further take those [H] odds, and their complement, 100 – H, as weights to the price drawdown Risk experiences of the sample [L] during its various attempts to achieve the [E] rewards, as shown in [ I ]. The net of that combination, as [O] + [P] = [Q], gets put in RATE of RETURN measured in “basis points per day” [R] by [Q] / [J], where a basis point = 1/100th of a percent. In other terms, a % of a %.
These [R] column measures provide a universal comparison means for the attractiveness of investment-capital, so the rows of Figure 2 are all ranked, with PLMR at the top rank.
Given that we are posed with a decision under the inevitable uncertainty of the future, no collection of answers or actual outcomes can be expected to prove perfection. But on balance they should help investors to tailor their candidate choices to best address the degree to which the data leads to their most satisfying outcomes, most of the time.
Where the objective is to find from the candidates in Figure 2 the biggest, quickest, most likely capital gain in the next 3 months with the least interim price drawdown distress, it appears that the logical choice is with PLMR.
Recent Trends in PLMR Price-Range Forecasts
Figure 3
blockdesk.com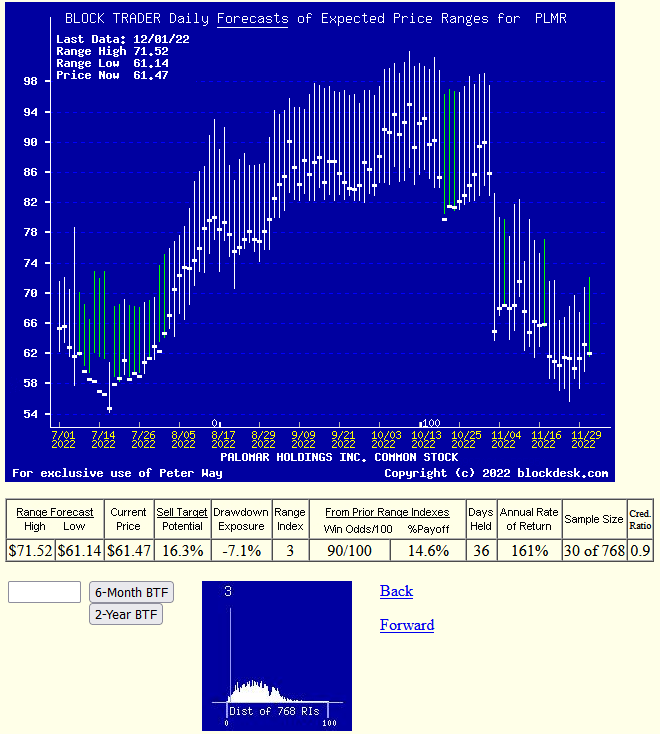
used with prior permission
With odds for a profitable experience of 9 out of every 10 available and prior experience holdings of less than 2 months (of 21 market days each) the prospect of strong triple-digit gain rates is powerful in comparison with other insurance industry investment alternatives and is competitive when compared with averages of the best 20 of a large price-forecast population.
Conclusion
Comparing these investment candidates to choose the best near-term capital gain prospect, Palomar Holdings, Inc. appears to be far better suited than all the others.
Be the first to comment