

metamorworks
INVESTMENT PERFORMANCE (%) as of September 30, 2022
Performance data quoted represents past performance; past performance does not guarantee future results. The investment return and principal value of an investment will fluctuate so that an investor’s shares, when redeemed, may be worth more or less than their original cost. Current performance of the Fund may be higher or lower than the performance quoted. Performance of the Fund current to the most recent quarter- end can be obtained by calling 904-747-2345. As of the most recent prospectus, the Fund’s gross expense ratio is 1.83% and the net expense ratio is 1.30%. Palm Valley Capital Management has contractually agreed to waive its management fees and reimburse Fund operating expenses through at least April 30, 2023. |
|||||||||||||||||||||||||||||||||||
Goldilocks or Bust
We’ve been going back and forth for a century
I want to steer markets (Keynes)
I want them set free (Hayek)
There’s a boom and bust cycle, and good reason to fear it Blame low interest rates (Hayek)
No…It’s the animal spirits. (Keynes)
“Fear the Boom and Bust: Keynes vs. Hayek – The Original Economics Rap Battle”
Dear Fellow Shareholders,
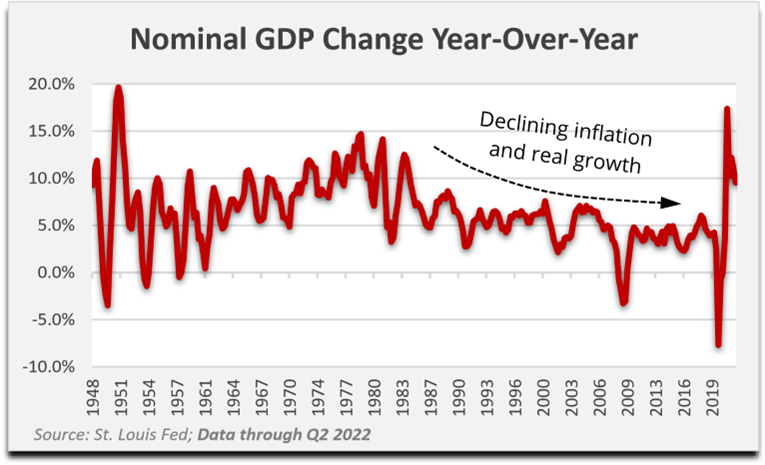
This year has been taxing for most investors. Ramping inflation finally caused the Federal Reserve to begin reversing its ultra-loose monetary policy, which smacked stocks and bonds lower. Higher interest rates are severely pressuring the housing sector and leveraged borrowers and threatening to send the economy into an unambiguous contraction.

Wall Street is consumed with predictions on when the Fed will pivot from its hawkish stance, which has been forced by persistently high inflation, and whether this adjustment will come soon enough to avoid economic carnage. On the other hand, a premature pivot before excessive inflation is extinguished could be disastrous for the portion of the country that suffers most from rising prices. Oh Goldilocks, where have you gone, and will you be returning?
A Goldilocks economy is neither too hot nor cold but sustains moderate economic growth and low inflation, which allows a “market-friendly” monetary policy (Wikipedia). Market-friendly indeed. Through the January 3, 2022, peak, the S&P 500 rose 2,947% since Alan Greenspan became Fed Chairman on August 11, 1987 (10.44% annualized). Investors were treated to long stretches of moderate (but structurally declining) economic growth and low inflation, interspersed with sharp but short recessions (2002, 2008, 2020).
The Fed said they cracked the code on eliminating the business cycle. Downturns were combatted and truncated with an evolving battery of monetary weapons. Low rates rained good fortune on asset owners. The policies appeared to be working. Appeared to be. Investors were spoiled.
Who would root against never ending prosperity? Only the envious, the bears, and the malcontents. They said it could not continue. They said printing money was dangerous and inequitable to the unmoneyed.
They said debt fueled expansions were unfair to future generations. Nonsense, they were told. Live in the moment. Don’t fight the Fed. Then COVID happened, and the stimulus was piled on. Avarice coursed through financial markets. That round of incredible deficit spending was the straw that finally broke the deflationary camel’s back. Inflation went up and up, and interest rates, which propelled asset prices for decades, have transformed from catalyst to headwind.
A positive yield feels very unnatural to many of today’s equity investors, and unsurprisingly, a large proportion of them are clamoring for a cessation of the Fed’s hostilities toward their portfolios. Their market expectations have been warped by recent experience. One of the most obnoxious phrases in the financial lexicon these days is “policy mistake.” In other words, the Fed could be blundering by tightening conditions too much in a softening economy.
There were few mentions of an opposite policy error when interest rates were zero, QE was consistently astronomical, asset prices were levitating in unison, and the U.S. economy was thundering along.
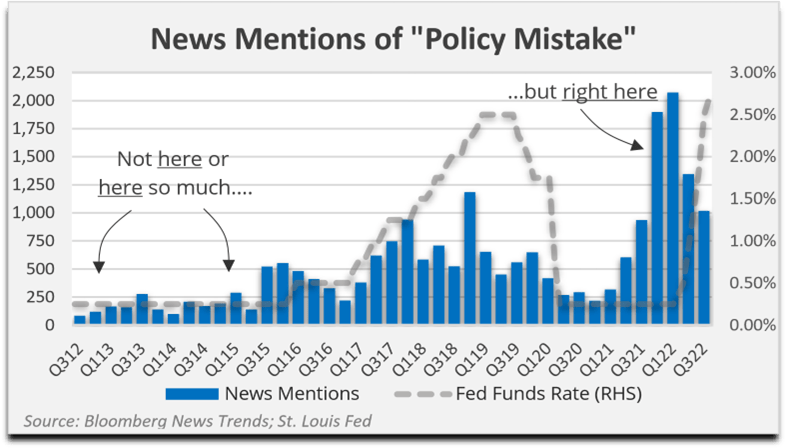
Unfortunately, the standard by which many pundits judge the Fed’s actions is based on their short-term impact to GDP and stocks as opposed to long run, more consequential implications. Namely, the Fed’s entrenched zero interest rate policy created a powder keg of speculative conditions and enabled an unsustainable accumulation of debt to control the business cycle.
Will rising rates now trigger a down-for-the-count economic freefall? Or, do we safely saunter back to a “just right” economy as inflation subsides and asset prices recover, forestalling any comeuppance for monetary and fiscal excesses? They want to steer markets; we want them set free.
Despite a strong job market, inflation is weighing heavily on lower income segments of the population. The cost of necessities such as food, rent, and utilities have surged, outpacing wage gains. Gas prices are down from the summer highs but remain well above pre-pandemic levels. The average car payment has soared. Credit card debt is swelling even as borrowing rates are at record levels. Lower income consumers are significantly curtailing discretionary purchases.
Signet (SIG – Kay Jewelers, Zales) reported a steep decline in jewelry priced under $500. Stretched consumers are shifting toward used merchandise. Sales at secondhand retailer Winmark (WINA – Plato’s Closet, Once Upon a Child) rose briskly in the second quarter, while new clothing retailer Children’s Place (PLCE) reported a drop in revenue blamed on “an inflation-driven consumer slowdown.”
In August, The Wall Street Journal reported that the U.S. market for secondhand clothing and footwear is projected to grow 23% in 2022 (thredUP/GlobalData). U.S. pawn loans outstanding at EZCORP (EZPW – EZPAWN, Value Pawn) jumped 36% year-over-year for the June quarter, with a similar increase reported for competitor FirstCash Holdings (FCFS – Cash America, First Cash Pawn). Given broad evidence of the harmful effects of spiking prices, the Fed has pledged to continue raising interest rates until inflation returns to a 2% trend.
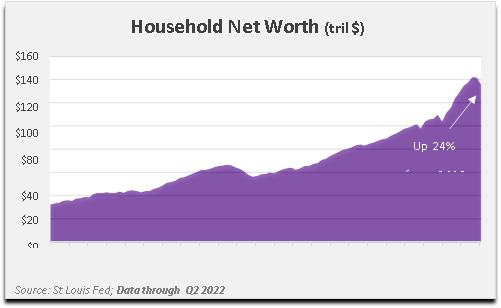
Whether or not the Fed pivots soon or pivots later is not going to change how we invest. However, it might alter when we invest, since it could affect the timing of when stock prices meet our absolute return hurdles. We do not believe this Fed will allow asset prices to slide too far without intervening. It’s relatively easy for them to be hawkish when unemployment is near 50-year lows and they have bubbles to spare, with household net worth still up sharply from before the pandemic.
However, if the economic rot metastasizes to seriously drag down upper income balance sheets, we expect a rapid return to easy money. In the near-term, this may also appear to be the right prescription to help poorer consumers, since it will support employment.
Nevertheless, this would be tantamount to applying another flimsy band-aid to a gaping wound—the debt and manifold distortions permeating our economy. Frederic Bastiat wrote in 1850, “The bad economist pursues a small present good, which will be followed by a great evil to come, while the true economist pursues a great good to come—at the risk of a small present evil” (That Which Is Seen, and That Which Is Not Seen). We don’t wish misfortune on anyone, but stealing from future generations is bad economic policy, and just plain wrong, in our opinion.
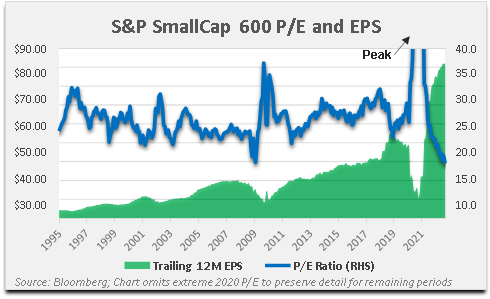
The Russell 2000 Index of U.S. small caps is now down 32% from its all-time high, while the S&P SmallCap 600 Index has fallen 27% from its peak. Corporate profitability surged since the pandemic. As a result, the S&P SmallCap 600 P/E is a very palatable 13x. While the unadulterated Russell 2000 P/E is still 40x, if you remove the 40% of index members that are unprofitable, the moneymakers have a collective P/E of only10x.
The combination of falling stock prices and attractive small cap multiples appears to present a powerful case for buying aggressively. We do not share this view.
While stocks are down, they fell from the equivalent of the Mytikas Peak above the clouds on Mount Olympus. The small cap bull market gains were heroic in scale, and as a result, we expect the bear market that follows would be comparably noteworthy. Additionally, today’s valuation multiples require meaningful context. The SmallCap 600 is trading at a 13x aggregate P/E, but the median firm P/E is 17x. Getting colder… The median non-financial is 18x. Colder still…
We believe the most important takeaway when assessing earnings multiples today is that profitability may be far above typical levels. Index earnings per share have increased 118% from 2019 (SmallCap 600). The median net margin for profitable small caps is nearly the highest on record (8.7%), spiking after the 2018 corporate tax cuts and expanding further during the overstimulated 2021 economy.
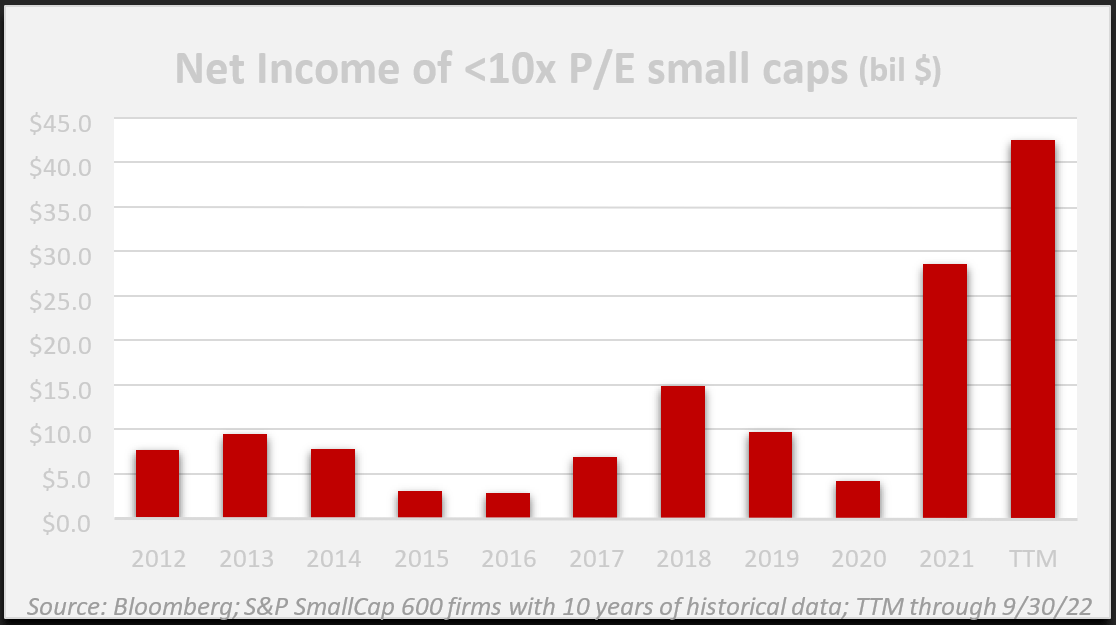
We separately analyzed SmallCap 600 members trading at a P/E lower than 10x, which currently represent 30% of the index membership (23% for Russell 2000). The collective net income of these businesses grew 379% from 2019 to present (+239% median growth). Valuing these companies strictly based on what they earned over the past year could lead to excessive price targets.
This is why we normalize results.
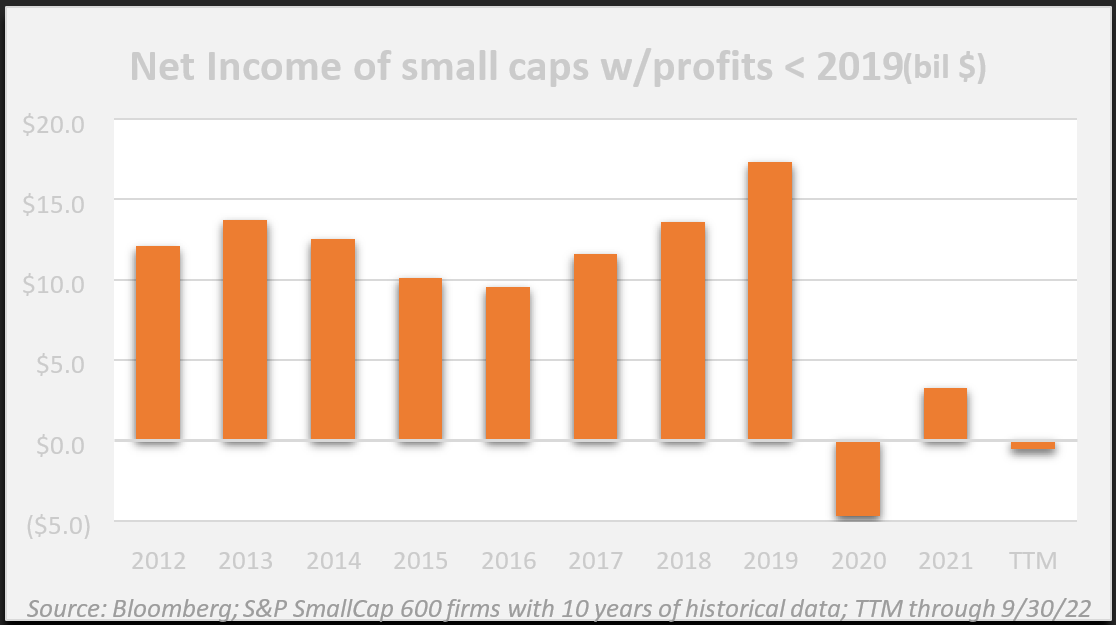
Perhaps surprisingly, more than one-third of SmallCap 600 members earned lower profits over the trailing twelve months compared to 2019. The broad group includes everything from fading companies like Bed Bath & Beyond (BBBY) and Cinemark (CNK) to survivors experiencing profit pressure, like Itron (ITRI – smart meters) and UniFirst (UNF – uniforms). Their collective profits, which were notably more stable than the sub 10x P/E group before 2019, plunged to losses in 2020.
This is why we normalize.
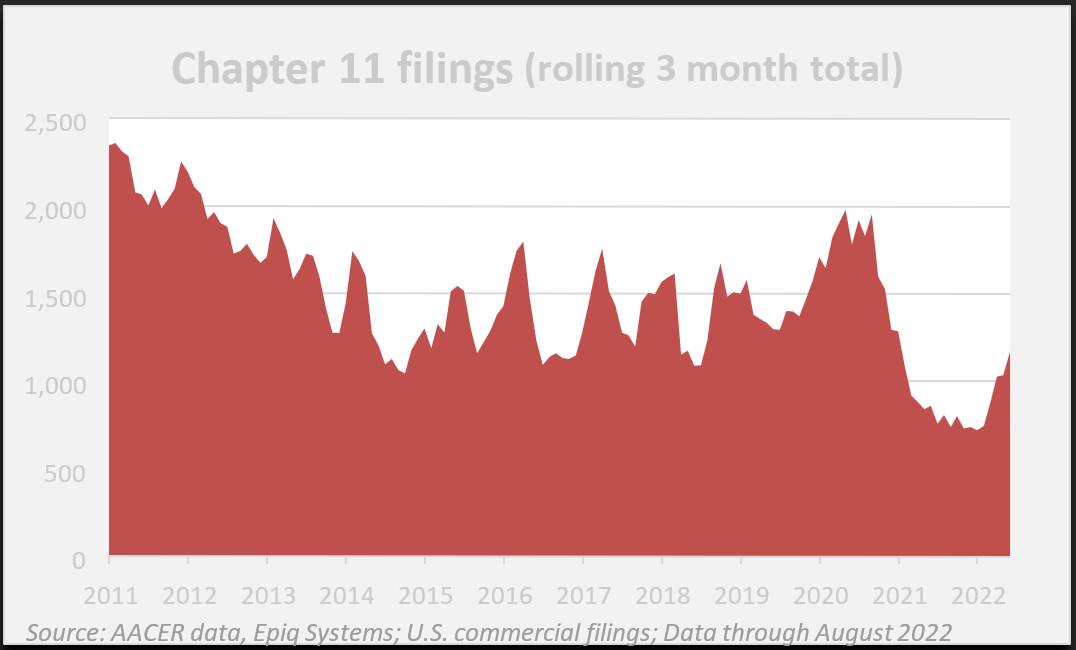
Many public companies benefited from FIFO inventory accounting and historical depreciation rates during the initial inflationary upswing, but their income statements should begin to reflect what their cash flows are already sniffing out. Small cap borrowings are growing quickly in 2022, and commercial bankruptcy filings have begun to perk up after a historic lull.
For small companies with positive net debt, leverage has increased by 25% (median) since the end of 2019.
The fastest debt growth has been in the Consumer Staples and Materials sectors, while the Energy sector has deleveraged most over this span. We have noticed that, in many cases, the companies we follow most closely have exhibited a worse-than-average balance sheet trajectory during this business cycle.
We seek out seasoned, cash- generative enterprises, and these are easier to lever up. This currently makes our strategy more difficult to implement, as there are fewer clean balance sheets to buy. Nevertheless, we will purchase firms with moderate amounts of debt if there is consistent cash flow and a deleveraging plan in place. We believe debt reduction is a much more reliable catalyst for value accretion than acquisitions.
We usually limit our investments to firms where free cash flow can pay off net borrowings within five years, or three years for more cyclical businesses. This rules out about half of today’s profitable small caps. Net debt to free cash flow for the SmallCap 600’s total membership is over 8x. Investors understand that free cash flow is customarily more volatile than reported earnings, but it is ultimately the true source of value for most businesses. Small cap free cash flows are generally falling in 2022 after reaching record levels during the lockdown-fueled working capital drawdowns of 2020.
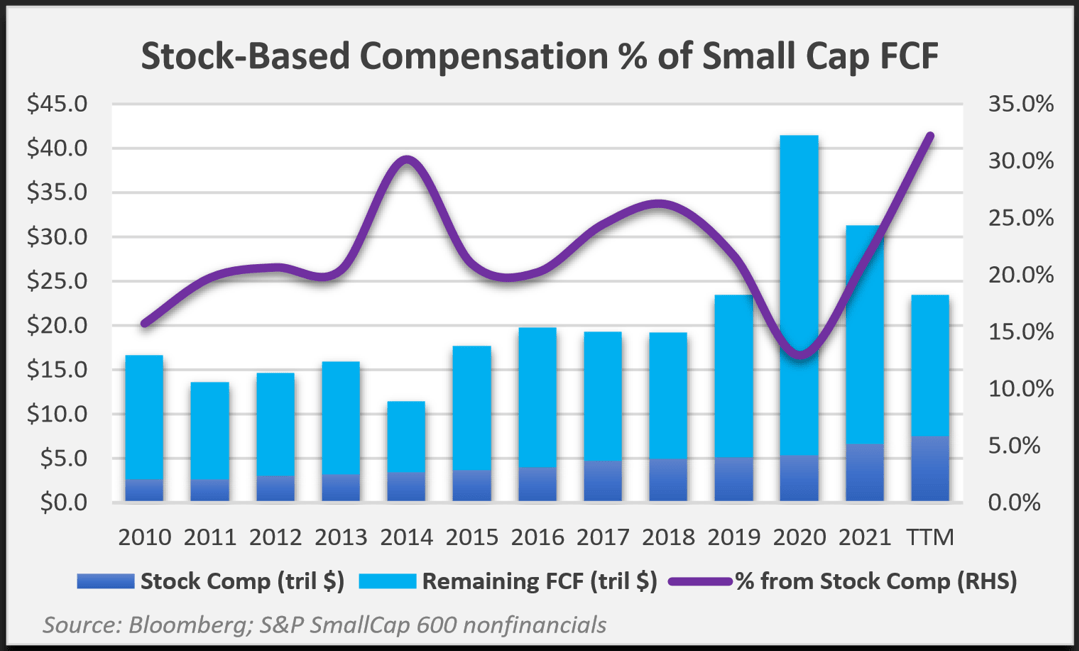
Non-cash share-based compensation accounts for roughly one-third of the collective free cash flow of small caps in the S&P 600 Index.
This is a low-quality source of cash flow. If you’re a creditor, you might not care. If you’re a stockholder, you most certainly should, since you’ll be sharing any future dividends with management.
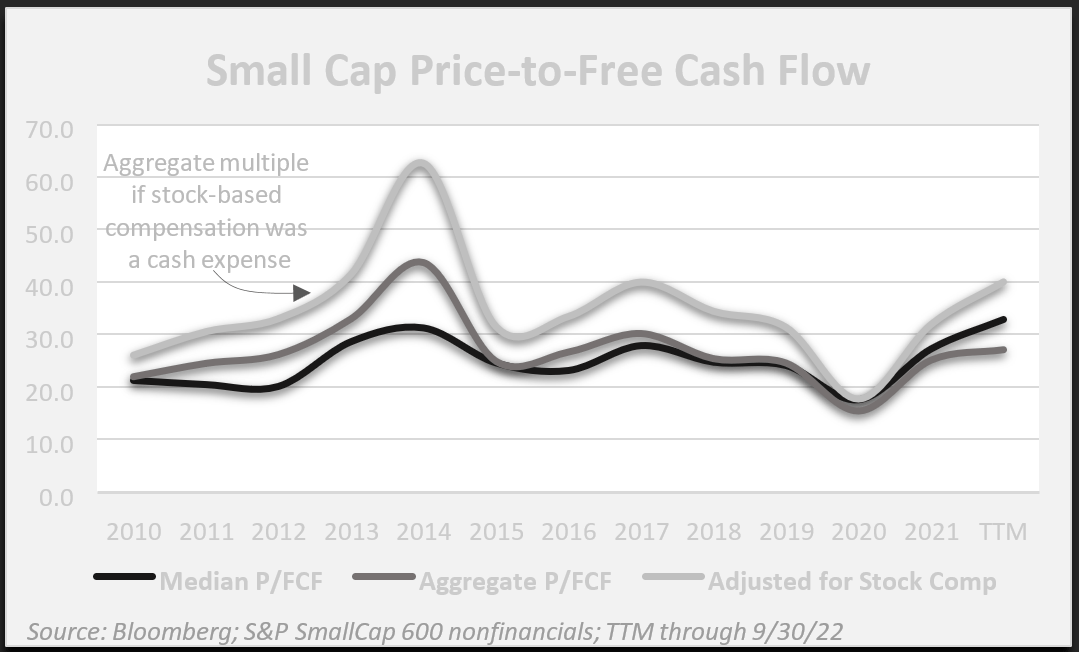
Since share awards are a form of employee compensation, they typically grow annually, even if the business does not.
The current 33x median price-to-free cash flow multiple for better quality small caps (S&P 600) is the highest this cycle.
The aggregate Index multiple was higher in 2014 due to horrendous results for energy companies that year. Admittedly, annual comparisons for small cap benchmarks can be messy because of high index turnover. Small firms are more prone to takeovers, bankruptcies, growing to mid-cap status, or fading into insignificance.
Nonetheless, after looking under the hood of small cap indexes, we still do not see extensive valuation distress.
The Palm Valley Capital Fund declined 1.83% during the third quarter ending September 30, 2022. In comparison, the S&P SmallCap 600 Index fell 5.20% and the Morningstar Small Cap Index dropped 3.75%. The securities within the Fund decreased 8.66% during the period. Year-to-date, the Fund declined 0.67% versus a 23.16% fall for the S&P SmallCap 600 and a drop of 24.55% for the Morningstar Small Cap Index.
|
Top 10 Holdings (9/30/22) |
% Assets |
|
Sprott Physical Silver Trust (PSLV) |
3.42% |
|
2.45% |
|
|
Sprott Physical Gold Trust (PHYS) |
2.14% |
|
WH Group (OTCPK:WHGLY) |
1.73% |
|
Osisko Gold Royalties (OR) |
1.39% |
|
Amdocs (DOX) |
1.38% |
|
Alamos Gold (AGI) |
1.36% |
|
Natural Gas Services (NGS) |
1.33% |
|
Miller Industries (MLR) |
1.21% |
|
Kelly Services (KELYA) |
1.00% |
The Fund’s cash and equivalents position ended the quarter at 76.6%. The level of cash increased slightly from the end of the second quarter, which was mainly due to price declines for our holdings that were not fully offset by our additional investments in certain of these positions.
For Palm Valley, most small caps are presently held in abeyance—valuations have improved for buyers but are still not broadly attractive when normalizing cash flows. Most stock prices require further drawdowns to qualify as depressed, in our opinion. Nevertheless, in a general sense, we are 30% closer to opportunities than we were at the beginning of the year, and much more in specific cases.
We acquired four new positions during the quarter—two of these were recycled. The Fund bought back Kelly Services, a prior holding, and established a new weighting in ManpowerGroup (MAN). Both companies serve the staffing industry. Staffing is cyclical, and we expect results for these companies to deteriorate in a recession, even though margins haven’t fully recovered yet from the lockdowns. In our judgment, during previous downturns, their operating performance was acceptable for a cyclical trough. We believe the valuations for Kelly and Manpower are becoming increasingly compelling.
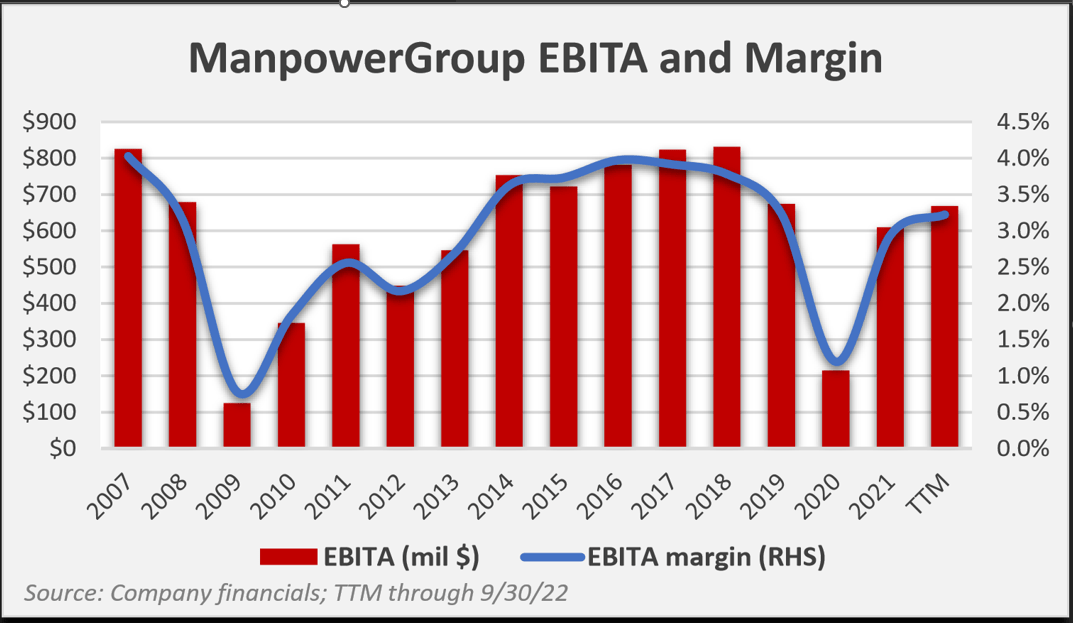
Kelly trades at a 46% discount to tangible book value. The company’s net assets are primarily supported by a mountain of receivables. Neither Kelly nor Manpower experienced significant credit losses during the last recession. ManpowerGroup’s $4 billion Enterprise Value is 6.7x its five-year average operating income before amortization, which includes a trough in 2020. Manpower is based in the U.S., but it earns the majority of revenues from Europe.
We think the firm’s European exposure has placed it in the doghouse among investors, given the unique risks facing those economies. Manpower’s translated results are also weighed down by the rocketing U.S. dollar.
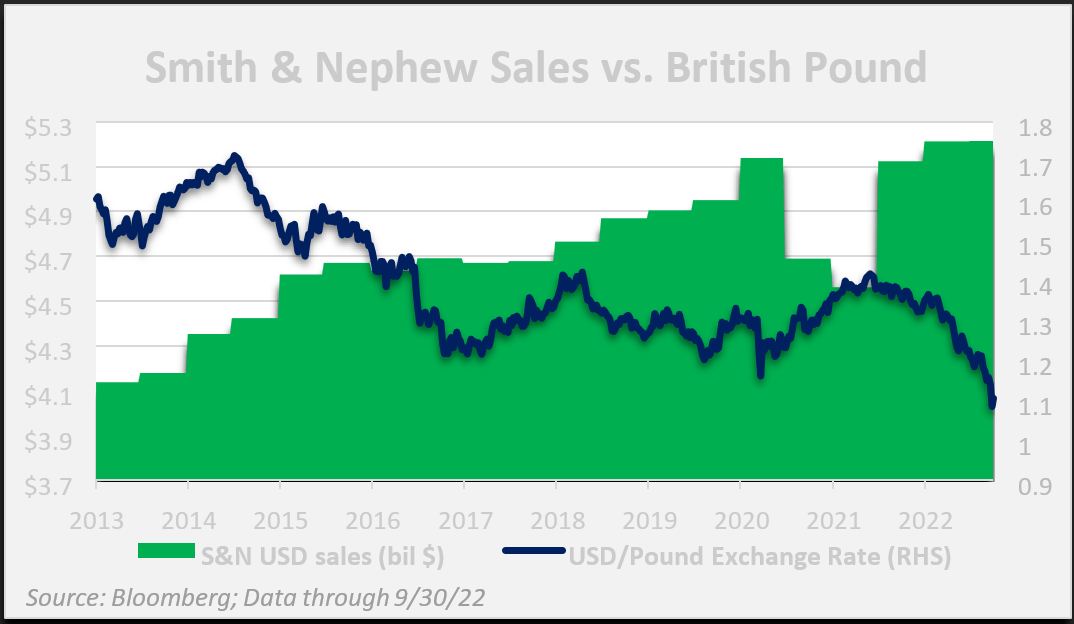
We bought Smith & Nephew plc (SNN) toward the end of the quarter. Smith & Nephew is a London- based medical device company that specializes in knee and hip replacements, sports medicine, and wound management. We purchased the ADR, which has declined meaningfully (-31% year-to-date) along with the British pound. While Smith & Nephew’s stock is priced in pounds, its revenues are in other major currencies, such as the dollar, euro, and yen.
In 2021, 51% of its revenues were generated in the United States, while 31% were in other developed markets. We believe Smith & Nephew is a high-quality business that generates above average profit margins and abundant free cash flow. We were pleased the turmoil in the British pound provided us with the opportunity to purchase its shares at a discount to our calculated valuation.
We also purchased SSR Mining (SSRM) during the quarter. SSR Mining is a precious metals mining company that we previously sold in November 2021 after it reached our valuation. SSR Mining’s stock has fallen significantly this year due to lower precious metal prices and the temporary closure of its Copler mine. We repurchased its shares in late September after the Copler mine restarted on schedule, since the stock remained depressed.
SSR Mining should generate significant free cash flow at current gold and silver prices and has a very strong balance sheet with over $600 million in net cash and $4.1 billion in stockholders’ equity. While we expect the stock to remain volatile, we believe the company is selling at an attractive price relative to its asset-heavy balance sheet and our net asset valuation.
SSR Mining’s Copler Mine
The Fund exited its stake in Preformed Line Products (PLPC) during the third quarter after the shares exceeded our intrinsic value estimate. During the second quarter, PLP’s currency neutral sales jumped 27%, with a 41% gain in operating profit. The business is historically cyclical, and we believe we could be selling near peak operating performance.
The three positions that had the greatest negative impact on the Fund during the third quarter were Crawford & Company, WH Group, and Oil Dri (ODC).
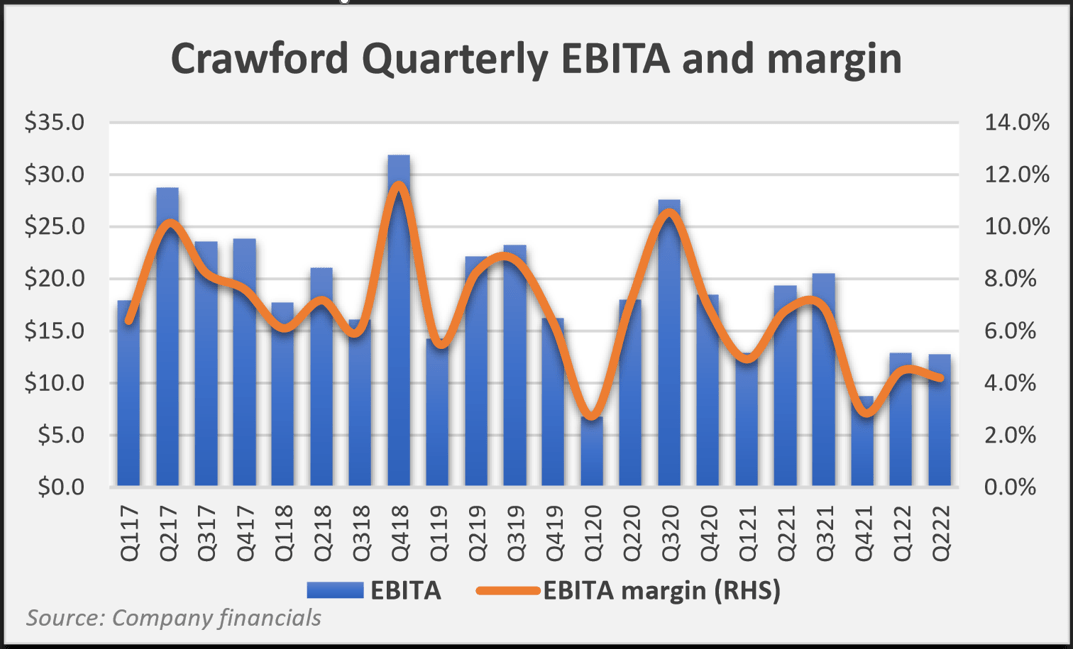
Crawford, the claims management provider, has weighed on the portfolio since we reentered the position a couple years ago. It is a controlled company. Extreme weather can boost Crawford’s results, since the firm possesses a large and capable army of claims adjusters. In our opinion, management has been overly focused on driving revenue growth instead of maximizing profitability. Second quarter sales for Crawford were up 10%, but operating profit declined by a third from the prior year.
The firm’s international operations have delivered unsatisfactory results for eighteen months, but even the company’s high margin Contractor Connection repair network business stumbled in Q2. Due to acquisition-driven debt growth and declining liquidity for the holding relative to the growing size of the Fund, we have limited our recent purchases. Yet, we believe Crawford trades at a meaningful discount to fair value—perhaps the largest discount in the Fund. The shares are selling for an Enterprise Value below 9x trailing operating profit, which we believe is less than normal, and for under 6x our estimate of normalized EBITA.
Although WH Group was the Fund’s second biggest detractor during the period, we would not attribute this to company-specific performance. The firm’s operating profit expanded 36% year-over-year in the quarter ending June 30th. The improvement was tied to growth in the company’s stable Packaged Meats segment and a turnaround in the performance of subsidiary Smithfield’s U.S. hog farming operations.
Smithfield’s leadership called the results “incredible” and said the company is staying ahead of inflation while seeing a recovery of foodservice demand and labor availability. Chinese hog prices are expected to be stable, given the government’s pledge to intervene, which should bode well for the firm’s packaged products sales in China. From our perspective, the ADR is clearly cheap based on cash flows and assets but must contend with volatile investor sentiment toward Hong Kong and China. Nearly 60% of WH Group’s second quarter operating income was derived from the U.S. and Europe.
Oil Dri delivered decent second quarter earnings, but margins remain below normal as the firm suffers from elevated costs for energy, packaging, and transportation. Oil-Dri has actively raised prices this year, and we expect operating margins to continue to improve through the remainder of 2022.
The Fund had two equities contributing more than 10 basis points to third quarter performance: Heartland Express (ticker: HTLD) and Preformed Line Products (ticker: PLPC). We reduced our weighting in Heartland as the shares neared fair value and the company announced a material acquisition that increased leverage.
“I was born for a storm, and a calm does not suit me.”
Andrew Jackson
As we finished writing this letter, a weakened Hurricane Ian passed by Jacksonville, our city, which was named after Andrew Jackson in 1822 when he was the military governor of the territory. Three days ago, the storm smashed into Fort Myers at a strong Category 4 intensity, causing catastrophic damage, then steamrolled across Central Florida. It would be nice to live in a world with no hurricanes, tornadoes, earthquakes, blizzards, destructive fires, wars, diseases, pandemics, accidents, or other tragedies. It would also be appealing to invest without risk. We project we’ll have neither in our lifetimes.
Market volatility is important to Palm Valley’s absolute return strategy.
If it didn’t exist, we probably wouldn’t exist. Volatility was subdued for years prior to the COVID crash because of investors’ unshakeable faith in the Fed put. This was a challenging period for absolute return investors. Recent volatility could be opening a window to better opportunities for value seekers. We expect market developments to hinge on the path of interest rates and investors’ confidence that the Fed can return us to a Goldilocks economy.

President Andrew Jackson, quote above, did not have confidence in the central bank. Jackson was tough as nails, and his life was full of strife and struggle. His father died three weeks before he was born. While a thirteen-year-old prisoner during the Revolutionary War, he refused to shine the boots of a British officer, who slashed Jackson’s face and hand to the bone. The rest of his family was dead by the time he was fourteen.
During the War of 1812, Jackson was shot in the arm but refused to have it amputated, which was the standard treatment at that time. He became a war hero and earned the nickname “Old Hickory” for his resilience. He was shot three times in duels. Once he allowed his opponent, who had insulted Jackson’s wife, to shoot him in the chest first before squaring up to aim and kill the man. His wife Rachel died shortly after he was elected President in 1828. Over the objections of Congress, Jackson shut down the Second Bank of the United States, beginning in 1833.
According to History.com: “Jackson also objected to the bank’s unusual political and economic power and to the lack of congressional oversight over its business dealings….To Jackson, the bank symbolized how a privileged class of businessmen oppressed the will of the common people of America.”
Ironically, the Treasury Department put Jackson’s face on the $20 bill in 1928. Given his disdain for paper money, President Jackson may not have been opposed to modern efforts to replace him on the currency. Protestors tried to topple Jackson’s statue in Lafayette Square in 2020, but they failed.
Jackson’s statue in Lafayette Square (Photo: White House Historical Association)
On September 28, 2022, the Bank of England (BOE) intervened to address soaring UK government bond yields by pledging unlimited QE. This was a sharp reversal from their previous plan and comes after a plunge in the value of the British pound and the announcement of tax cuts to support the economy.
At the same time, UK inflation continues to rip. It will be interesting to observe how governments attempt to navigate competing interests by restarting their monetary and fiscal engines. We are far from convinced they will succeed, but at a minimum, this announcement demonstrates that asset prices will ultimately drive the actions of central banks. The BOE may be the first “hawk” to cave, but it won’t be the last.
 Disclaimer: Fed Chairman Jerome Powell pictured on mock bill. |
Thank you for your investment.
Sincerely,
Jayme Wiggins | Eric Cinnamond
|
Mutual fund investing involves risk. Principal loss is possible. The Palm Valley Capital Fund invests in smaller sized companies, which involve additional risks such as limited liquidity and greater volatility than large capitalization companies. The ability of the Fund to meet its investment objective may be limited to the extent it holds assets in cash (or cash equivalents) or is otherwise uninvested. Before investing in the Palm Valley Capital Fund, you should carefully consider the Fund’s investment objectives, risks, charges, and expenses. The Prospectus contains this and other important information and it may be obtained by calling 904-747-2345. Please read the Prospectus carefully before investing. Past performance is no guarantee of future results. Dividends are not guaranteed and a company’s future ability to pay dividends may be limited. A company currently paying dividends may cease paying dividends at any time. Fund holdings and sector allocations are subject to change and are not a recommendation to buy or sell any security. Earnings growth for a Fund holding does not guarantee a corresponding increase in the market value of the holding or the Fund. The S&P SmallCap 600 Index measures the small cap segment of the U.S. equity market. The index is designed to track companies that meet specific inclusion criteria to ensure that they are liquid and financially viable. The Morningstar Small Cap Total Return Index tracks the performance of U.S. small-cap stocks that fall between 90th and 97th percentile in market capitalization of the investable universe. It is not possible to invest directly in an index. The Palm Valley Capital Fund is distributed by Quasar Distributors, LLC. Opinions expressed are those of the author, are subject to change at any time, are not guaranteed and should not be considered investment advice. Definitions: ADR: A tradeable certificate issued by a U.S. bank representing shares of a foreign company’s stock. Basis point: One hundredth of a percentage point (0.01%). CBOE Volatility Index (VIX): A popular measure of the stock market’s expectation of volatility based on S&P 500 Index options. Controlled company: A business for which more than 50% of voting power is held by a single person or group. EBITA: Earnings Before Interest, Taxes, and Amortization of acquired intangibles (i.e., operating income). Enterprise Value: Market Cap plus total debt minus cash equivalents, adjusting for noncontrolling interests. EPS (Earnings per share): Net income divided by shares outstanding. Federal Funds Rate: The interest rate that banks charge each other for lending money on an overnight basis. Fed put: A belief that the Federal Reserve will always rescue the financial markets. FIFO (First-In-First-Out): Inventory valuation assumption that the first goods purchased are the first goods sold. Free Cash Flow: Free Cash Flow equals Cash from Operating Activities minus Capital Expenditures. Net assets: A company’s total assets minus total liabilities. Net Debt: A company’s total debt minus cash and equivalents. Nominal GDP: Nominal Gross Domestic Product is the total value of goods produced and services provided in a country during one year and includes current prices in its calculation. P/E Ratio: A stock’s price divided by its earnings per share. Price/Free Cash Flow: Market Capitalization divided by Free Cash Flow. Quantitative Easing (QE): Monetary policy where a central bank purchases government bonds or other financial assets to create liquidity in an economy. Russell 2000: The Russell 2000 Index is an American small-cap stock market index based on the market capitalizations of the bottom 2,000 companies in the Russell 3000 Index. S&P 500: The Standard & Poor’s 500 is an American stock market index based on the market capitalizations of 500 large companies. Share-based compensation: A practice where companies supplement employees’ cash compensation with shares of ownership in the business. Stockholder’s equity: A company’s total assets minus total liabilities (net assets). Tangible book value: Shareholders’ equity, or total assets excluding goodwill and other intangibles minus total liabilities. |
Editor’s Note: The summary bullets for this article were chosen by Seeking Alpha editors.
Be the first to comment