

MJ_Prototype/iStock via Getty Images
These days, there exist a number of packaging companies, some large and some small, that warrant investor attention. One such player that tilts on the large side is a company called Packaging Corporation of America (NYSE:PKG). Financial performance generated by the company in recent years has been rather mixed. But the overall trend for the business has been positive from a cash flow perspective. All things considered, this enterprise looks to be perhaps slightly undervalued relative to its peers, and is no worse than being fairly valued on an absolute basis. More likely than not though, the firm probably does offer some upside for investors moving forward.
A big player in packaging
According to the management team at Packaging Corporation of America, the company operates as the third-largest producer of containerboard products. It also serves as a leading producer of uncoated freesheet paper in North America. At present, the company operates eight different mills and nine corrugated products plants and related facilities across the US. Structurally, the company currently has three different segments that it runs. The first of these is the Packaging segment.
Through this segment, the company sells linerboard and corrugated medium. To be more detailed, these are papers that are mostly used in the production of corrugated products. From this, the company then produces various packaging products such as conventional shipping containers, multi-color boxes, honeycomb protective packaging, and more. The company currently sells its containerboard and corrugated products to roughly 15,000 customers spread across 33,000 different locations. 70% of its sales are made to regional and local accounts, with the remaining 30% attributable to national accounts. In terms of overall end-use of its corrugated products, the company says that 44% is attributable to food, beverages, and agricultural products. A further 25% goes to retail and wholesale trade activities. Paper and other products makes up 12%, with chemical, plastic, and rubber products making up 10%. Miscellaneous manufacturing comprises the remaining 9%. In all last year, this segment was responsible for the production of 4.9 million tons of containerboard. From this, the company sold 65.9 billion square feet of corrugated products. As a result, during the firm’s 2021 fiscal year, this particular segment made up 91.2% of the firm’s overall revenue and accounted for 97.1% of its positive profits.
The second major segment the company has is the Paper segment. Through this, the company manufactures and sells a mixture of paper products, such as commodity and specialty papers, with variety across coloring, types of coating, brightness, and recycled content. This is a considerably smaller segment, with the company selling its products to roughly 100 customers spread across 350 locations. During its 2021 fiscal year, one customer, Office Depot, was responsible for 51% of this segment’s revenue. Having said that, this particular segment made up just 7.8% of the firm’s overall revenue for the year and 2.9% of its positive profits. The last segment the company has is the Corporate and Other segment. This makes up the company’s corporate support staff services. It is also comprised of various transportation assets like railcars and trucks that are used for transporting its products to and from the manufacturing sites. In addition, this segment also includes a 50% ownership of Louisiana Timber Procurement Company. This particular segment accounted for just 1% of revenue in 2021 and generated a net loss.
Author – SEC EDGAR Data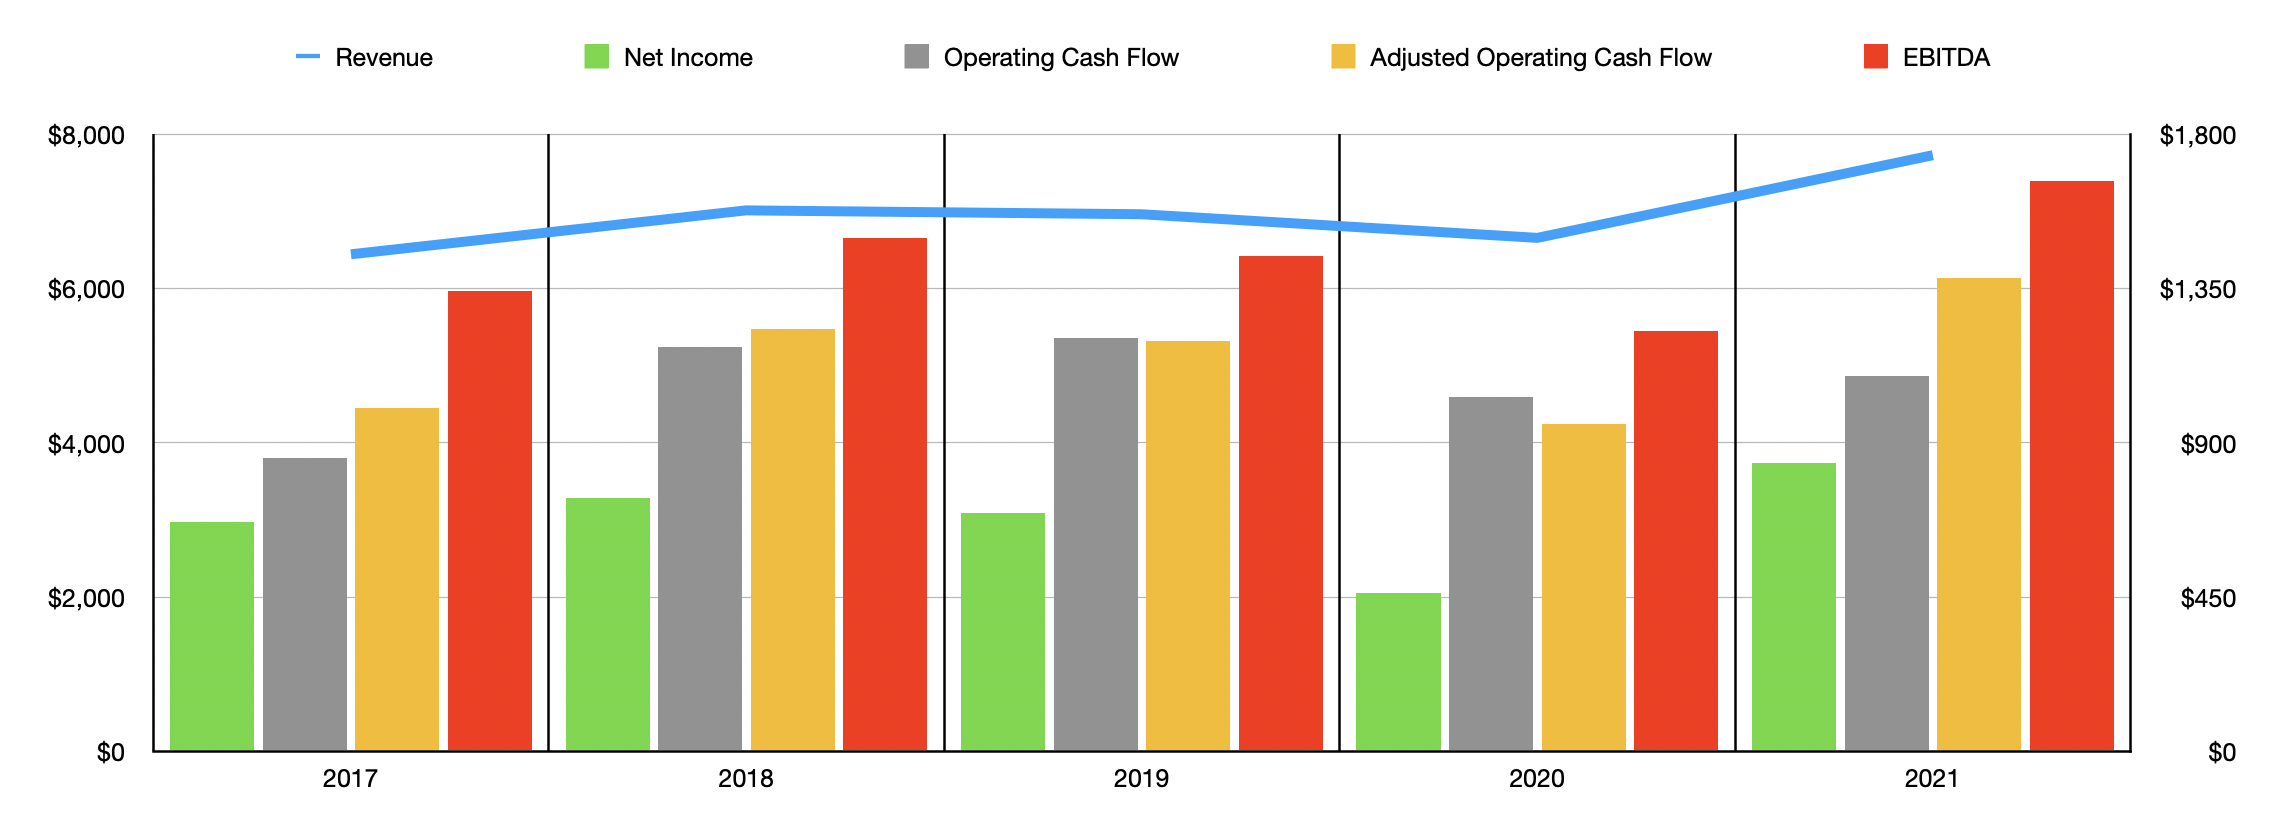
In recent years, financial performance achieved by the company has been a bit mixed. From 2017 to 2018, revenue rose from $6.45 billion to $7.02 billion. Sales then dipped modestly to $6.96 billion in 2019 before dropping to $6.66 billion in 2020 as a result of the COVID-19 pandemic. Fortunately for investors, revenue did rebound and then some in 2021, climbing to $7.73 billion. A big contributor to this rise in revenue was an increase in total product shipped. Containerboard production in 2021 was nearly 4.9 million tons. This was up from 4.3 million tons shipped one year earlier. Corrugated products shipments rose from 62.8 billion square feet to 65.7 billion square feet. Only its paper production suffered, declining from 648,000 tons to 572,000 tons.
The trajectory of net income has closely mirrored the trajectory of revenue. Net profits rose from $668.6 million in 2017 to $738 million in 2018. By 2020, profits declined to $461 million. But just as was the case with revenue, this decline was short-lived. Net profits in 2021 nearly doubled, climbing to $841.1 million. Operating cash flow has been a bit more consistent, rising from $856.1 million in 2017 to $1.21 billion in 2019. The metric did drop to $1.03 billion in 2020 but recovered some to $1.09 billion last year. If we adjust for changes in working capital, the trajectory more accurately mirrors what we saw with revenue and profits. And by 2021, this metric totaled $1.38 billion. The same trend, once again, was visible when it came to EBITDA, with the metric ultimately hitting $1.67 billion last year.
Author – SEC EDGAR Data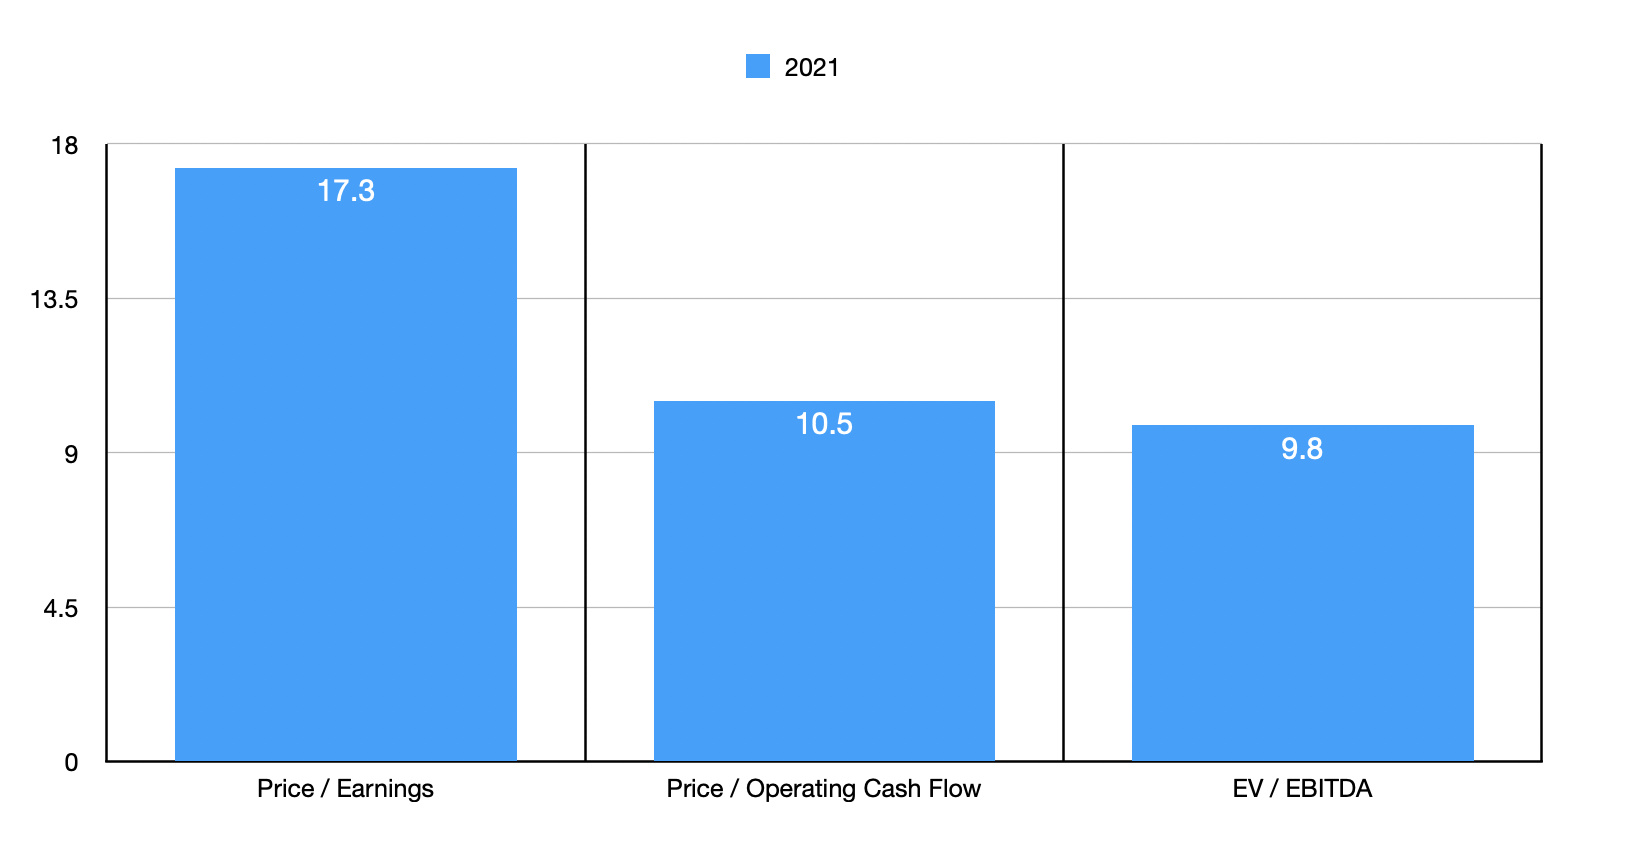
Taking all of this data, we can effectively price the business. Using 2021 figures, I calculated that the company’s price to earnings multiple is 17.3. The price to adjusted operating cash flow multiple is considerably lower at 10.5, while the EV to EBITDA multiple of the company is 9.8. To put this in perspective, I decided to compare the company to five similar firms. On a price-to-earnings basis, these companies ranged from a low of 14.7 to a high of 33.9. Meanwhile, on an EV to EBITDA basis, the range was from 6.8 to 53.2. In both of these cases, only one of the five prospects was cheaper than Packaging Corporation of America. I then looked at the companies through the lens of the price to operating cash flow approach. This gave me a range of between 7 and 21.1. In this case, two of the five companies were cheaper than our prospect.
| Company | Price / Earnings | Price / Operating Cash Flow | EV / EBITDA |
| Packaging Corporation of America | 17.3 | 10.5 | 9.8 |
| Sonoco Products Company (SON) | 33.9 | 21.1 | 53.2 |
| WestRock Company (WRK) | 14.7 | 7.0 | 6.8 |
| Graphic Packaging Holding Company (GPK) | 29.4 | 9.9 | 13.0 |
| Sealed Air Corp (SEE) | 20.3 | 14.5 | 12.4 |
| Amcor plc (AMCR) | 18.5 | 13.1 | 11.8 |
Takeaway
Based on all the data provided, I believe that Packaging Corporation of America is a solid company, but one that is definitely not immune from some volatility on its top and bottom lines. This volatility, even excluding what we saw as a result of the COVID-19 pandemic, does warrant some small discount on a valuation basis. Having said that, recent performance has been impressive and shares appear to be trading at attractive levels relative to similar firms. This makes me slightly bullish on the company at this time.
Be the first to comment