

DS70/E+ via Getty Images
Soybeans are oil seeds that are an essential ingredient in foods, but they are also a critical component of biodiesel, an alternative fuel. Processors crush raw soybeans into two products: meal and oil. The oil is used for cooking and is required for salad dressings, mayonnaises, and other food products. Processors refine the oil into biodiesel that can power vehicles. Animal feeds contain soybean meal, a protein that provides nutrition. Therefore, like corn, soybeans both feed, and power the world.
In the USDA’s latest October World Agricultural Supply and Demand Estimates Report, the gold standard for fundamental agricultural data, the USDA told the soybean market that US oilseed production fell 1.6 million tons to 126.9 million from the previous report. Meanwhile, they increased worldwide ending stocks by 1.6 million to 100.5 million tons because of higher Brazilian stockpiles. In 2022, Brazil and the US are the world’s leading soybean-producing and exporting countries.
The rise of the soybean crush spread to a record high in October 2022 is a clue that higher bean prices could be on the horizon in the coming months. The Teucrium Soybean ETF product (NYSEARCA:SOYB) follows soybean futures prices higher and lower.
Soybean futures reached their highest price since 2014
Nearby soybean futures at the $14 per bushel level remain at the highest price since 2014.
Long-Term Chart of CBOT Soybean Futures (Barchart)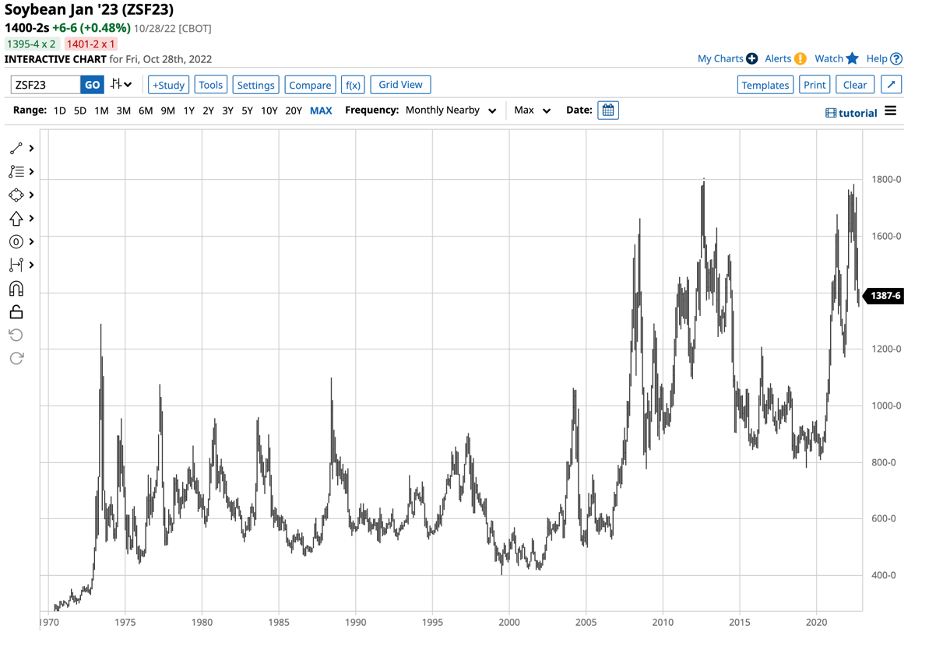
The chart highlights that the active month January CBOT soybean futures were sitting at $14 at the end of the 2022 harvest. The nearby contract reached $17.84 per bushel in June 2022, only 10.75 cents shy of the 2012 record peak. The long-term trend remains bullish, with soybeans at $14, an eight-year high.
Long-Term Chart of Soybean Meal Futures (Barchart)
Meanwhile, soybean meal, the critical ingredient in animal feed, has been trending higher for over two decades, reaching a record peak in 2012, and a slightly lower high in August 2022. The rise in soybean products has ignited the soybean crush spreads that are sitting at a record level.
Crush spreads are an indicator
Crush spreads are a real-time indicator of the demand for soybean products. When soybean meal and oil prices outperform the raw oil seed futures, the crush spread rises and is often a bullish signal for the soybean futures market.
Long-Term Chart of Soybean Oil Futures (Barchart)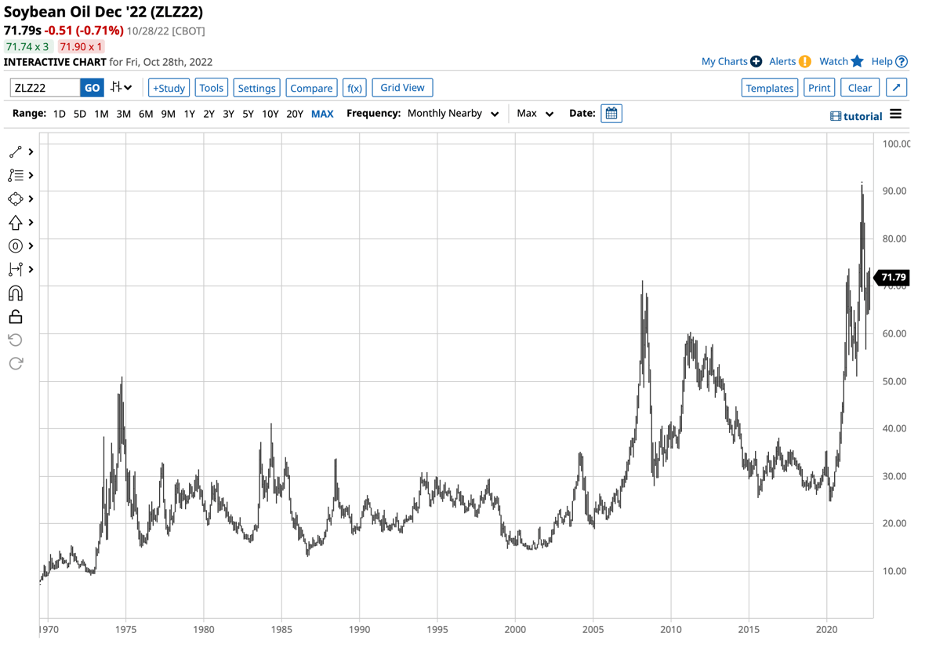
The chart shows that soybean oil futures rose to a record high in April 2022 and were above the previous March 2008 peak on October 31, 2022. Soybean oil’s role in biodiesel production has fueled the rally as distillate fuel prices have soared.
Soybean crush spreads soar
The ascent of the soybean crush spread supports the raw oilseed, but it also fuels earnings at the leading soybean processing companies.
Soybean Crush Spreads (CQG)
The quarterly chart dating back to 2006 highlights the rose in the nearby soybean crush spread. Before 2022, the previous high was in 2014 at $2.1950 per bushel. The crush was sitting at the $3.3775 level on October 28, a record peak.
The move in the soybean crush supports higher soybean prices as the products signal significant demand. Meanwhile, aside from being a barometer for soybean prices, the crush is also a real-time indicator of the earnings of the leading companies that crush beans into oil and meal.
Chart of ADM Shares (Barchart)
Archer-Daniels-Midland (ADM) is a leading US agricultural processing company. ADM shares moved from $67.59 on December 31, 2021, to $94.88 on October 28, 2022, a 40.4% gain.
Chart of BG Shares (Barchart)
Bunge Limited (BG) is a leading agricultural processing company in the US and Brazil, the leading soybean-producing countries. BG shares rallied from $93.36 on December 31, 2021, to $96.76 on October 28, 2022, a 3.64% gain. In a year when the stock market experienced significant declines, the agricultural processing companies have been an oasis of safety, partially because of the rise in the soybean processing margins.
The focus shifts to production in Brazil and the Southern Hemisphere
The world’s top 5 soybean producing countries in 2022 are:
Annual Soybean Production by Country (Worldpopulationreview.com)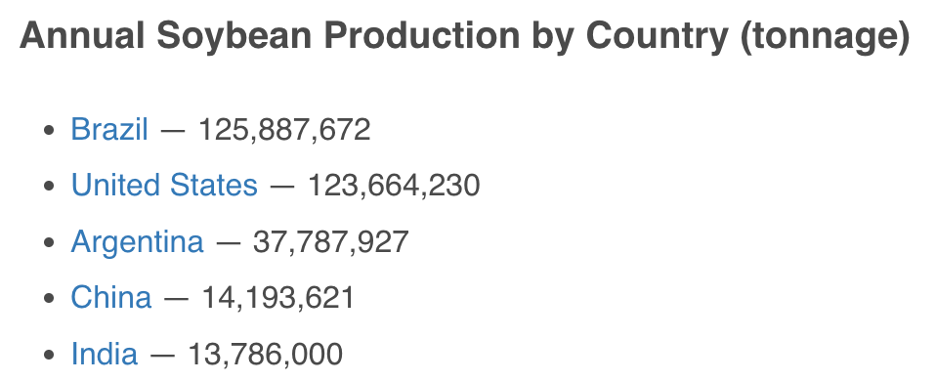
As the chart shows, Brazil and Argentina produced 163,675,599 metric tons of soybeans in 2022, more than the US, Chinese, and Indian production combined. With the 2022 crop season over in the Northern Hemisphere, the soybean futures market will now focus on the weather conditions and crop progress below the equator in Brazil and Argentina. The weather in South America will dictate the path of least resistance of bean prices. At the $14 per bushel level, with crush spreads at record highs, anything but a bumper crop could cause sudden rallies and supply concerns over the coming months.
SOYB is the soybean ETF product
I remain bullish on soybeans going into the South American growing season and the 2023 Northern Hemisphere crop season on the horizon next spring. The most direct route for a risk position in the beans is via the futures and futures options on the CME’s CBOT division. The Teucrium Soybean ETF product (SOYB) provides an alternative for those looking for soybean exposure without venturing into the futures arena.
At $26.50 per share, SOYB had $63.439 million in assets under management. The ETF trades an average of 46,449 shares daily and charges a 1.16% management fee. SOYB’s fund summary states:
The Teucrium Soybean Fund provides investors unleveraged direct exposure to soybeans without the need for a futures account. SOYB provides transparency to investors by investing in a known benchmark (described below), listing all holdings nightly, and providing future roll dates. SOYB was designed to reduce the effects of rolling contracts (and contango and backwardation) by not investing in front-month (spot) futures contracts and thus limiting the number of contract rolls each year. Includes all expenses paid by the Fund, including the management fee, as presented in the Form S-1 dated April 29, 2016.
SOYB typically holds three actively traded CBOT soybean futures contracts to minimize the risk of rolling from one active month contract to another. Since the most price volatility tends to occur in the nearby contract, SOYB tends to underperform the nearby soybean futures on the upside and outperform when downside corrections arise.
Nearby soybean futures rose from $8.0825 in April 2020 to a high of $17.84 per bushel in June 2020, a 120.72% gain. The nearby November contract settled at $13.8775 on October 28, a 22.21% correction from the June peak.
Chart of the SOYB ETF Product (Barchart)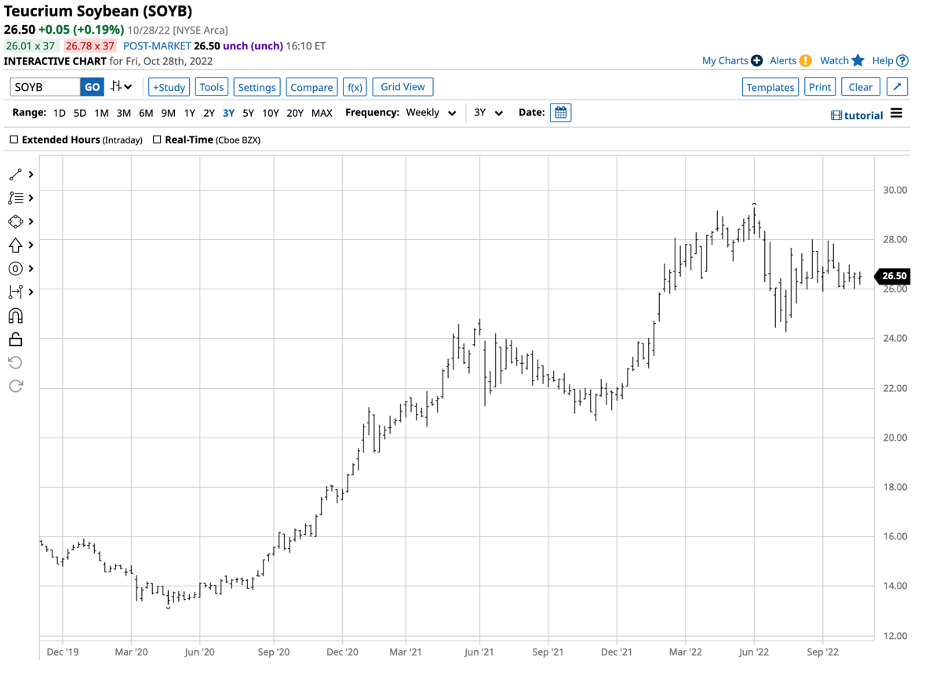
As the chart highlights, SOYB rose from $13.27 in April 2020 to $29.29 per share in June 2022, a 120.7% gain. At $26.50 per share on October 28, the ETF corrected by 9.5%. The term structure, or delivery month-to-month price differentials, in the soybean futures market caused the ETF to mirror the price of nearby futures on the upside and outperform during the recent correction.
Rising inflation causing higher production costs, sky-high processing spreads, fertilizer shortages, and weather uncertainty in critical growing regions should continue to support soybean futures and the SOYB ETF over the coming months. I am a buyer of SOYB, leaving plenty of room to add to long positions on price weakness.
Be the first to comment