

puhimec/iStock via Getty Images
Introduction: Why Is CHTR Stock Up?
Charter Communications Inc. (NASDAQ:CHTR) released its Q3 2022 results on Friday (October 28). CHTR stock closed up 3.7%, having already gained 3.0% the day before when Q3 results from Comcast (CMCSA) were also well-received.
Charter shares remain 43% down year-to-date and 55% down from their peak in September 2021. Compared to the price at which we initiated our Buy rating in January 2020, Charter shares have lost 28%:
|
Charter Share Price (Since IPO) 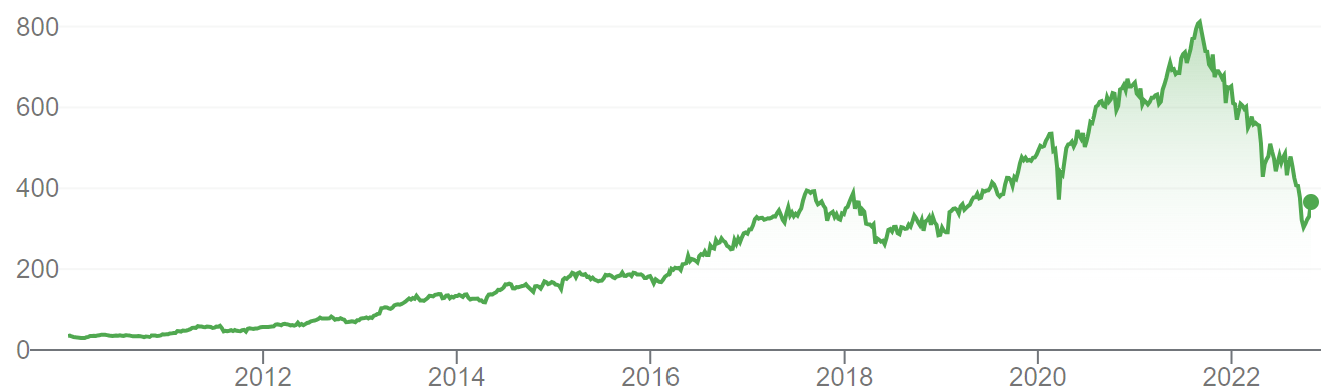 Source: Google Finance (28-Oct-22). |
Charter’s Q3 results showed continuing stable despite increasing macro headwinds. Internet revenues grew both year-on-year and sequentially, and net adds returned to positive, despite even larger Fixed Wireless net adds at competitors. Charter again pointed to historically low churn among its customers and attributed its relatively weak growth to temporarily low market activity. EBITDA grew year-on-year, though dampened by one-off step-ups in marketing costs and bad debts. Free Cash Flow was up 5% year-on-year excluding one-offs.
Charter stock has at a FCF Yield of 10%, and management is sticking with their accretive leverage and buyback policies. Our forecasts indicate a total return of 172% (37.1% annualized) by 2025 year-end. Buy.
Charter Buy Case Recap
Our Charter investment case has been based on the following:
- Internet revenues are growing from both the number of users and Average Revenue Per User, driven by growing connectivity demand, pricing power, new household formation and network “edge out” expansion
- Existing cable infrastructure is a highly-defensible asset, with competitive speeds that can be upgraded further at relatively low costs; new entrants typically struggle to get a good return on investment
- Charter has further strengthened its subscriber retention by focusing on price/value in its customer proposition, bundling adjacent products and improving customer service
- Video customer losses have little impact on profits, as Video revenues are already low-margin and Programming Costs contractually fall with customer numbers
- Overall revenues can grow at low-single-digits and, with the shift to higher-margin Internet revenues and stable service costs, EBITDA can grow at mid-single-digits
- FCF can grow at low-teens, thanks to stable CapEx and financial leverage; FCF/Share at grow at high-teens, thanks to buybacks financed by FCF and new borrowings in line with a 4.0-4.5x Net Debt / EBITDA target
- The new Mobile business is growing rapidly and already profitable excluding customer acquisitions; it will produce a substantial EBITDA in due course, likely $500m by 2025
Charter historically grew much faster than our investment case. Across 2017-21, EBITDA CAGR was 7.8%, FCF CAGR exceeded 20%, and FCF/Share CAGR exceeded 30%, though home connectivity demand was boosted by COVID-19 lockdowns during 2020-21; EBITDA growth was still 5.0% in 2018 and 2019:
|
Charter Internet Subscribers & Key Financials (2017-21) 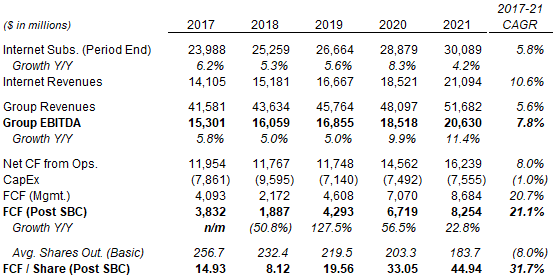 Source: Charter company filings. NB. SBC = Share-Based Compensation; average basic share numbers used for comparability; FCF/Share figures are calculated differently in the rest of the article. Charter completed the acquisition of TimeWarner Cable in May-16. |
Growth in Charter’s Internet revenues has slowed in 2022, which management attributes to a post-COVID market-wide slowdown in customer activity, but which bears believe has been caused by Telco Fixed Wireless and/or fiber overbuild.
Q3 2022 results supports our investment case, by showing that Charter’s business has stayed stable despite increasing macro headwinds.
Charter Q3 Results Headlines
The table below shows Charter’s Q3 2022 revenues, costs and EBITDA compared to last year and Q2:
|
Charter Revenues & EBITDA (Q3 2022 vs. Prior Periods) 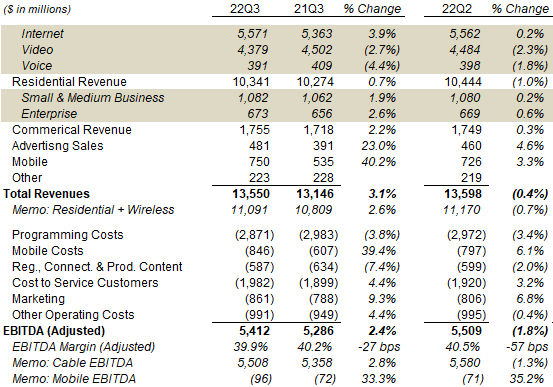 Source: Charter results release (Q3 2022). |
Internet revenues grew 3.9% year-on-year and 0.2% sequentially – we will discuss this in further detail below.
Video revenues fell 2.7% ($123m) year-on-year and 2.3% ($105m) sequentially, due to customer losses after a price increase in Q2. (Video revenues were up 1.2% in H1 2022 and 1.1% in 2021.) However, Programming Costs fell by similar dollar amounts ($112m year-on-year and $101m sequentially), which meant this had little impact on EBITDA.
Advertising revenues grew 23.0% year-on-year, largely due to political ads in an election year; core ad revenues were flat year-on-year, slightly better than the 1% decline seen in Q2.
Mobile revenues reached $750m, including $303m of device revenues. Excluding devices, Mobile revenues grew 33.8% year-on-year and 4.7% sequentially, another quarter of strong growth (with 396k lines being added).
EBITDA grew only 2.4% ($126m) year-on-year, less than revenue growth of 3.1% ($404m). The bulk of the gap was due to increases in Cost to Service Customers (up $83m) and Marketing (up $73m) (because the changes in Programming Costs and Mobile Costs were largely offset by changes in Video and Mobile revenues respectively). Both increases included sizeable one-off components: 1.3 ppt of the Cost to Service Customers increase was due to bad debts normalizing to pre-COVID levels, while the rest was “primarily” due to higher fuel and freight costs. The increase in Marketing was “primarily” due to higher staffing levels (including call centers in-sourcing) and planned wage increases.
The sequential decline in EBITDA can be attributed to increases in Cost to Service Customers and Marketing driven by similar dynamics, as well as the weaker Internet revenue growth, which we believe is partly seasonal.
Year-to-date, Charter’s EBITDA grew 5.8% year-on-year.
Charter’s Internet Net Adds Turned Positive
Charter’s added 75k Internet subscribers in Q3; Internet customers were up 1.4% year-on-year and 0.2% sequentially:
|
Charter Customer Numbers (Q3 2022 vs. Prior Periods) 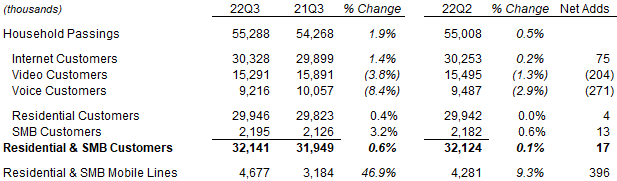 Source: Charter results schedule (Q3 2022). |
The near-100k up swing from the net loss of 21k in Q2 vindicates our previous view that the loss was in part due to seasonality (people leaving college towns during the summer). The transition between different federal subsidy programs (the EBB and the ACP) again cause some customer losses, but fewer than in Q2 (59k) and not disclosed.
Charter has started spending substantial CapEx on its new rural construction initiative in 2022, but this was not material to Q3 net adds. In Q2, “most” of this CapEx was spent on “design, work out and make-ready”, and management explicitly stated that this “has not yet resulted in significant passings growth.” We do not believe this has changed in Q3.
Note that sequential growth rates in Internet subscribers and revenues do not necessarily correlate. In Q3, subscribers and revenues were both up 0.2% sequentially whereas, in Q2, subscribers were down 0.1% but revenues were up 2.0%:
|
Charter Internet Revenues & Customer Growth Q/Q (Since 2017) 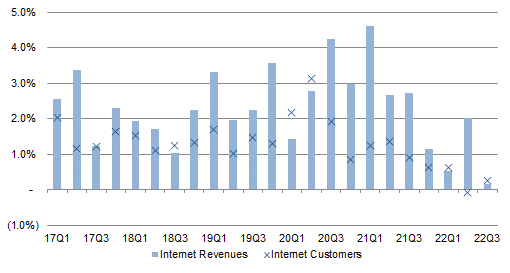 Source: Charter company filings. |
Subscriber and revenue growth historically often did not correlate. Revenue growth is also influenced by price hikes, upgrades and promotional discounts. (Management stated they have “passed though recently a broadband price increase” but did not disclose how much.) More fundamentally, the net add figure quoted for each quarter is the difference between subscriber numbers at the start and end of each quarter, whereas revenues are generated by subscriber numbers each month. For these reasons, we do not believe investors should over-focus on net adds.
Charter’s return to positive Internet net adds in Q3 was in spite of even larger net adds in Fixed Wireless at T-Mobile (TMUS) (578k, vs. 560k in Q2) and Verizon (VZ) (342k, vs. 256k in Q2), supposedly the cause for its Q2 loss:
|
Wireline & Fixed Wireless Broadband Net Adds – Key Players (Since Q2 2019) 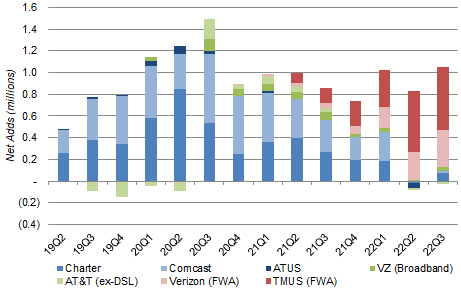 Source: Company filings. NB. Comcast Q1 2022 figure includes one-third benefit from end of COVID free programs. |
Wireline broadband net add was again negative at AT&T (T) (-29k excluding DSL) and a small 38k Verizon, showing that Telco fiber overbuild does not have a material impact on Charter’s customer base.
As in previous quarters, management pointed to historically low churn among its customers, and attributed the relatively weak growth to low gross adds as a result of temporarily low market activity; Fixed Wireless may have taken some DSL customers who would otherwise have signed up with Charter, but this is likely marginal and short term:
“While our Internet net additions improved from last quarter, they remained below last year. The largest driver by far is that activity level remains low. Total churn and voluntary churn were slightly lower year-over-year and were at all-time lows for third quarter. Non-pay and move churn remain well-below pre-pandemic levels. Those are market issues that also reduce our selling opportunities.”
“Gross additions also remain down across the footprint by similar amounts in both [fiber] overbuild and non-overbuild areas … Some of the lower gross additions we see probably relate to DSL conversion going to a new entrant, Fixed Wireless, [but] we expect those customers to find their way back to us over the long term … We’ve seen a small amount of market share return to mobile-only service over the past several quarters, the reversal of some COVID effects.”.
Chris Winfrey, Charter COO (Q3 2022 earnings call)
Charter continues to expect its Internet net adds to reaccelerate at some point, and we agree.
Charter FCF Up 5% In Q3 Ex. One-Offs
Excluding one-offs, Charter’s FCF grew 5% year-on-year in Q3, though reported FCF fell due to one-off factors.
Reported FCF, per management’s definition, was $1.51bn in Q3 and $980 lower year-on-year. However, the reduction was largely due to a $383m increase in cash taxes (after the exhaustion of tax losses) and $525m of CapEx on the new rural construction initiative. Management stated that FCF excluding both items and litigation settlements grew 5%:
|
Charter EBITDA & Cashflows (Q3 2022 vs. Prior Periods) 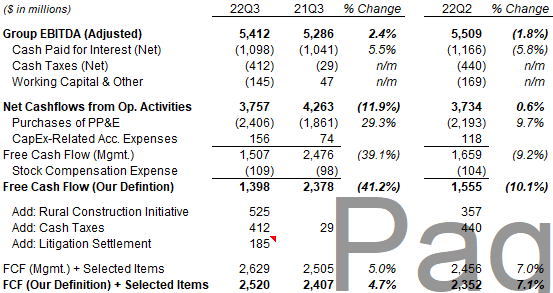 Source: Charter company filings. |
The 5% figure implies that litigation settlements in Q3 were worth $185m. Adjusting all one-off items including this, FCF under our definition grew 4.7% year-on-year and 7.1% sequentially. While these growth rates are below the low-teens we expect in our investment case, we believe this is temporary and expect them to reaccelerate along with net adds.
On a last-twelve-month (“LTM”) basis, even including the one-off items described above, Charter’s FCF/Share fell just 1.5%, thanks to the share count having been reduced by 14.4% year-on-year:
|
Charter LTM FCF/Share (Q3 2022 vs. Prior Periods) 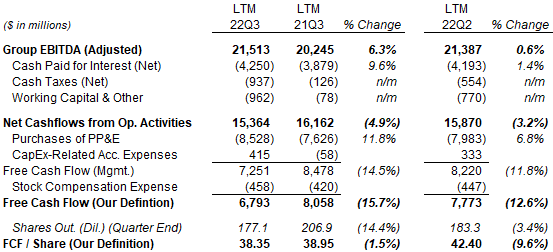 Source: Charter company filings. |
LTM Total FCF fell 12.6% sequentially, largely due to the same increases in cash taxes and CapEx as described above, but the share count only having fallen 3.4% between Q2 and Q3.
Charter’s 10% Free Cash Flow Yield
At $368.24, CHTR shares are trading at a 10% FCF Yield.
In 2021, Charter had $8.25bn of FCF, or $6.33bn adjusted for the start of cash taxes, implying a 9.7% FCF Yield:
|
Charter Earnings, Cash flows & Valuation (2018-21) 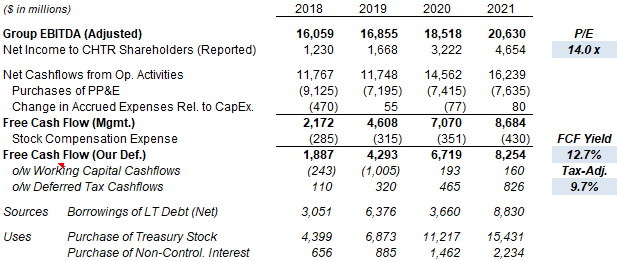 Source: Charter company filings. |
LTM FCF of $6.79bn implies a FCF Yield of 10.4%, though this includes some quarters with lower tax and CapEx.
Q3 2022 FCF, when adjusted to exclude the $185m in estimated litigation settlements, annualizes to $6.33bn, which also implies a FCF Yield of 9.7%.
There are arguments that CapEx on the new rural construction ($525m in Q3 and $1.1bn in LTM) initiative should be excluded from FCF Yield calculations, in which case the FCF Yield would be even higher. As we described in our Q1 results review, the rural construction initiative is expected to involve at least $5bn of CapEx over 6 years, offset by $1.2bn of Rural Digital Opportunity Fund subsidies, to generate a mid-teens rate of return over time, but not produce any significant new customers in 2022.
Sticking With Same Leverage & Buybacks
Charter is sticking with its highly-accretive leverage and buyback policies.
Net Debt was 4.48x at the end of Q3, up 0.03x sequentially. Management “intend to stay at or just below the high end of our 4 to 4.5 times [Net Debt / EBITDA] target leverage range”. Incoming CEO Chris Winfrey explicitly stated that higher interest rates will not be an issue, Charter having had the same leverage in previous periods with similar rates.
Similarly, buybacks continued in Q3, with $2.6bn of repurchases at an average price of $445.50. Management sees Charter shares as highly attractive at their current price and intend to continue buybacks:
“The Free Cash Flow yield on equity is so high that I think that continuing to do share buybacks presents significant opportunity for the company … I don’t see … even in what might be a temporarily pressured growth environment as being a reason to move off of where we’ve been from a leverage standpoint or as your buyback strategy”
Jessica Fischer, Charter CFO (Q3 2022 call)
Fisher also noted that Charter bonds are trading at a discount and indicated that Charter may take advantage of this.
Charter Return Forecasts
We keep our forecasts unchanged from our review in October. Our 2025 FCF/Share forecast remains $75.14:
|
Illustrative Charter Return Forecasts 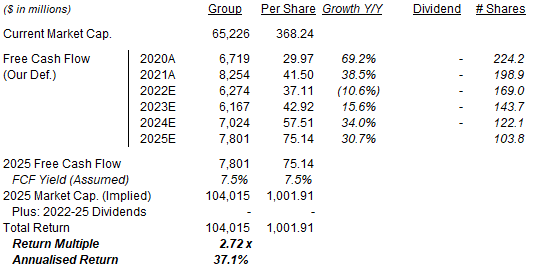 Source: Librarian Capital estimates. |
With shares at $368.24, we expect an exit price of $1,000 and a total return of 172% (37.1% annualized) by 2025 year-end.
Is CHTR Stock A Buy? Conclusion
We reiterate our Buy rating on Charter Communications Inc. stock.
Be the first to comment