

cagkansayin/iStock via Getty Images
Investment thesis
NVIDIA (NASDAQ:NVDA) is a company I follow closely by considering both fundamental and technical aspects. In my last two articles on NVDA, I suggested two price targets that have sequentially been reached, leading me to write an update on what I consider the most likely developments in the price action. NVDA faces some significant challenges in this volatile market, and the stock has reached a price level that is a do-or-die situation. In this article, I explain an actionable trading opportunity in the short term; I discuss a contingency plan for the coming weeks by suggesting my most likely overhead price targets, and I also examine the downside risk, by considering appropriate stop-loss levels and actively managing the risk exposure.
A quick look at the big picture
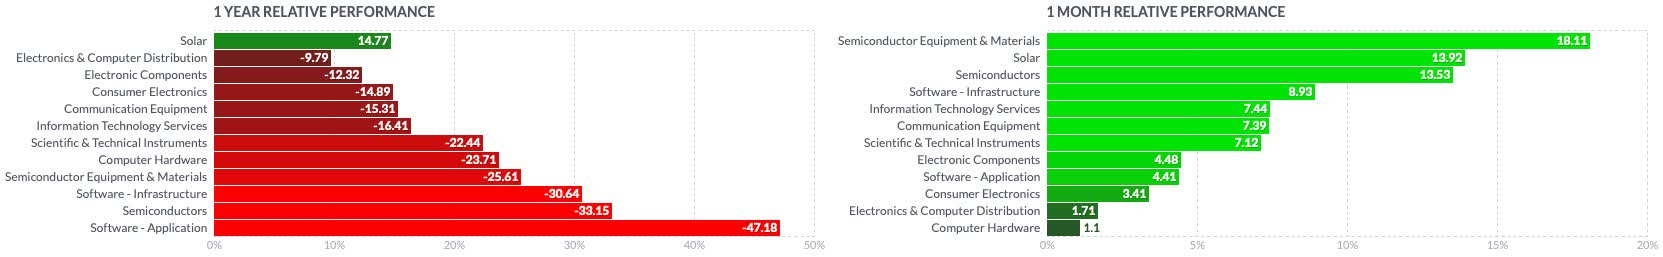
The US technology sector continues to perform better with its retracement accelerating and projecting the group among the three best-performing sectors in the past month. The solar industry continues to perform above the sector’s average, companies in the semiconductor equipment and materials industry, as well as semiconductor manufacturers could report the fastest growth in the past few weeks, while former better-performing industries, such as companies in the electronics and computer distribution, or computer hardware manufacturers, have become laggards.
finviz finviz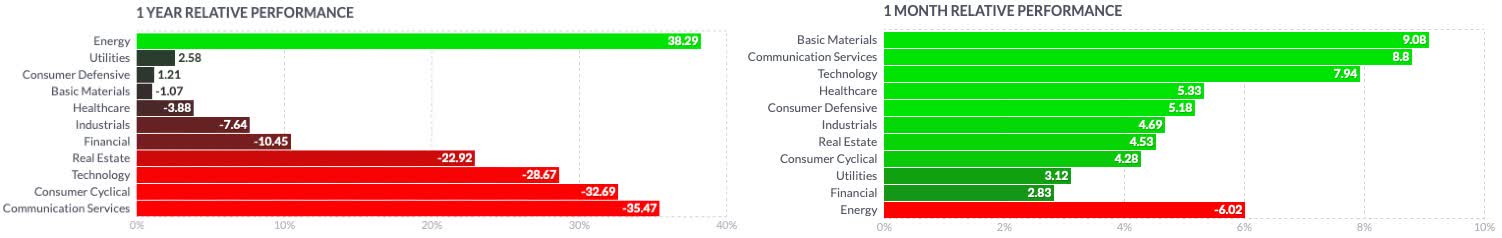
Considering more specific groups of the industry, the VanEck Semiconductor ETF (SMH) has been able, as I expected, to build up significant relative strength when compared to the broader technology market, the Nasdaq Composite (IXIC), or more narrowly the Nasdaq-100 tracked by the Invesco QQQ ETF (QQQ). The retracement has projected the index out of its long-term downtrend on its weekly chart, market by high conviction on increasing volume. SMH is now facing strong overhead resistance marked by the intersection of its EMA50 and its EMA100, a price level, which has now been tested over the past three weeks, without the success of a breakthrough.
Author, using TradingView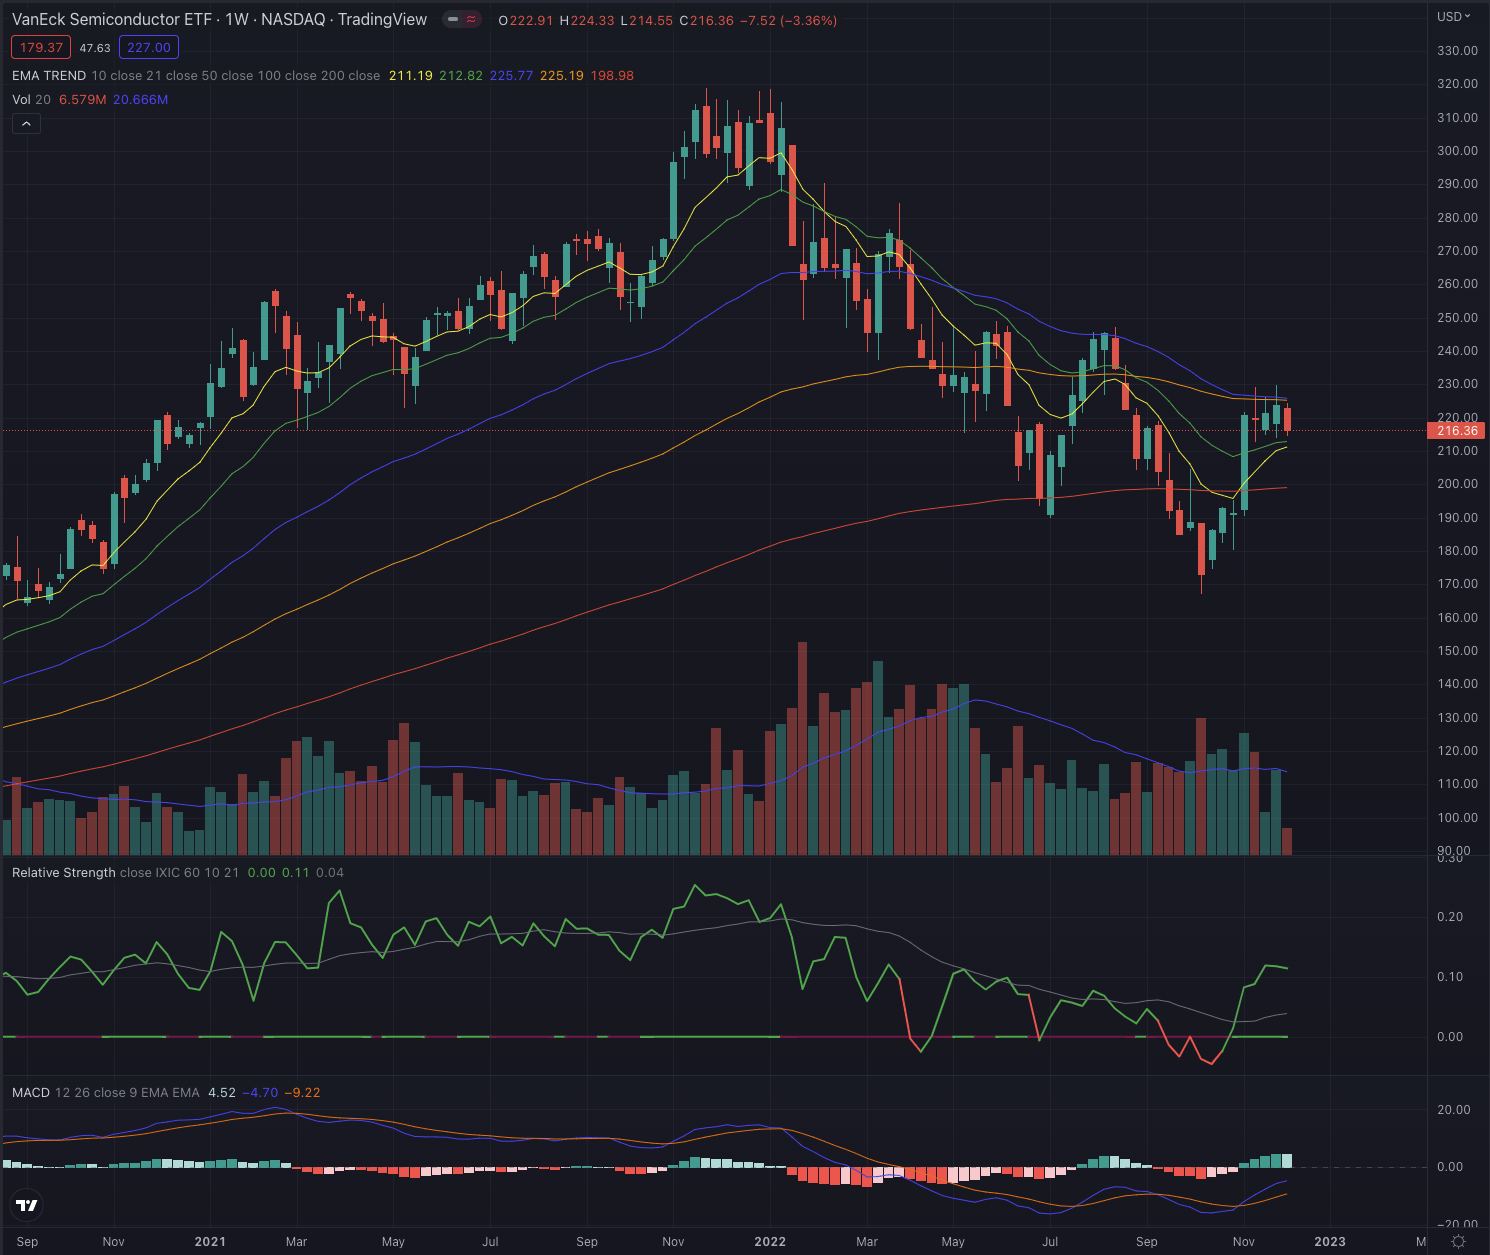
Where are we now?
In my last article Nvidia: Touchdown And Ready For The Next Target, published on November 7, 2022, while NVDA was still hovering below its EMA200 on its weekly chart, I suggested a continuation of the seemingly strong build-up, as I wrote
I see as likely the stock testing its closest support level, before possibly heading significantly higher. If the stock overcomes its EMA200 on its weekly chart, I define $160 as a likely price target from a short-term perspective.
Although the stock spent little time testing its support levels, it finally accelerated significantly shortly after some consolidation, until even overcoming the previously discussed target price. A target I set through my technical analysis but also suggested in my fundamental valuation.
Investors who were already following my call from my earlier article, published on September 7, where I suggested the stock bottoming at around $106, took advantage of that bottom formation while also following my last call about the target seen at $160, could overall generate over 50% performance. A rewarding trade in a short time in those volatile and uncertain markets.
Author, using TradingView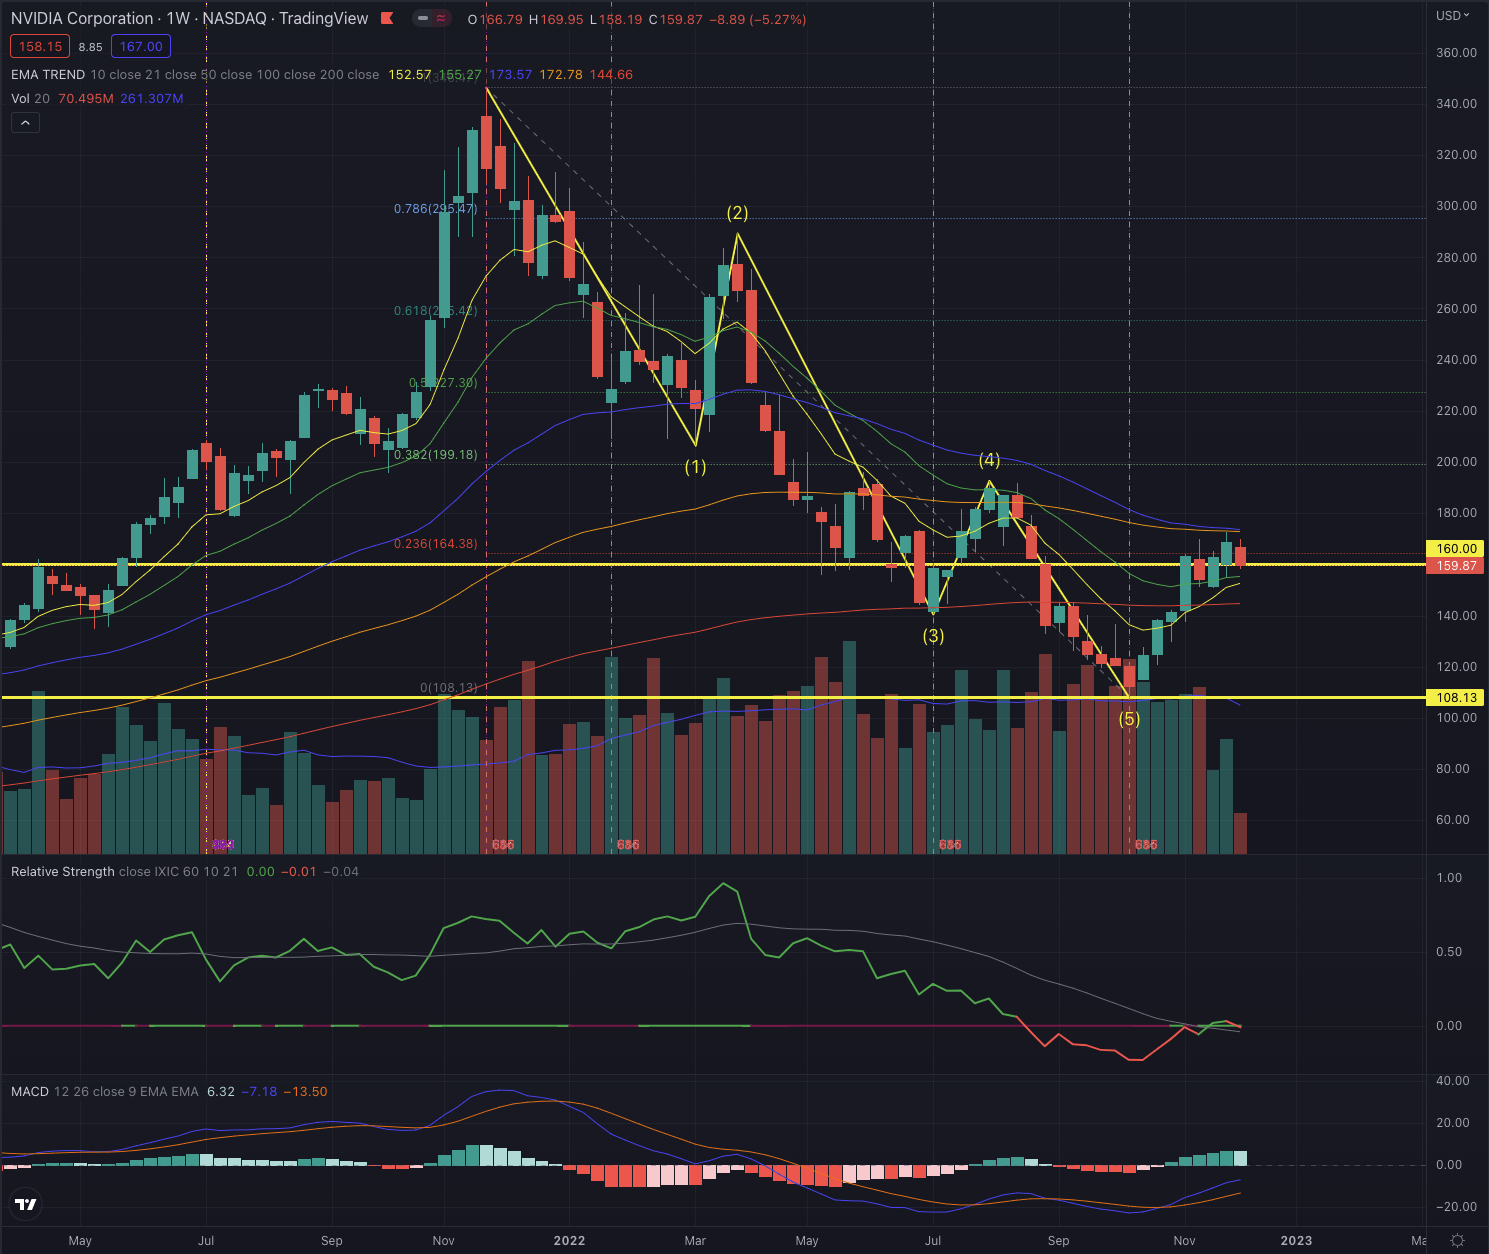
On NVDA’s weekly chart it is now important to note that the stock is now in a very similar situation as the industry reference we discussed earlier, as it faces strong resistance from its EMA50 and EMA100. What is instead significantly different, is that NVDA hasn’t been able to build up as much significant relative strength when compared to the broader technology, despite recovering from significant weakness, especially through its most recent positive momentum. At this point, I would be very careful and watch the price action, while following a strict contingency plan.
What is coming next?
To discuss my considerations on the probable outcome in the coming weeks, I switch to NVDA’s daily chart, where the stock is facing its actual strongest overhead resistance represented by its EMA200. It’s a do-or-die situation for NVDA, which could determine the direction in the coming weeks.
Author, using TradingView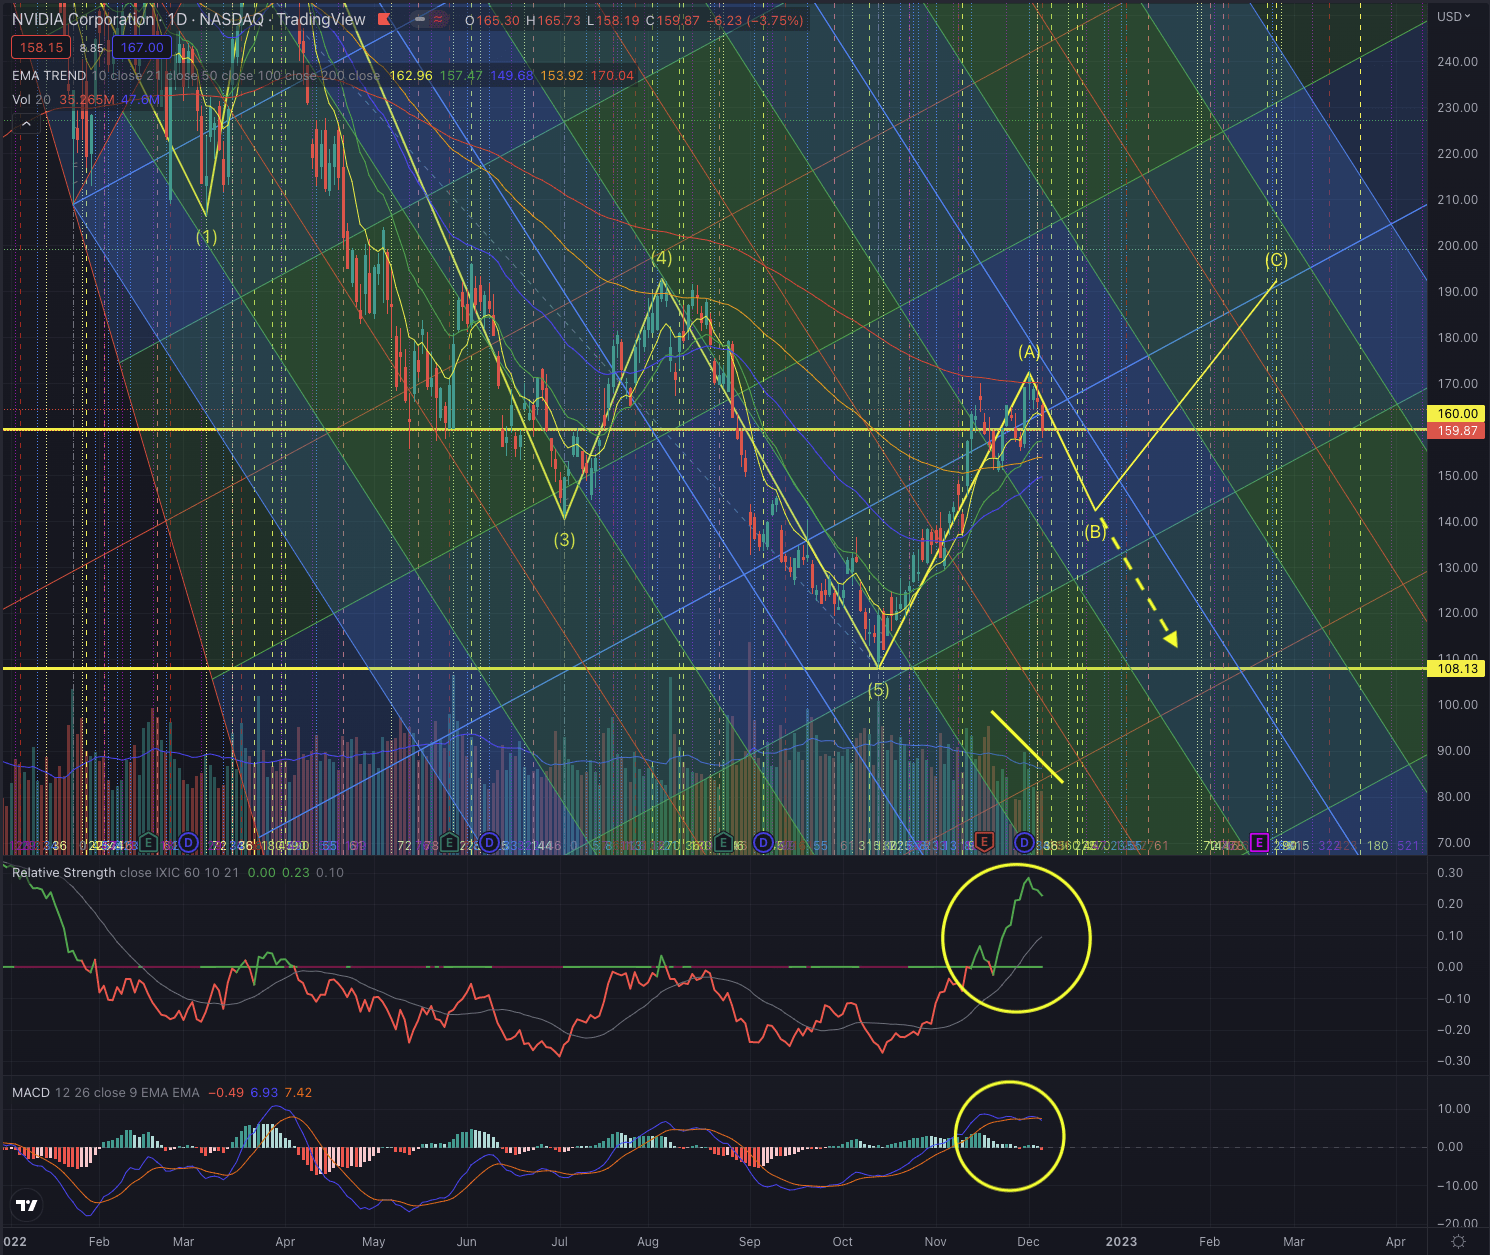
My time-based analysis is converging with multiple important time windows in the next week. Although those instruments aren’t always precise, and I don’t base my investing decisions solely on those, they have been very helpful in timing my entry or exit points. The fact I observe a similar convergence in other uncorrelated stocks and even in the chart of the SPDR S&P 500 Trust ETF (SPY), is suggesting that it may effectively is a time to be careful as it seems also overlapping with the highly expected December FED meeting.
The stock has until now not defined if the actual uptrend would form a new Elliott impulse sequence, or if the stock will form a corrective sequence, but I consider as more likely a temporary consolidation as the stock seems to get rejected at its resistance on dropping buy-side volume, slowing momentum and seemingly on peaking relative strength. Here, I would closely observe support levels around its EMA50, at $140, and further down until its bottom around $108.
If the actual formation leads to a temporary pullback, price levels around $140 are seen as of utmost importance for eventually leading to a strong rebound, where I would expect the stock to reach $180 as the first target, while successively, if supported by more strength, continuing its ascension toward $192, $224, until the most positive scenario where I see NVDA extending until $244.
Investors may want to particularly observe how the stock will close its week, as the stock has reached a temporary top, and could seemingly close under its EMA200 on increasing weakness. If the stock overcomes this resistance until the end of the week, it would instead mark a strong sign of a continuation and my scenario of a pullback might be invalidated. The second most important price level to observe will be between the EMA50 and $140. If the stock reaches those price levels, it will probably be a do-or-die moment, which will hint at a rebound, or a continuation of the downtrend.
After the strong recent movement, and by considering the possible higher risk of a more significant pullback, I would consider securing at least part of my gains, while I could always jump in the stock again once it would give me more positive signs. Investors who have a higher risk tolerance could set their stop-loss under NVDA’s EMA50 or under $140, while I would not hold the stock if the price breaks under this level. As a long-term-oriented investor who didn’t take part in the recent uptrend, I would now wait on the sidelines for a better setup, as those price levels are too uncertain for building up a significant position. I would not consider any major position until the stock has confirmed a significant breakout over its long-term moving average.
The bottom line
Technical analysis is not an absolute instrument, but a way to increase investors’ success probabilities and a tool allowing them to be oriented in whatever security is listed on the markets. One would not drive towards an unknown destination without consulting a map or using a GPS. I believe the same should be true when making investment decisions. I consider techniques based on the Elliott Wave Theory, as well as likely outcomes based on Fibonacci’s principles, by confirming the likelihood of an outcome contingent on time-based probabilities. The purpose of my technical analysis is to confirm or reject an entry point in the stock, by observing its sector and industry, and most of all its price action. I then analyze the situation of that stock and calculate likely outcomes based on the mentioned theories.
The semiconductor industry has outperformed other industries in the technology sector, reporting significant relative strength in the past few weeks, but is now facing strong overhead resistance that led to a slowdown in the positive momentum. While NVDA could overall perform greatly since my last two calls on the stock, I now consider growing risks and want to secure at least part of my profits. The situation led me to reevaluate my contingency plan and the stock’s rating, which I now consider being a hold position for more risk-tolerant investors until a clearer setup will form. As no one can predict with certainty the upcoming price action, my analysis offers multiple scenarios with targets considering multiple outcomes, which could progressively be observed.
Be the first to comment