

US Dollar (DXY) Price and Chart Analysis
- US dollar weakness continues after Friday’s heavy post-NFP sell-off.
- The greenback nears a notable zone of support.
Recommended by Nick Cawley
Get Your Free USD Forecast
The US dollar is slipping lower at the start of the week, extending Friday’s sell-off, as risk markets push higher despite the lack of any, confirmed, positive driver. Equity markets are moving higher, the VIX is moving lower, while gold is testing notable resistance despite lofty US Treasury yields. The 2-year UST is quoted at around 4.68%, while the 10-year is seen at 4.14%. All of this risk enthusiasm despite the Fed hiking rates by another 75 basis points last Wednesday and warning that the market may not have fully priced in the central bank’s intention to curb inflation.
Fed Hikes Rates by 75 BPs and Alters Guidance; US Dollar Outlook Post-FOMC
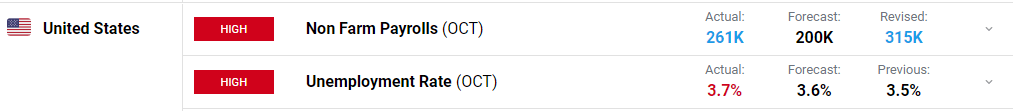
Friday’s US Jobs Report (NFPs) was seen as a mixed bag with more jobs created than expected while the unemployment rate rose by slightly more than forecast.
October Jobs Report: Economy Adds 261, 000 Payrolls. Where Next for the US Dollar
One ongoing story mooted behind the pick-up in risk is the potential rolling back of covid sanctions in China. This story started around a week ago, causing Asian stock markets to jump, but it has been repeatedly denied by the Chinese government. Using a China-based rumor as a reason to take on risk is not a good idea.
Trade Smarter – Sign up for the DailyFX Newsletter
Receive timely and compelling market commentary from the DailyFX team
Subscribe to Newsletter
On Thursday, the latest look at US inflation should give the market a clearer short-term direction, although this may be clouded by a raft of Fed speakers this week, starting with Collins, Mester, and Barkin today.
For all market-moving data releases and economic events see the real-time DailyFX Calendar.
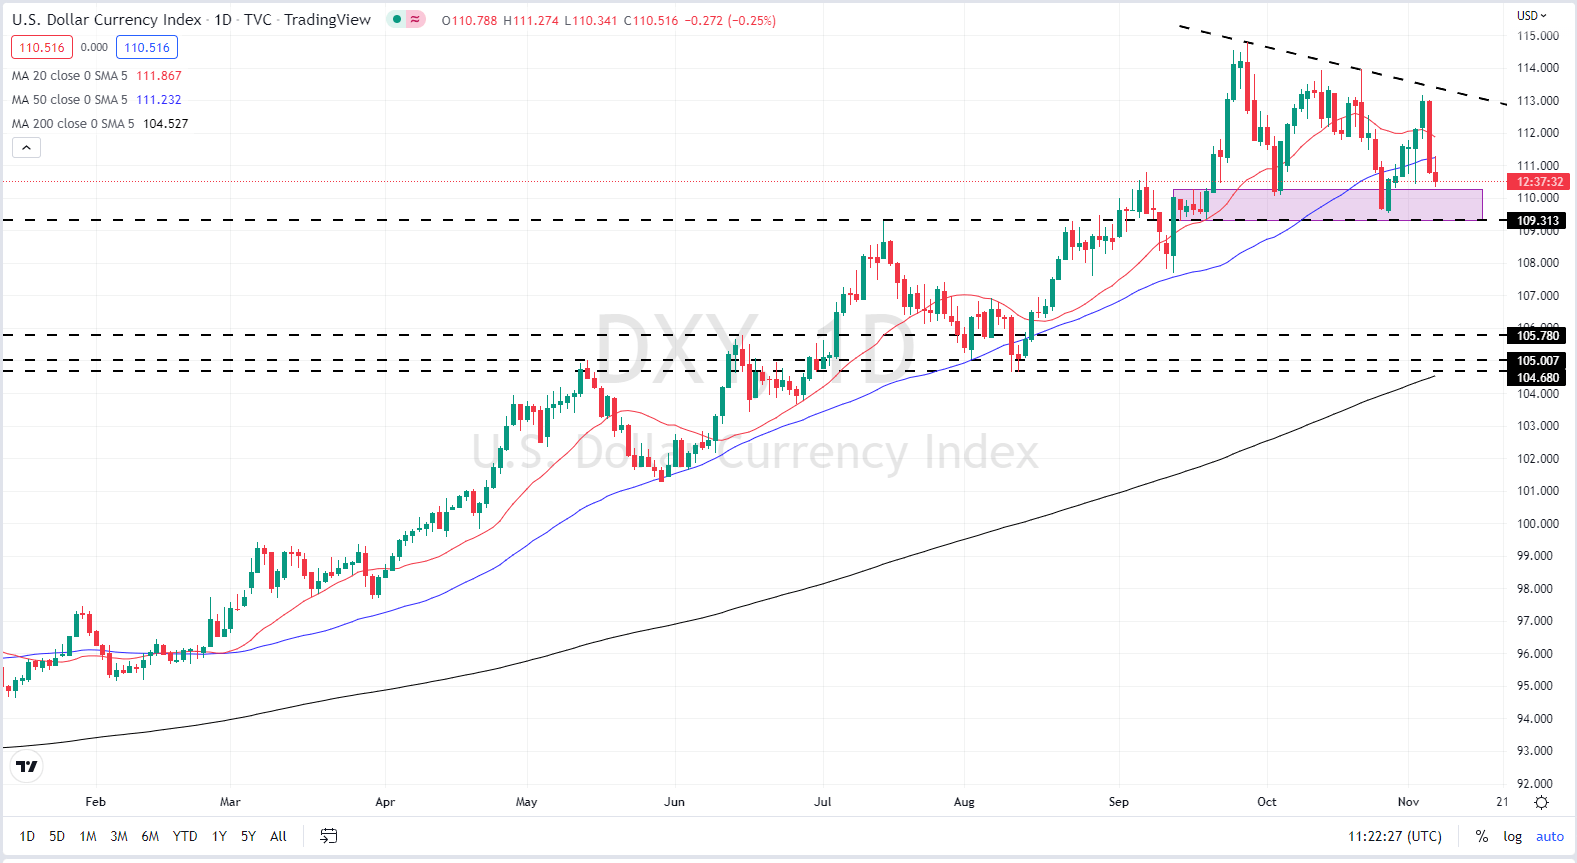
The daily USD chart highlights Friday’s sell-off and the gentle drift lower seen since the September 28 high print. The USD is now close to a supportive zone between 109.30 and 110.30 that has held multiple attempts to break lower. A confirmed break below here opens the way to sub-108. The dollar is now below both the 20- and 50-day moving average, a neutral to negative set-up.
US Dollar Currency Index Daily Price Chart – November 7, 2022
What is your view on the US Dollar – bullish or bearish?? You can let us know via the form at the end of this piece or you can contact the author via Twitter @nickcawley1.
Be the first to comment