

jewhyte
This article was co-produced with Dividend Sensei.
Right now, inflation is top of mind for most Americans, arguably one of the largest problems facing the country right now.
However, the bond market, the so-called “smart money” on Wall Street, has a potentially dire warning about a looming economic threat that could soon replace recession as the top concern for most Americans.
The 2-10 yield curve, one of the best recession predictors in history, is now 0.23% inverted. For context, that’s the most extreme inversion since 2006, and it means the bond market is extremely worried about a recession in 2023.
In fact, I was reading an article in the WSJ this week suggesting that a recession could be set to begin in Q4 of 2022. Since 1953 every recession has seen earnings contract, on average by 13%, though the average in the last five has been a sharper 18%.
But smart long-term investing, especially for retirees depending on dividends, requires hoping for the best and planning for the worst.
This is why focusing on safety and quality first, and prudent valuation and sound risk-management always is the best time-tested way to not just build incredible income and wealth over time, but retire rich and stay rich in retirement.
Not just during boom times like we’ve seen in the last three years when the S&P delivered Buffett-like 24% annual returns, but even in inevitable recessions and bear markets.
That’s why we wanted to highlight the National Bank of Canada (OTCPK:NTIOF), one of the most recent blue-chips we recommended for Dividend Kings members and added to my retirement portfolio.
As I’ll now show you, there are four reasons why NTIOF isn’t just a great company to own within your diversified and prudently risk-managed portfolio, in my opinion, it’s one of the best high-yield blue-chips you’ve probably never heard of.
Reason One: National Bank of Canada Is The Complete Retirement Package
Here is the bottom line up front on NTIOF.
-
Canadian Company: foreign diversification
-
15% tax withholding (not in retirement accounts) – tax credit available to recoup withheld dividend
-
1099 tax form, qualified dividends
-
own in a retirement account to avoid tax withholding
Reasons To Potentially Buy National Bank of Canada Stock Today
-
90% quality low-risk 12/13 Super SWAN quality Canadian Bank
-
79th highest quality company on the Master List (84th percentile)
-
97% dividend safety score
-
No dividend cuts 1992 (30 years)
-
4.4% very safe yield
-
0.5% average recession dividend cut risk
-
1.2% severe recession dividend cut risk
-
16% conservatively undervalued (potential good buy)
-
Fair Value: $79.18 (10.4X earnings)
-
8.8X forward earnings vs 10.4X to 10.9X historical
-
A stable outlook credit rating = 0.66% 30-year bankruptcy risk
-
80th industry percentile risk management consensus = very good
-
6% to 10% CAGR margin-of-error growth consensus range
-
8.8% CAGR median growth consensus
-
5-year consensus total return potential: 12% to 17% CAGR
-
base-case 5-year consensus return potential: 15% CAGR (2X more than the S&P consensus)
-
consensus 12-month total return forecast: 25%
-
Fundamentally Justified 12-Month Returns: 23% CAGR
NTIOF is acting defensively in 2022 but is still in a bear market resulting in attractive valuations.
NTIOF is in a 25% bear market not justified by its fundamentals.
NTIOF Medium-Term Growth Outlook Is Intact
|
Metric |
2020 Growth |
2021 Growth |
2022 Growth Consensus |
2023 Growth Consensus |
2024 Growth Consensus |
|
Sales |
-8% |
4% |
-9% |
5% |
4% |
|
Dividend- Canadian Dollars |
7% |
0% |
27% |
10% |
4% |
|
Operating Earnings |
-3% |
50% |
10% |
-1% |
15% |
|
Book Value |
8% |
20% |
16% |
11% |
10% |
(Source: FAST Graphs, FactSet)
Rolling Returns Since May 1995
NTIOF is a very consistent market beater, with average long-term rolling returns of 13.5% to 14% but from bear market lows as high as 18% over the next 15 years and 23% over the next 10 years.
-
12.2X return in 15 years
-
8.1X return in 10 years
NTIOF 2024 Consensus Total Return Potential
FAST Graphs Fast Graphs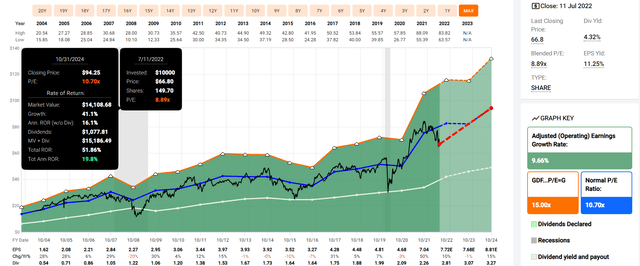
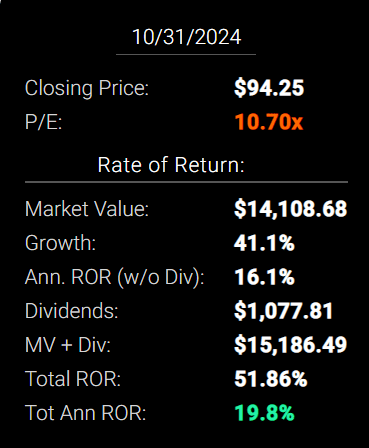
If NTIOF grows as analysts expect by 2024 and returns to historical mid-range fair value, it could deliver 52% total returns or 20% annually.
-
Buffett-like return potential from a blue-chip bargain hiding in plain sight
S&P 2024 Consensus Total Return Potential
FAST Graphs Fast Graphs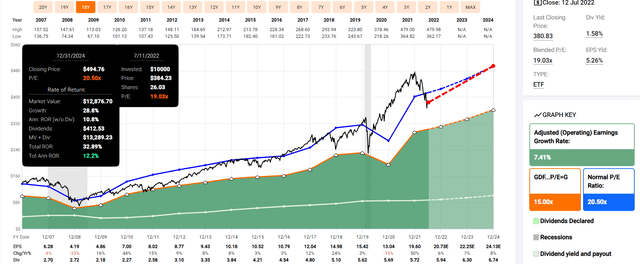
NTIOF has 1.6X higher consensus return potential over the next 2.5 years than the broader market.
NTIOF 2027 Consensus Total Return Potential
FAST Graphs FAST Graphs 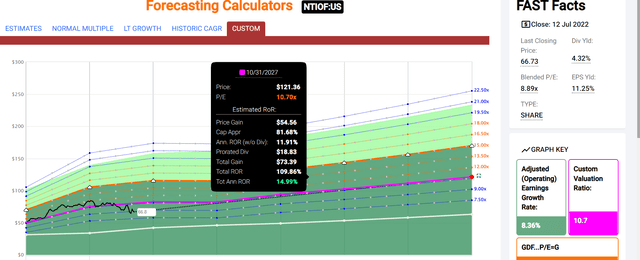
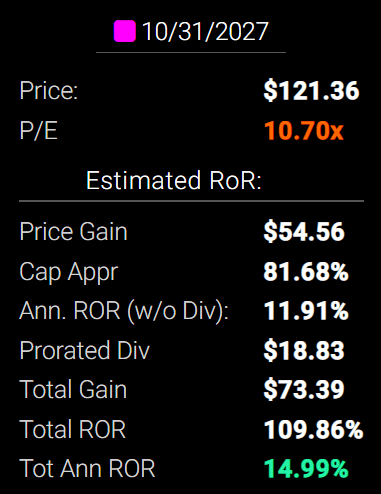
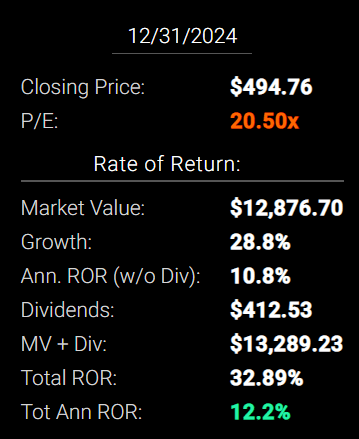
By 2027 if NTIOF grows as expected and returns to historical mid-range fair value, it could deliver 110% total returns or 15% annually.
2027 S&P 500 Consensus
|
Year |
Upside Potential By End of That Year |
Consensus CAGR Return Potential By End of That Year |
Probability-Weighted Return (Annualized) |
Inflation And Risk-Adjusted Expected Returns |
Expected Market Return Vs Historical Inflation-Adjusted Return |
|
2027 |
58.24% |
9.61% |
7.21% |
5.11% |
78.62% |
(Source: DK S&P 500 Valuation & Total Return Tool)
NTIOF Long-Term Consensus Total Return Potential (Ignoring Valuation)
|
Investment Strategy |
Yield |
LT Consensus Growth |
LT Consensus Total Return Potential |
Long-Term Risk-Adjusted Expected Return |
Long-Term Inflation And Risk-Adjusted Expected Returns |
Years To Double Your Inflation & Risk-Adjusted Wealth |
10-Year Inflation And Risk-Adjusted Expected Return |
|
National Bank of Canada |
4.4% |
8.8% |
13.2% |
9.2% |
6.8% |
10.6 |
1.93 |
|
Dividend Aristocrats |
2.4% |
8.5% |
10.9% |
7.6% |
5.2% |
14.0 |
1.65 |
|
S&P 500 |
1.7% |
8.5% |
10.2% |
7.1% |
4.7% |
15.4 |
1.58 |
|
Nasdaq |
1.0% |
12.7% |
13.7% |
9.6% |
7.1% |
10.1 |
1.99 |
(Sources: Morningstar, FactSet, YCharts)
Analysts expect NTIOF to deliver 13.2% long-term returns, similar to what it’s delivered historically since 1995, more than most popular investment strategies such as the aristocrats, S&P and almost matching the Nasdaq.
NTIOF Total Returns Since May 1995
NTIOF’s historical 15.2% CAGR total return includes the current 25% bear market.
-
47X return since 1995
-
24.5X adjusted for inflation
-
about 4X more than the S&P 500
A Dividend Growth Blue-Chip You Can Trust
|
Portfolio |
1996 Income Per $1,000 Investment |
2022 Income Per $1,000 Investment |
Annual Income Growth |
Starting Yield |
2022 Yield On Cost |
|
S&P 500 |
$27 |
$186 |
7.71% |
2.7% |
18.6% |
|
National Bank of Canada |
$50 |
$1,910 |
15.04% |
5.0% |
191.0% |
(Source: Portfolio Visualizer Premium)
NTIOF has grown its dividend income (including dividend reinvestment) at 2X the rate of the S&P 500 for 26 years. A 5% yield in 1996 is now almost a 200% yield on cost.
-
including 2022 $7,024 in total dividends per $1,000 initial investment in 1995
-
vs $858 for the S&P 500
-
8.2X more dividend income for long-term investors than the S&P 500
What about the future?
|
Analyst Consensus Income Growth Forecast |
Risk-Adjusted Expected Income Growth |
Risk And Tax-Adjusted Expected Income Growth |
Risk, Inflation, And Tax Adjusted Income Growth Consensus |
|
13.1% |
9.1% |
7.8% |
5.2% |
(Source: DK Research Terminal, FactSet)
Analysts expect 13% income growth from NTIOF in the future, which, when adjusted for the risk of it not growing as expected, inflation and taxes is about 5.2% real expected income growth.
Now compare that to what they expect from the S&P 500.
|
Time Frame |
S&P Inflation-Adjusted Dividend Growth |
S&P Inflation-Adjusted Earnings Growth |
|
1871-2021 |
1.6% |
2.1% |
|
1945-2021 |
2.4% |
3.5% |
|
1981-2021 (Modern Falling Rate Era) |
2.8% |
3.8% |
|
2008-2021 (Modern Low Rate Era) |
3.5% |
6.2% |
|
FactSet Future Consensus |
2.0% |
5.2% |
(Sources: S&P, FactSet, Multipl.com)
-
1.7% tax and inflation-adjusted real income growth
What about a 60/40 retirement portfolio?
-
0.5% consensus inflation, risk, and tax-adjusted income growth.
In other words, NTIOF is expected to generate about 3X faster real income growth than the S&P 500 and 10.5X faster income growth than a 60/40.
-
with 2.5X the safer yield on day one
What inflation-adjusted returns do analysts expect in the future?
Inflation-Adjusted Consensus Return Potential: $1,000 Initial Investment
|
Time Frame (Years) |
7.6% CAGR Inflation-Adjusted S&P Consensus |
8.4% Inflation-Adjusted Aristocrats Consensus |
10.7% CAGR Inflation-Adjusted NTIOF Consensus |
Difference Between Inflation-Adjusted NTIOF Consensus Vs S&P Consensus |
|
5 |
$1,445.67 |
$1,493.29 |
$1,664.66 |
$218.99 |
|
10 |
$2,089.97 |
$2,229.92 |
$2,771.11 |
$681.13 |
|
15 |
$3,021.42 |
$3,329.92 |
$4,612.96 |
$1,591.54 |
|
20 |
$4,367.98 |
$4,972.54 |
$7,679.02 |
$3,311.04 |
|
25 |
$6,314.67 |
$7,425.45 |
$12,782.99 |
$6,468.32 |
|
30 |
$9,128.95 |
$11,088.36 |
$21,279.38 |
$12,150.43 |
(Source: DK Research Terminal, FactSet)
Analysts think NTIOF is capable of 21X inflation-adjusted returns over the next 30 years.
|
Time Frame (Years) |
Ratio Aristocrats/S&P Consensus |
Ratio Inflation-Adjusted NTIOF Consensus vs S&P consensus |
|
5 |
1.03 |
1.15 |
|
10 |
1.07 |
1.33 |
|
15 |
1.10 |
1.53 |
|
20 |
1.14 |
1.76 |
|
25 |
1.18 |
2.02 |
|
30 |
1.21 |
2.33 |
(Source: DK Research Terminal, FactSet)
Which is potentially 2.3X more than the S&P 500 and 2X more than the dividend aristocrats
NTIOF Investment Decision Score
Dividend Kings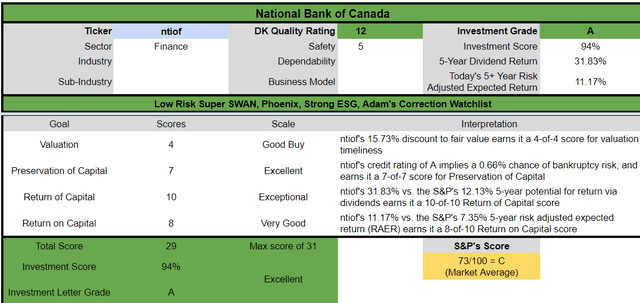
For anyone comfortable with its risk profile, NTIOF is one of the most reasonable and prudent high-yield blue-chips you can buy right now.
-
16% discount vs 4% market discount = 12% better valuation
-
4.4% yield vs 1.7% yield (but a much safer yield), 2.5X higher safe yield
-
potentially 30% higher long-term return potential than S&P 500 overtime
-
50% better risk-adjusted expected annual returns over the next five years
-
32% of your investment repaid in consensus dividends within five years, almost 3X more than the S&P 500
Reason Two: One Of The Highest Quality Companies On Earth
There are many ways to measure safety and quality and we factor in pretty much all of them.
The Dividend Kings’ overall quality scores are based on a 253-point model that includes:
-
Dividend safety
-
Balance sheet strength
-
Credit ratings
-
Credit default swap medium-term bankruptcy risk data
-
Short and long-term bankruptcy risk
-
Accounting and corporate fraud risk
-
Profitability and business model
-
Growth consensus estimates
-
Management growth guidance
-
Historical earnings growth rates
-
Historical cash flow growth rates
-
Historical dividend growth rates
-
Historical sales growth rates
-
Cost of capital
-
GF Scores
-
Long-term risk-management scores from MSCI, Morningstar, FactSet, S&P, Reuters’/Refinitiv, and Just Capital
-
Management quality
-
Dividend-friendly corporate culture/income dependability
-
Long-term total returns (a Ben Graham sign of quality)
-
Analyst consensus long-term return potential
In fact, it includes over 1,000 fundamental metrics including the 12 rating agencies we use to assess fundamental risk.
-
credit and risk management ratings make up 41% of the DK safety and quality model
-
dividend/balance sheet/risk ratings make up 82% of the DK safety and quality model
How do we know that our safety and quality model works well?
During the two worst recessions in 75 years, our safety model 87% of blue-chip dividend cuts, the ultimate baptism by fire for any dividend safety model.
How does NTIOF score on our comprehensive safety and quality models?
National Bank Of Canada Dividend Safety
|
Rating |
Dividend Kings Safety Score (162 Point Safety Model) |
Approximate Dividend Cut Risk (Average Recession) |
Approximate Dividend Cut Risk In Pandemic Level Recession |
|
1 – unsafe |
0% to 20% |
over 4% |
16+% |
|
2- below average |
21% to 40% |
over 2% |
8% to 16% |
|
3 – average |
41% to 60% |
2% |
4% to 8% |
|
4 – safe |
61% to 80% |
1% |
2% to 4% |
|
5- very safe |
81% to 100% |
0.5% |
1% to 2% |
|
NTIOF |
97% |
0.50% |
1.20% |
|
Risk Rating |
Low-Risk (80th industry percentile risk-management consensus) |
A stable outlook credit rating 0.66% 30-year bankruptcy risk |
15% OR LESS Max Risk Cap Recommendation |
Long-Term Dependability
|
Company |
DK Long-Term Dependability Score |
Interpretation |
Points |
|
Non-Dependable Companies |
21% or below |
Poor Dependability |
1 |
|
Low Dependability Companies |
22% to 60% |
Below-Average Dependability |
2 |
|
S&P 500/Industry Average |
61% (61% to 70% range) |
Average Dependability |
3 |
|
Above-Average |
71% to 80% |
Very Dependable |
4 |
|
Very Good |
81% or higher |
Exceptional Dependability |
5 |
|
NTIOF |
86% |
Exceptional Dependability |
5 |
Overall Quality
|
NTIOF |
Final Score |
Rating |
|
Safety |
97% |
5/5 very safe |
|
Business Model |
50% |
2/3 narrow and stable moat |
|
Dependability |
86% |
5/5 exceptional |
|
Total |
90% |
12/13 Super SWAN |
|
Risk Rating |
3/3 Low-Risk |
|
|
10% OR LESS Max Risk Cap Rec |
10% Margin of Safety For A Potentially Good Buy |
NTIOF is the 79th highest quality company on the DK 500 Masterlist.
How significant is this? The DK 500 Master List is one of the world’s best watchlists including
-
every dividend aristocrat (S&P companies with 25+ year dividend growth streaks)
-
every dividend champion (every company, including foreign, with 25+ year dividend growth streaks)
-
every dividend king (every company with 50+ year dividend growth streaks)
-
every foreign aristocrat (every company with 20+ year dividend growth streaks)
-
every Ultra SWAN (wide moat aristocrats, as close to perfect quality companies as exist)
-
40 of the world’s best growth stocks
In other words, even among the world’s best companies, NTIOF is higher quality than 84% of them.
Why I Trust National Bank Of Canada And So Can You
The National Bank of Canada was founded in Montreal, Quebec, in 1859. Over those 163 years that have seen it survive and thrive through:
-
dozens of global recessions
-
several depressions two world wars
-
a global pandemic that killed 5% of humanity
-
dozens of bear markets
-
hundreds of market corrections and pullbacks
This bank is built to last and will likely outlive us all.
NTIOF is the 6th largest bank in Canada, basically the regional banking king of the country.
NTIOF is the smallest of the six systemically important banks regulated so carefully by the Office of the Superintendent of Financial Institutions or OSFI.
-
the regulators who for decades have kept Canada’s banks among the safest public banks on earth
It has:
-
469 branches
-
27,804 employees
-
2.7 million customers
-
$282 billion in assets
-
$594 billion in assets under custody and administration
-
38% of revenue and 33% of net income is from traditional banking
-
27% of revenue and 32% of net income is from financial markets (like IPO and bond offering underwriting)
-
24% of revenue and 19% of net income is from wealth management
-
11% of revenue and 16% of net income is from the US and international operations
-
85% of revenue and 77% of operating income is from Canada
-
8% of revenue and 14% of operating income is from the US
-
7% of revenue and 9% of operating income is from outside of North America
In the most recent quarter NTIOF’s fundamentals were very impressive:
-
51.8% efficient ratio (non-interest expenses/revenue)
-
vs 61% for US banks and 59% for the world’s 100 largest banks
A Strong Balance Sheet
Tier 1 capital reserves are the new gold standard of measuring banking safety under the Basel III financial accords.
-
OSFI requires an 8% minimum Tier 1 capital ratio for its six largest banks
-
NTIOF’s is almost 2X that
This bank’s underwriting is so conservative that its earnings tend to be more stable than its larger peers.
|
Bank |
Great Recession EPS Decline |
Pandemic EPS Decline |
Debt/Capital |
S&P Credit Rating |
30-Year Bankruptcy Risk |
|
National Bank of Canada |
-20% |
-3% |
39% |
A Stable |
0.66% |
|
Toronto Dominion Bank |
-33% |
-18% |
15% |
AA- stable |
0.55% |
|
Royal Bank of Canada |
-26% |
-10% |
14% |
AA- stable |
0.55% |
|
Bank of Nova Scotia |
-23% |
-23% |
18% |
A+ stable |
0.60% |
|
Bank of Montreal |
-46% |
-16% |
4% |
A+ stable |
0.60% |
|
Canadian Imperial Bank of Commerce |
-37% |
-17% |
28% |
A+ stable |
0.60% |
|
JPMorgan Chase |
-69% |
-17% |
36% |
A- Positive |
2.50% |
|
Bank of America |
-106% |
-32% |
35% |
A- Positive |
2.50% |
|
Citigroup |
-119% |
-39% |
37% |
BBB+ stable |
5% |
|
Wells Fargo |
-70% |
-90% |
40% |
BBB+ stable |
5% |
|
Average |
-55% |
-27% |
26.6% |
A- Stable |
1.86% |
|
Average US Mega Bank |
-91% |
-45% |
37% |
BBB+ stable |
3.75% |
|
Average Canadian Mega Bank |
-31% |
-15% |
18% |
A+ stable |
0.59% |
(Sources: S&P, FactSet, FAST Graphs)
Even the smallest Canadian large bank is safer than the largest US banking giant according to S&P and all the rating agencies.
-
and the facts back that up
-
half the leverage
-
66% smaller Pandemic earnings declines
-
66% smaller Great Recession earnings declines
-
84% lower 30-year bankruptcy risk
If you want a safe bank, you can’t go wrong with any of Canada’s 6 largest financial giants.
“We are committed to delivering sustainable dividend increases to our shareholders, demonstrating the earnings power we see in our business model…
“So providing also our shareholders with a sustainable dividend growth is also part of our strategy…
This morning, we announced a $0.05 or 6% increase to our common share dividend, bringing it to $0.92.” – National Bank of Canada CEO, Q1 conference call
Quantitative Analysis: The Math Backing Up The Investment Thesis
Ben Graham recommended combining qualitative (the story) analysis with quantitative analysis looking at the past, present, and likely future.
NTIOF Credit Ratings
|
Rating Agency |
Credit Rating |
30-Year Default/Bankruptcy Risk |
Chance of Losing 100% Of Your Investment 1 In |
|
S&P |
A Stable Outlook |
0.66% |
151.5 |
|
Fitch |
A+ Stable Outlook |
0.60% |
166.7 |
|
Moody’s |
Aa3 (AA- equivalent) Stable Outlook |
0.55% |
181.8 |
|
DBRS |
AA Stable |
0.51% |
196.1 |
|
Consensus |
A+ Stable Outlook |
0.58% |
172.4 |
(Source: S&P, Fitch, Moody’s)
Four rating agencies estimate NTIOF’s long-term bankruptcy risk at 0.58% or a 1 in 172 chance of losing all your money investing in this company.
NTIOF Credit Default Swaps: Real-Time Fundamental Risk Analysis From The Bond Market
FactSet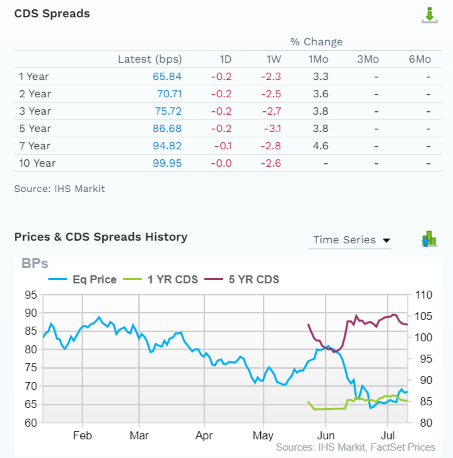
Credit default Swaps are the insurance policies bond investors take out against default.
-
they represent real-time fundamental risk assessment from the “smart money” on Wall Street
-
NTIOF’s fundamental risk has been stable in this bear market
-
the bond market is pricing in a 3% 30-year default risk, which is consistent with an A- credit rating, equal to JPM and BAC’s
-
basically, analysts, rating agencies, and the bond market all agree
-
NTIOF’s thesis is intact
-
14 analysts, 7 rating agencies, and the bond market make up our NTIOF expert consensus
-
21 expert consensuses + the bond market monitoring NTIOF’s risk profile
-
how we track fundamental risk in real-time
-
to ensure high-probability/low-risk investment recommendations
NTIOF GF Score: The Newest Addition To The DK Safety And Quality Model
The GF Score is a ranking system that has been found to be closely correlated to the long-term performances of stocks by backtesting from 2006 to 2021.” – Gurufocus
GF Score takes five key aspects into consideration. They are:
-
Financial Strength
-
Profitability
-
Growth
-
Valuation
-
Momentum
NTIOF’s good score of 70/100 confirms its strong fundamental quality and relatively reasonable valuation.
NTIOF Profitability: Wall Street’s Favorite Quality Proxy
NTIOF’s profitability is historically in the top 50% of its peers
However, its profitability is a lot more impressive than it initially appears.
NTIOF Trailing 12-Month Profitability Vs Peers
|
Metric |
TTM |
Industry Percentile |
Major Banks More Profitable Than NTIOF (Out Of 1,471) |
|
Net Margins |
36.85% |
78.88 |
311 |
|
Return On Equity |
17.42% |
88.81 |
165 |
|
Return On Assets |
0.96% |
50.24 |
732 |
|
Average |
18.41% |
72.64 |
402 |
(Source: GuruFocus Premium)
In the last year, NTIOF’s profitability was in the 73rd percentile, just shy of achieving a wide moat rating.
-
which would make it an Ultra SWAN, just like all the other Canadian banking giants
NTIOF’s net margins have been climbing relativity steadily for 30 years, rising to 37%, one of the most profitable companies on earth.
In fact, NTIOF has the 2nd highest net margins of any big Canadian bank, behind only BMO at 39%.
-
its profit margin is 10% to 11% better than C and WFC’s
-
the median profit margin for global banks is 27%
NTIOF Profit Margin Consensus Forecast
|
Year |
EBIT (Operating) Margin |
Net Margin |
|
2020 |
48.0% |
28.0% |
|
2021 |
46.8% |
34.9% |
|
2022 |
47.8% |
33.5% |
|
2023 |
47.7% |
31.5% |
|
2024 |
NA |
31.0% |
|
Annualized Growth |
-0.21% |
2.60% |
|
Annualized Growth (Post Pandemic) |
0.98% |
-3.93% |
(Source: FactSet Research Terminal)
Analysts expect operating margins to remain stable over time though net margins are expected to decrease a bit though remain at well over 30%, far above the median for global banks.
-
further confirming the narrow and stable moat
Reason Three: Industry Leading Growth Prospects For Years To Come
Recessions bring with them falling interest rates, rising loan defaults, and concerns that banks will have trouble growing. NTIOF has proven it can successfully adapt to a low rate, high financial regulation world better than any other big CA bank.
NTIOF Medium-Term Growth Consensus Forecast
|
Year |
Sales |
EBIT (Operating Income) |
Net Income |
|
2020 |
$6,125 |
$2,939 |
$1,712 |
|
2021 |
$7,151 |
$3,344 |
$2,498 |
|
2022 |
$7,662 |
$3,661 |
$2,569 |
|
2023 |
$8,003 |
$3,816 |
$2,522 |
|
2024 |
$8,256 |
$2,557 |
|
|
Annualized Growth |
7.75% |
9.09% |
10.55% |
|
Annualized Growth (Post Pandemic) |
4.91% |
6.82% |
0.78% |
|
Cumulative Over The Next 3 Years |
$23,921 |
$7,477 |
$7,648 |
(Source: FactSet Research Terminal)
Like most banks, coming out of the pandemic saw a very strong recovery in the top and bottom line.
Looking outside the Pandemic NTIOF has modest sales growth, decent operating income growth, and tepid net margin growth.
NTIOF Dividend Growth Consensus Forecast
|
Year |
Dividend Consensus |
EPS Consensus |
EPS Payout Ratio |
Retained (Post-Dividend) Earnings |
Buyback Potential |
|
2022 |
$2.77 |
$7.57 |
36.6% |
$1,618 |
5.52% |
|
2023 |
$3.03 |
$7.55 |
40.1% |
$1,523 |
5.20% |
|
2024 |
$3.15 |
$8.15 |
38.7% |
$1,685 |
5.75% |
|
Total 2022 Through 2024 |
$8.95 |
$23.27 |
38.5% |
$4,825.84 |
16.48% |
|
Annualized Rate |
6.64% |
3.76% |
2.77% |
2.06% |
2.06% |
(Source: FactSet Research Terminal)
50% is the safety guideline for EPS payout ratios for banks according to rating agencies.
-
40% to 50% is the official range most CA banks use for their payout ratio policies
NTIOF’s payout ratio is expected to remain stable at about 39%, a very safe level, especially considering its relative earnings stability in recessions.
-
a 60% decline in earnings means that NTIOF’s dividend would remain sustainable
-
during the Great Recession, earnings declined just 20%
Over the next three years, analysts expect 6.6% annual dividend growth and NTIOF to retain about $5 billion in post-dividend earnings. That’s enough to potentially buy back up to 16.5% of shares at current valuations.
NTIOF Buyback Consensus Forecast
|
Year |
Consensus Buybacks ($ Millions) |
% Of Shares (At Current Valuations) |
Market Cap |
|
2022 |
$236.0 |
0.8% |
$29,292 |
|
Total 2022-2022 |
$236.00 |
0.8% |
$29,292 |
|
Annualized Rate |
0.80% |
Average Annual Buybacks |
$236.00 |
(Source: FactSet Research Terminal)
Analysts only have forecasts for this year’s buybacks which they think will be $236 million, enough to repurchase almost 1% of shares at current valuations.
CA banks are famous for safe, generous, and growing dividends, not buybacks.
That’s the focus of large US banks like Citigroup (C), which has bought back 36% of its net shares over the last five years.
-
CA banks tend to buyback less than 1% of shares per year
NTIOF Long-Term Growth Outlook
-
the average growth consensus from 13 out of 14 analysts is 8.8%
-
slightly faster than the last five years
-
net interest margin (average loan rate – average borrowing cost) has risen from 1.55% in 2014 to 1.67% last year
-
and is expected to rise to 2.04% by 2024
-
thanks to rising rates in general (both CA and globally)
How accurate are analyst forecasts for NTIOF (including based on management guidance)?
-
Smoothing for outliers historical analyst margins-of-error are 25% to the downside and 10% to the upside
-
margin-of-error adjusted consensus growth range: 6% to 10% CAGR
-
70% statistical probability that NTIOF grows 6% to 10% over time
NTIOF’s historical growth rates since the Financial Crisis have been 9.1% CAGR, similar to what analysts expect in the future.
It’s also the fastest-growing large Canadian bank over time.
|
Bank |
Growth Since the Great Recession |
5 Year Growth Rate |
20-Year Growth Rate |
|
National Bank of Canada |
9.10% |
16.58% |
11.06% |
|
Toronto Dominion Bank |
9.36% |
11.04% |
9.31% |
|
Royal Bank of Canada |
8.18% |
11.38% |
10.71% |
|
Bank of Nova Scotia |
5.37% |
6.40% |
8.09% |
|
Bank of Montreal |
9.47% |
12.36% |
9.32% |
|
Canadian Imperial Bank of Commerce |
5.02% |
8.03% |
7.17% |
|
JPMorgan Chase |
20.43% |
19.93% |
11.80% |
|
Bank of America |
15.47% |
18.94% |
1.85% |
|
Citigroup |
10.15% |
16.53% |
-4.77% |
|
Wells Fargo |
15.62% |
4.41% |
8.35% |
|
Average |
10.82% |
12.56% |
7.29% |
|
Average US Mega Bank |
15.42% |
14.95% |
4.31% |
|
Average Canadian Mega Bank |
7.75% |
10.97% |
9.28% |
(Source: FAST Graphs, FactSet Research)
Canadian Banks have been growing at pretty much the same rate as pre-Great Recession, despite low-interest rates and even more strenuous financial regulations.
NTIOF is expected to keep growing at its historical rate of about 9% in the future.
Reason Four: A Wonderful Company At A Wonderful Price
CA banks are famous for very steady and narrow fair value ranges over time. For 20 years, regardless of interest rates, or regulatory environments, or even growth rates, NTIOF has been valued by tens of millions of investors at 10.4X to 10.9X earnings, outside of bear markets and bubbles.
-
91% statistical probability the intrinsic value is between 10.4 and 10.9X earnings
|
Metric |
Historical Fair Value Multiples (all-Years) |
2020 |
2021 |
2022 |
2023 |
12-Month Forward Fair Value |
|
5-Year Average Yield (Pure Industry Bear Market) |
3.78% |
$58.20 |
$77.07 |
$77.07 |
$77.07 |
|
|
PE |
10.70 |
$54.36 |
$76.29 |
$80.89 |
$81.86 |
|
|
Average |
$56.21 |
$76.68 |
$78.94 |
$79.39 |
$79.18 |
|
|
Current Price |
$66.73 |
|||||
|
Discount To Fair Value |
-18.71% |
12.98% |
15.46% |
15.95% |
15.73% |
|
|
Upside To Fair Value (NOT Including Dividends) |
-15.76% |
14.91% |
18.29% |
18.98% |
18.66% (23% including dividend) |
|
|
2022 EPS |
2023 EPS |
2022 Weighted OCF |
2023 Weighted OCF |
12-Month Forward PE |
12-Month Average Fair Value Forward PE |
Current Forward PE |
|
$7.56 |
$7.65 |
$3.49 |
$4.12 |
$7.61 |
10.41 |
8.77 |
We estimate NTIOF is worth about 10.4X earnings, the low end of its historical fair value range. Today it trades at just 8.8, very close to anti-bubble valuations.
|
Analyst Median 12-Month Price Target |
Morningstar Fair Value Estimate |
|
$80.18 (10.5 PE) |
$82.97 (10.9 PE) – Pure Quant Rating, No Analyst Coverage |
|
Discount To Price Target (Not A Fair Value Estimate) |
Discount To Fair Value |
|
16.77% |
19.57% |
|
Upside To Price Target (Not Including Dividend) |
Upside To Fair Value (Not Including Dividend) |
|
20.16% |
24.34% |
|
12-Month Median Total Return Price (Including Dividend) |
Fair Value + 12-Month Dividend |
|
$83.09 |
$85.16 |
|
Discount To Total Price Target (Not A Fair Value Estimate) |
Discount To Fair Value + 12-Month Dividend |
|
19.69% |
21.64% |
|
Upside To Price Target ( Including Dividend) |
Upside To Fair Value + Dividend |
|
24.52% |
27.62% |
Morningstar’s fair value estimate is purely quant-based comparison to its peers and estimates NTIOF is worth the upper end of its historical range.
Analysts expect a PE of 10.5 in 12 months and a 25% total return.
-
23% total return in the next year would be justified by fundamentals
We don’t base recommendations on 12-month forecasts but on whether the margin of safety is sufficient to compensate you for a company’s risk profile.
|
Rating |
Margin Of Safety For Low-Risk 12/13 Super SWAN quality companies |
2022 Fair Value Price |
2023 Fair Value Price |
12-Month Forward Fair Value |
|
Potentially Reasonable Buy |
0% |
$78.94 |
$79.39 |
$79.18 |
|
Potentially Good Buy |
10% |
$71.04 |
$71.45 |
$71.26 |
|
Potentially Strong Buy |
20% |
$63.15 |
$63.51 |
$63.35 |
|
Potentially Very Strong Buy |
30% |
$49.73 |
$55.57 |
$55.43 |
|
Potentially Ultra-Value Buy |
40% |
$47.36 |
$47.64 |
$47.51 |
|
Currently |
$66.73 |
15.46% |
15.95% |
15.73% |
|
Upside To Fair Value (Not Including Dividends) |
18.29% |
18.98% |
18.66% |
For anyone comfortable with its risk profile, NTIOF is a potentially good buy.
Risk Profile: Why National Bank of Canada Isn’t Right For Everyone
There are no risk-free companies and no company is right for everyone. You have to be comfortable with the fundamental risk profile.
What Could Cause NTIOF’s Investment Thesis To Break
-
safety falls to 40% or less
-
balance sheet collapses (highly unlikely, 0.6% probability according to rating agencies)
-
Canadian economy implodes (such as from a housing market meltdown)
-
growth outlook falls to less than 5.6% for six years
-
NTIOF’s role in my portfolio is to deliver long-term 10+% returns with minimal fundamental risk
-
8+% total return requirement for defensive sectors (including midstream)
-
10+% for non-defensive (cyclical) sectors – like financials
How long it takes for a company’s investment thesis to break depends on the quality of the company.
|
Quality |
Years For The Thesis To Break Entirely |
|
Below-Average |
1 |
|
Average |
2 |
|
Above-Average |
3 |
|
Blue-Chip |
4 |
|
SWAN |
5 |
|
Super SWAN |
6 |
|
Ultra SWAN |
7 |
|
100% Quality Companies (MSFT, LOW, and MA) |
8 |
These are my personal rule of thumb for when to sell a stock if the investment thesis has broken. NTIOF is highly unlikely to suffer such catastrophic declines in fundamentals.
Canadian Bank Risk Profile Summary
“The Canadian banks face two primary risks: macroeconomic risks and risks related to future acquisitions. We see macroeconomic risks related to the credit and debt cycle, which are largely out of management’s control and are related to the eventual turning of the housing market.
The leverage of the Canadian consumer is also a risk. Once the economic cycle turns, this could result in greater potential for consumer defaults as well as a longer period of decreased economic demand as consumers repair their own finances. Toronto-Dominion does have relatively lower exposure to the uninsured domestic real estate market in Canada, putting it in a less risky position in a downturn.
From an ESG perspective, commercial banks are expected to have strong product governance. Predatory or discriminatory lending practices are examples of poor product governance, and this can affect certain banks at times.
We assign the Canadian banks we cover a medium uncertainty rating, which we think captures the spread between our bull and bear cases relative to our base case.” – Morningstar
NTIOF’s Risk Profile Includes
-
economic cyclicality risk (loan defaults rise in recessions, though NTIOF’s earnings are the most stable of any large CA bank’s)
-
CA macro risk: highly leveraged economy could result in relatively worse future recessions
-
regulatory risk (potentially increasing costs and decreasing pricing power, capital requirements have been raised numerous times)
-
M&A execution risk (CA banks are not permitted to merge, but small foreign tuck-in acquisitions are frequent)
-
talent retention risk in the tightest job market in 50 years
-
cyber-security risk: hackers and ransomware
-
currency risk: including the dividend
-
global expansion risk: profitability outside of CA is not as high due to far more competition
Canada’s mortgage debt/GDP is 92%. In the US it’s 82%.
US mortgages tend to be 15 or 30 years and fixed. CA mortgages tend to be fixed for 5 years.
Canada’s housing price situation has, historically, been worse than America’s.
-
though lending standards are much stricter
-
not much chance (though non-zero) of a housing crisis in Canada
-
which could stress CA banks more than any recent recession
How do we quantify, monitor, and track such a complex risk profile? By doing what big institutions do.
Long-Term Risk Analysis: How Large Institutions Measure Total Risk
-
see the risk section of this video to get an in-depth view (and link to two reports) of how DK and big institutions measure long-term risk management by companies
NTIOF Long-Term Risk-Management Consensus
|
Rating Agency |
Industry Percentile |
Rating Agency Classification |
|
Morningstar/Sustainalytics 20 Metric Model |
90.7% |
15.1/100 Low-Risk |
|
Reuters’/Refinitiv 500+ Metric Model |
87.8% |
Good |
|
S&P 1,000+ Metric Model |
62.0% |
Above-Average, Stable Trend |
|
FactSet |
70.0% |
Above-Average, Negative Trend |
|
Morningstar Global Percentile (All 15,000 Rated Companies) |
90.6% |
Excellent |
|
Consensus |
80% |
Low-Risk, Very Good Risk-Management, Stable Trend |
(Sources: Morningstar, FactSet, S&P, Reuters)
NTIOF’s Long-Term Risk Management Is The 74th Best In The Master List (85th Percentile)
|
Classification |
Average Consensus LT Risk-Management Industry Percentile |
Risk-Management Rating |
|
S&P Global (SPGI) #1 Risk Management In The Master List |
94 |
Exceptional |
|
National Bank of Canada |
80 |
Very Good |
|
Strong ESG List |
78 |
Good – Bordering On Very Good |
|
Foreign Dividend Stocks |
75 |
Good |
|
Ultra SWANs |
71 |
Good |
|
Low Volatility Stocks |
68 |
Above-Average |
|
Dividend Aristocrats |
67 |
Above-Average |
|
Dividend Kings |
63 |
Above-Average |
|
Master List average |
62 |
Above-Average |
|
Hyper-Growth stocks |
61 |
Above-Average |
|
Monthly Dividend Stocks |
60 |
Above-Average |
|
Dividend Champions |
57 |
Average |
(Source: DK Research Terminal)
NTIOF’s risk-management consensus is in the top 15% of the world’s highest quality companies and similar to that of such other blue-chips as:
-
Philip Morris International (PM) – dividend king
-
PepsiCo (PEP) – dividend king
-
AbbVie (ABBV) – dividend king
-
Dover (DOV) – dividend king
-
Target (TGT) – dividend king
-
Automatic Data Processing (ADP) – dividend aristocrat
-
Royal Bank of Canada (RY) – Ultra SWAN
-
Toronto-Dominion Bank (TD) – Ultra SWAN
-
Bank of Montreal (BMO) – Ultra SWAN
-
Canadian Imperial Bank of Commerce (CM) – Ultra SWAN
-
Texas Instruments (TXN) – Ultra SWAN
-
Qualcomm (QCOM) – Ultra SWAN
-
Visa (V) – Ultra SWAN
-
Apple (AAPL) – Ultra SWAN
-
Merck (MRK) – Ultra SWAN
-
Mastercard (MA) – Ultra SWAN
-
Cummins (CMI) – Ultra SWAN
-
Applied Materials (AMAT) – Ultra SWAN
-
Adobe (ADBE) – Ultra SWAN
-
Microsoft (MSFT) – Ultra SWAN
The bottom line is that all companies have risks, and NTIOF is very good at managing theirs.
How We Monitor NTIOF’s Risk Profile
-
14 analysts
-
4 credit rating agencies
-
7 total risk rating agencies
-
21 experts who collectively know this business better than anyone other than management
-
and the bond market for real-time fundamental risk updates
“When the facts change, I change my mind. What do you do sir?” – John Maynard Keynes
There are no sacred cows at iREIT or Dividend Kings. Wherever the fundamentals lead we always follow. That’s the essence of disciplined financial science, the math behind retiring rich and staying rich in retirement.
Bottom Line: National Bank Of Canada Is A High-Yield Blue-Chip Retirees Can Trust In A Recession
For seven months we’ve lived with accelerating inflation and soaring interest rates. As a result, according to Goldman Sachs, the S&P suffered its worst annualized inflation-adjusted decline since 1872 in the first half of the year.
Now we face the prospects of a potential mild recession coming in 2023 or potentially a bit earlier. The good news is that with corporate and consumer balance sheets their strongest in years (in some cases decades) we’ve never been more prepared for the recession that might be coming soon.
But no recession is easy, and millions suffer during such downturns. Companies die, dividends get slashed, and vast fortunes are lost forever.
-
according to Lipper Financial 33% of the US stock market is down 70+% and 10% is down 90+%
-
these are companies that JPMorgan thinks are likely to never recover
In turbulent economic times like these, when the “smart money” on Wall Street changes its mind at blistering speed, what’s a retiree to do?
The answer in both good times and bad is to focus on safety and quality first, and prudent valuation and sound risk-management always.
What works great in recessions and extreme bear markets, also works great over the entire economic cycle.
And that’s why we’re confident that anyone buying National Bank of Canada at today’s attractive 8.8X earnings will be pleased with the result in 5+ years.
Why?
Because while we can’t tell you when this blue-chip will bottom, or when the bear market will end, here’s what we can say with high confidence.
Stocks don’t stop falling because bad news stops coming but when the bad news is fully priced in.
Don’t try to buy at the bottom and sell at the top. This can’t be done – except by liars.” – Bernard Baruch
Here’s what all the best available data says about National Bank of Canada.
-
NTIOF is potentially one of the world’s safest, most dependable, and highest quality companies on earth, in my opinion
-
top 16% of the world’s best blue-chips
-
4.4% steadily growing very safe yield expected to grow about 9% over time
-
13.2% CAGR long-term total return potential similar to the last 27 years
-
16% discount to fair value = potential good buy
-
8.8X cash-adjusted earnings
-
about 110% consensus return potential over the next five years, 15% CAGR, about 2X more than the S&P 500
-
50% better annualized risk-adjusted expected returns of the S&P 500 over the next five years with 3X higher consensus dividend income
The simple fact is that recessions are unavoidable, and so are bear markets.
-
according to a study from Bank of America since 1926 those who attempted to time the market risked losing 94% of their money, adjusted for inflation
-
while the stock market went up 1,050X, adjusted for inflation
Over the last 20 years, 30 years, and 40 years, numerous studies from RIA, JPMorgan, Dalbar, and Citigroup all prove one thing without doubt.
Time in the market is FAR more important than timing the market. In fact, since 1960 being fully invested at all times beat 24-month dollar-cost averaging 74% of the time according to Nick Maggiulli, the Chief data scientist for Ritholtz Wealth Management.
According to Fidelity over the long-term 97% of blue-chip investors make money, 100% of index investors make money and 98% of short-term traders lose money.
Why?
Because in the short-term (1 year or less) luck is 33X as powerful as fundamentals. But over the long-term (30+ years) fundamentals are 33X as powerful as luck.
That’s why DK and iREIT are laser-focused on the one thing that matters in the end, the fundamentals of the companies you are entrusting your money too.
When it comes to sound banking, conservative underwriting, and industry-leading risk-management, it’s hard to beat the National Bank of Canada.
Author’s Note: Brad Thomas is a Wall Street writer, which means he’s not always right with his predictions or recommendations. Since that also applies to his grammar, please excuse any typos you may find. Also, this article is free: written and distributed only to assist in research while providing a forum for second-level thinking.
Be the first to comment