Paul Campbell
A long-overdue round of short covering is underway in the U.S. equity market, supported by several key technical indications. More importantly, next week’s Fed policy meeting could provide the fuel for an even bigger, more extended round of short covering.
True to form, stocks have surprised the consensus by rallying in the face of near-universal bearish sentiment on the part of retail investors. Indeed, talk of economic recession in mainstream media has recently hit levels not seen since the depths of the 2008-2009 credit crisis.
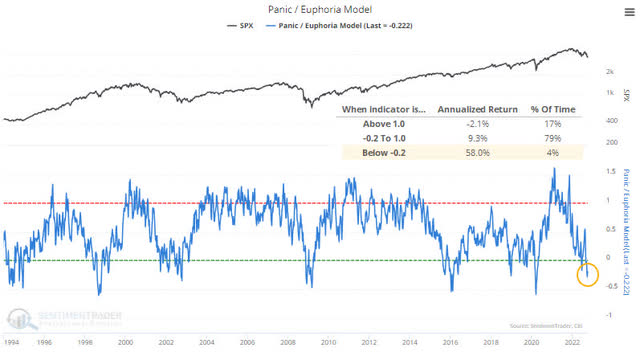
The buildup of bearish sentiment, coupled with near-record levels of put buying among retail options traders, created conditions ripe for a bull raid. According to SentimenTrader’s Jason Goepfert, his proprietary Panic/Euphoria Model recently fell to one of the lowest levels in nearly 30 years (i.e. in “panic” territory).
The model is based on extremes in behavior of options traders and, as you can see here, has signaled a major stock market low whenever it has hit current levels in the past few decades.

SentimenTrader
Jason notes that sentiment levels are similar to what they were in October 2008, which wasn’t the final low of the bear market. However, it did serve as the proverbial “beginning of the end,” as stocks put in their final low not long afterward. The panic-type positioning of options traders also suggests that there is likely limited downside ahead and far greater upside in the weeks ahead.
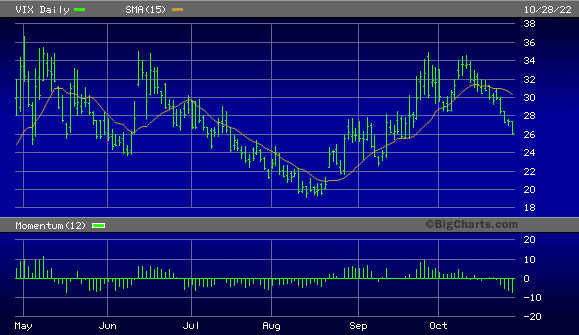
The Volatility Index (VIX) meanwhile is rapidly declining and is close to falling under the psychologically significant 25 level. Historically, the market environment for buying stocks is much healthier when the VIX is under 25 and trending lower.

BigCharts
But in what could be the biggest catalyst for a stock market rally going forward, central banks around the world are now showing signs of easing up on the tight monetary policies that have been a major headwind for equities.
Just this week, the Bank of Canada surprised the market when it announced a below-consensus interest rate increase. The Bank further indicated “it was getting closer to the end of its historic tightening campaign as it forecast the economy would stall over the next three quarters,” according to Reuters.
Wall Street has been conditioned by the Fed to expect a 75 basis point Fed Funds rate increase at the November FOMC meeting. Indeed, the CME FedWatch Tool, traders have assigned an 82% likelihood that the Fed will raise rates by 0.75% at the November meeting. Assuming it does, this would be the fourth consecutive time the central bank has hiked rates by this amount.
However, if the Bank of Canada’s recent policy reversal is any indication, there’s a chance the Fed decides to “pivot” and instead of hiking rates 75 basis points, raises them by a lower amount (50 basis points, for instance). This would almost certainly provide an additional short-covering catalyst for the market and would set up the November-December rally that is so typical of a post midterm election.
(In support of the Fed pivot scenario, San Francisco Fed President Mary Daly stated her opinion that slowing the pace of interest rate increases will “help preserve market structure,” while St. Louis Fed President Bullard said he wants to see the Fed “get a deflationary process going in 2023.”)
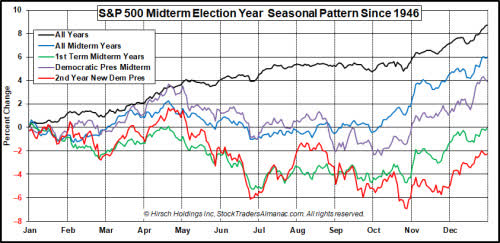
What’s more, back data show that midterm elections tend to be major turning points for the stock market regardless of which party wins. According to Stock Trader’s Almanac author Jeff Hirsch, “Midterm election years are usually a volatile year for stocks as Republicans and Democrats vie for control for Congress, especially under new presidents.”
Hirsch also noted that bear markets tend to bottom in October – and specifically around late October in the second year of a new Democrat president’s term – before turning higher in November and December, as illustrated in the following chart.

Stock Trader’s Almanac
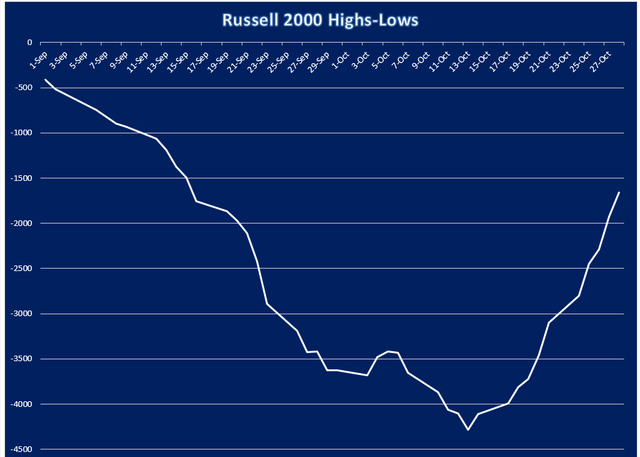
A final consideration is the technical improvement in the oversold small-cap segment of the stock market. The following chart shows the 4-week rate of change (momentum) of the number of Russell 2000 stocks making 52-week highs minus lows. This is my favorite measure of how much internal momentum the market has, and right now it shows that the bulls have an excellent opportunity to small-cap stocks higher in the near term.

Author’s Chart
Based on historical data, moreover, the major sectors that tend to outperform the S&P during the months following a midterm election are the materials, technology, industrials, healthcare and consumer discretionary sectors.
In conclusion, the pieces are lining up for what looks to be a vibrant fourth quarter performance in the broad equity market. An extended relief rally is long overdue – especially given the dramatically “oversold” nature of stocks in most sectors in recent months – and we’re entering what has historically proven to be a bullish period for equities. Accordingly, I’m on the lookout for buying opportunities in individual stocks for the first time in a long while, with a particular focus on the materials and consumer staples sectors.


Be the first to comment