

adaask
Both Ares Capital (NASDAQ:ARCC) and Oaktree Specialty Lending (NASDAQ:OCSL) have investment-grade (BBB- Stable from S&P) credit ratings, vaulting them into the upper echelon of quality Business Development Companies (i.e., BDCs) (BIZD). Both also happen to offer mouthwatering dividend yields, with ARCC boasting an 8.2% dividend yield and OCSL boasting an 8.8% dividend yield.
In this article, we will review their most recent quarterly results and then compare them side by side and offer our take on which one is more attractive.
Quarterly Results
ARCC’s Q2 results were very strong thanks to increased investment activity, rising interest rates, and solid investment credit performance. Core earnings per share beat consensus estimates by $0.02 and increased by $0.04 (9.5%) sequentially, though they were down 13.2% year-over-year. However, net investment income – the most important indicator of dividend coverage and sustainability – was up sharply. On a per share basis, it increased by 26.8% sequentially and by 33.3% year-over-year.
Meanwhile, OCSL posted adjusted investment income of $0.33 per share in its latest quarter. This was flat sequentially. Meanwhile, adjusted net investment income came in at $0.17 per share, down sequentially from $0.18.
Balance Sheet
As was already stated, both ARCC and OCSL have the same investment-grade credit rating and outlook from S&P, which puts them on similar footing in terms of perceived risk and access to capital.
ARCC has $4.6 billion in total liquidity (~21.3% of its enterprise value) with a leverage ratio of 1.23x. Only 27.7% of ARCC’s debt has a floating interest rate.
OCSL, meanwhile, has $489 million in total liquidity (~18.5% of its enterprise value) and a leverage ratio of 1.08x. 78.5% of OCSL’s debt has a floating interest rate.
While both appear to be in solid shape, OCSL seems to have the stronger balance sheet given its meaningfully lower leverage ratio. On the other hand, ARCC’s liquidity represents a slightly higher percentage of its enterprise value, and it also has much less exposure to rising interest rates. Essentially what it boils down to is that if interest rates remain neutral or decline from present levels, OCSL has the better positioned balance sheet. However, if interest rates continue to rise, ARCC is in a better position. Overall, we will consider this comparison to be a draw as we prefer ARCC’s greater protection against further increases in interest rates but at the same time value OCSL’s much lower leverage ratio which gives it more flexibility to invest opportunistically and better protection against downside scenarios.
Investment Portfolio
ARCC’s portfolio consists of 64% senior secured debt and 74% of its investments are floating rate. ARCC’s portfolio is overweight more defensive sectors, with its top five sectors being software, healthcare, commercial and professional services, insurance services, and power generation. Non-accruals were very low as of 6/30/22, amounting to just 0.9% at fair value and 1.6% at amortized cost.
OCSL’s portfolio consists of ~87% senior secured debt and 88% of its debt investments are floating rate, meaning that ~79% of the total investment portfolio benefits from rising interest rates. Similar to ARCC’s portfolio, OCSL’s portfolio is also mostly overweight more defensive sectors, with its top five sectors being software, pharmaceuticals, data processing, biotechnology, and healthcare. In fact, its portfolio looks even more defensively positioned given its greater emphasis on medical-related industries. The company continued its streak of flawless underwriting with 0 investments on non-accrual.
Overall, OCSL appears to have a significantly superior investment portfolio as it has much greater exposure to senior secured debt, fewer non-accruals, and a more defensively positioned sector allocation as well. On top of that, its greater exposure to rising interest rates helps to somewhat offset its greater exposure to rising interest rates in its outstanding debt.
Dividend Safety
Both companies hiked their dividends following announcing quarterly results. OCSL increased its dividend by 3% to $0.17 per share, and ARCC increased its dividend by 2.4% to $0.42 per share.
OCSL’s dividend coverage ratio is currently fairly tight at 1.06x. However, its interest rate sensitivity is much lower than ARCC’s given that it has greater balance between floating rate debt obligations and investments. As a result, especially when combined with its lower leverage and more conservatively positioned portfolio, its cash flow is likely to be more stable moving forward than ARCC’s will be.
ARCC’s dividend coverage ratio is phenomenal at present as its $0.52 per share in net investment income easily covered its $0.42 quarterly dividend at a 1.24x ratio. Furthermore, ARCC declared a $0.03 special dividend for the quarter and still has a lot of spillover income, further securing its dividend. As management stated on the earnings call:
we never talk about dividends beyond this quarter, but we felt highly confident in our ability to increase the dividend this quarter. And I’ll couple that by saying we’ve also built a pretty substantial amount of spillover income, as you’re aware of the company. And I don’t feel the need, frankly, to add any more to that number. I could argue that number might even be a little bit high, which is why we’ve been using it to pay a special dividend throughout this year. So we feel good about the earnings trajectory, and we feel good about the dividend where it is today and potentially growing from here.
Overall, we favor ARCC’s dividend safety here, but do note that OCSL is safer than its coverage otherwise suggests given its underwriting strength, balance interest rate exposure, and conservative leverage profile.
Track Record
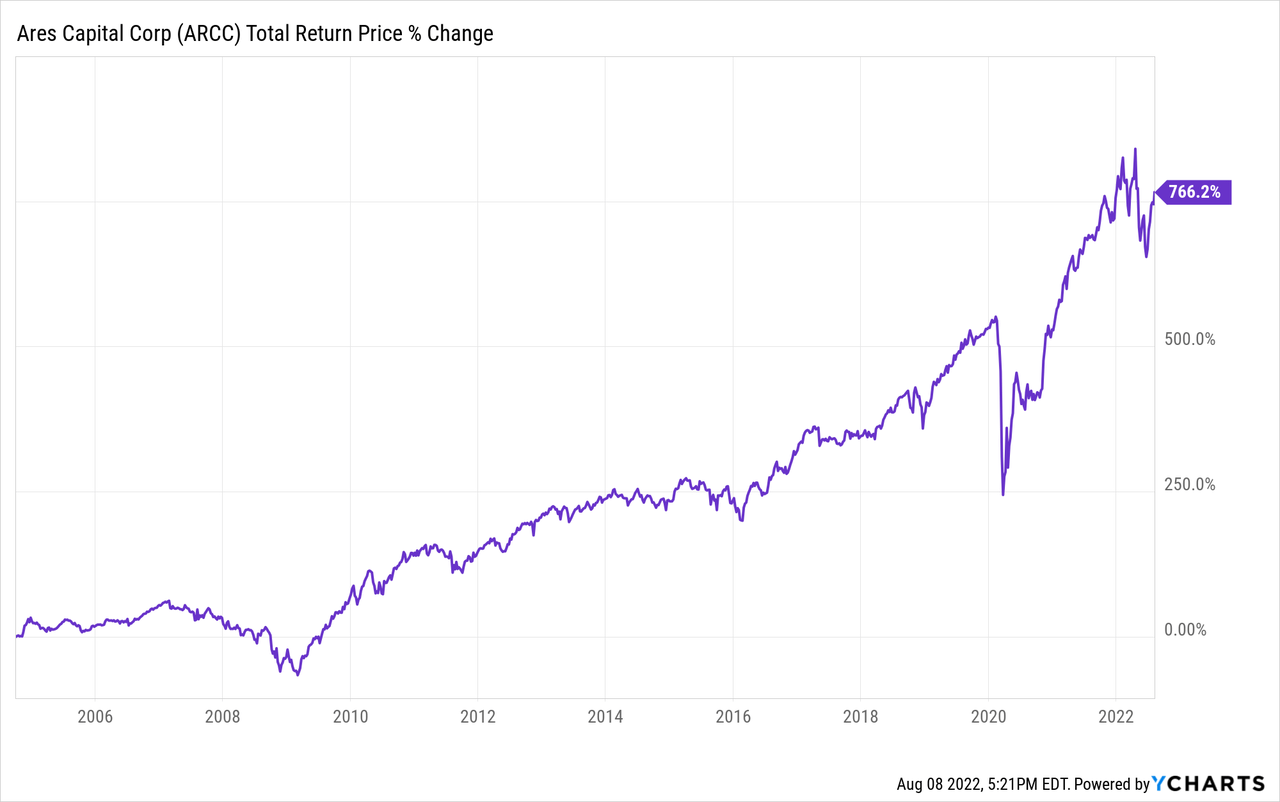
ARCC has a great track record, as it has crushed the market since it went public:
OCSL, meanwhile, has a less than stellar track record. However, since being acquired by Oaktree at the end of 2017, management has done a phenomenal job of growing NAV and dividends per share. In fact, over that time span, OCSL has actually outperformed ARCC, particularly since the COVID-19 crash took place:
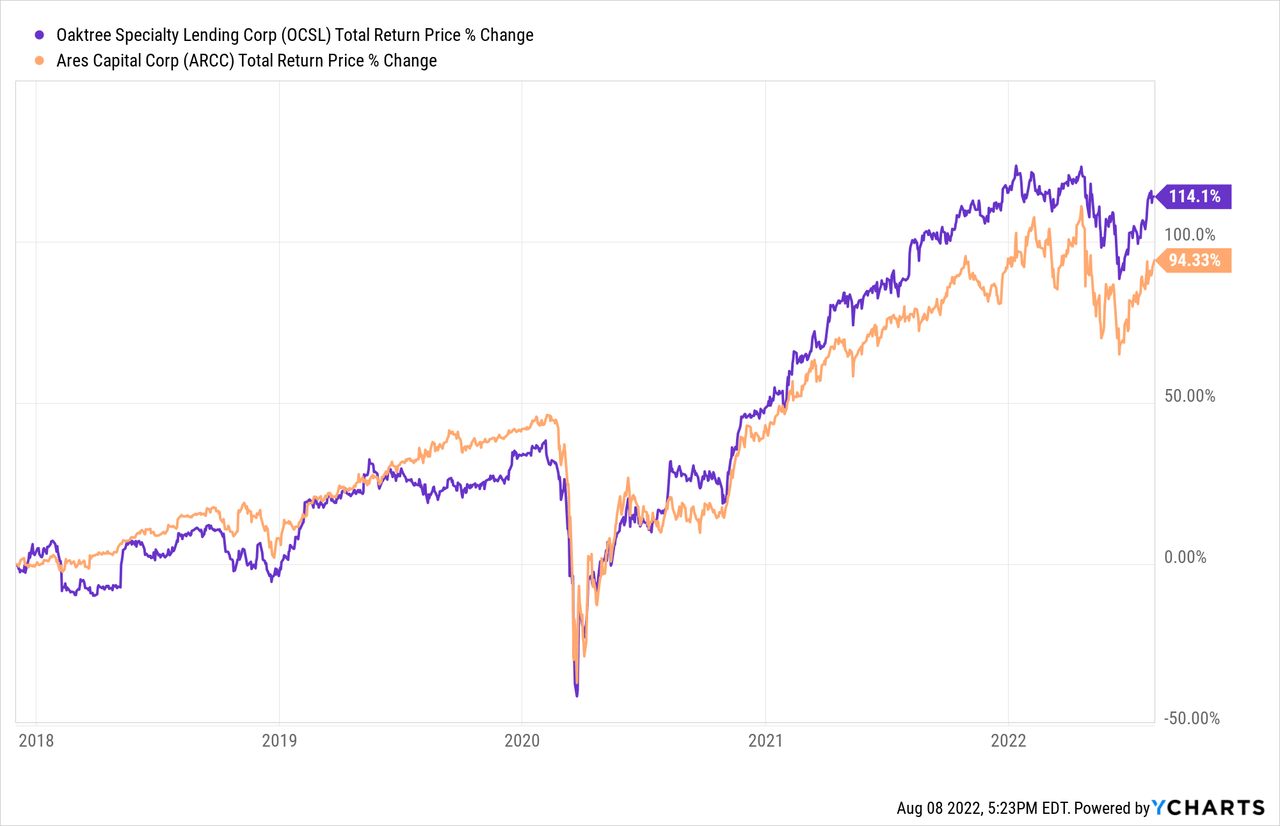
As a result, we view this as a draw. It is hard to underestimate ARCC’s impressive long-term track record. At the same time, however, under the current management teams, OCSL has actually outperformed ARCC, and the Oaktree management team under the guidance of Howard Marks has an exceptional long-term track record of its own.
Valuation
When it comes to valuation, OCSL currently boasts a higher yield than ARCC of 8.8% against 8.2%. It also has a lower price to normalized earnings ratio of 9.57x vs 9.97x based on the next twelve months of analyst estimates. Last, but not least, it currently trades at a mere premium of 2.61% to its net asset value whereas ARCC trades at a slightly higher premium to net asset value of 6.01%
Investor Takeaway
ARCC is hard to pick against given its impressive track record, strong dividend coverage, and favorable exposure to rising interest rates. On the other hand, OCSL’s underwriting is flawless, its portfolio and balance sheet are very defensively positioned, and it offers slightly better value than ARCC does. On top of that, its recent track record under Oaktree management is superior to ARCC’s over the same time period. Overall, we think they are both equally attractive here and think diversifying by owning both is prudent as OCSL provides greater protection against a recession whereas ARCC provides greater exposure to rising interest rates.
Be the first to comment