

designer491
By Karen Veraa, CFA
Treasury Inflation-Protected Securities (“TIPS”) haven’t generated positive returns so far this year, despite inflation hitting the highest levels since the early 1980s.1 Some investors may find this development confusing and wonder if adding inflation-protected bonds to their portfolios makes sense.
Whether inflation simmers down from here or surges again, we believe TIPS have an important role to play in portfolios for three key reasons: TIPS help investors hedge against inflation, provide diversification to traditional portfolios, and TIPS ETFs are tax efficient.
Here’s a refresher on how TIPS work and an explanation for their sluggish year-to-date performance.
What Are TIPS?
U.S. Treasury Inflation-Protected Securities (“TIPS”) are government bonds with principal values that are adjusted based on changes in inflation. A bond’s principal, also known as its face or par value, is the amount of money the bond issuer agrees to pay investors when the bond matures.
Here’s how TIPS work, according to the U.S. Treasury Department:2
- The TIPS’ principal increases with inflation and decreases with deflation, as measured by the Consumer Price Index (CPI). When TIPS mature, you are paid the adjusted principal or original principal, whichever is greater.
- TIPS pay interest twice a year, at a fixed rate. The rate is applied to the adjusted principal; so, like the principal, interest payments rise with inflation and fall with deflation.
To recap, the income, or interest payment, provided by TIPS is directly impacted by changes to CPI. Seems straightforward, right?
However, the total return of a TIPS portfolio will be impacted by changes in interest rates and changes to the market’s expectations for future inflation. Total return refers to the actual return on an investment, including your original principal and interest payments, as well any gain or loss in the value of your original principal and (when applicable) capital gains, dividends, and distributions. Total return is calculated as a percentage of the amount invested.
How Have TIPS performed recently?
When inflation is rising, the income provided by TIPS (and ETFs that hold them) can be higher than traditional, or nominal, fixed-income portfolios, which aren’t adjusted for inflation.
TIPS ETFs can provide increased levels of income when inflation is high
Annual ETF distribution yields
The Average ETF Distribution Yield is the average monthly distribution as a % of NAV in each year, annualized; 2022 YTD performance as of 8/31/22. CPI YoY Change is the end of year US CPI Urban Consumers YoY NSA Index. (Source: Bloomberg. )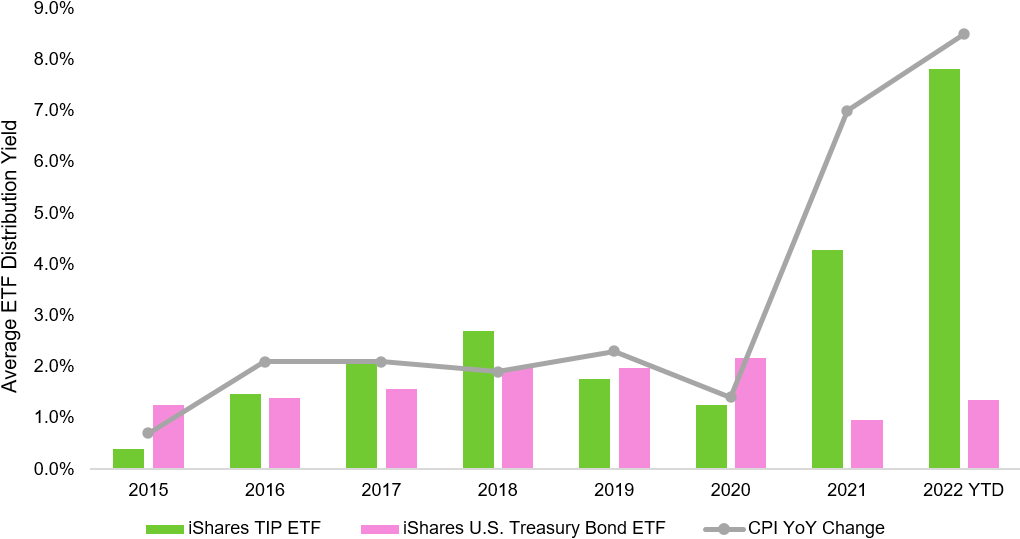
Performance data represents past performance and does not guarantee future results. Investment return and principal value will fluctuate with market conditions and may be lower or higher when you sell your shares. Current performance may differ from the performance shown. This information must be preceded or accompanied by a prospectus. For standardized performance and most recent month-end performance, as well as a prospectus for these funds, click the following links: TIP, GOVT.
Chart description: This chart shows a comparison of the income generated by inflation-protected securities (represented by the iShares TIP ETF, TIP) vs. nominal Treasuries (represented by the iShares U.S. Treasury Bond ETF, GOVT).
After generating positive total returns for investors in 2021, TIPS have produced negative total returns year-to-date in 2022.3 Again, that’s despite CPI inflation posting its largest year-over-year increase since November 1981.4
Two developments may help explain this apparent contradiction:
- First, interest rates jumped after the Federal Reserve started raising interest rates; yields on the 10-year U.S. Treasury note rose 92 basis points from March 31, 2022 to July 31, 2022.5 Higher rates caused bond prices — which move in the opposite direction of yields — to decline, including on TIPS securities. The additional rises in CPI inflation this year were not enough to offset the losses resulting from higher rates.
- Second, as noted above, the total return of TIPS is affected by inflation expectations, not just actual CPI prints. In 2021, demand for TIPS securities rose in conjunction with an increase in inflation expectations. From May 2021 to December 2021, 2-year breakeven rates — the difference between yields on TIPS and nominal Treasuries with the same duration, and the market’s expectation of future inflation — moved higher. As a result, TIPS outperformed traditional bonds last year as both actual and expected inflation rose while interest rates stayed flat. In other words, TIPS rose in price ahead of the actual published change in CPI.6
Additionally, TIPS have outperformed traditional Treasuries since the start of 2021 on a total return basis.
TIPS total returns: Driven by interest rates and inflation expectations
Breakdown of TIPS total returns by driver beginning in 2021
The TIPS Total Return is the return of The Bloomberg US Treasury Inflation-Linked Bond Index, the Nominal Treasury Return is the return of The Bloomberg US Treasury Index adjusted to be on equal duration of the Inflation-Linked Index, and the Benefit from Inflation Expectations is the difference between the two. (Source: Bloomberg as of 7/30/22. )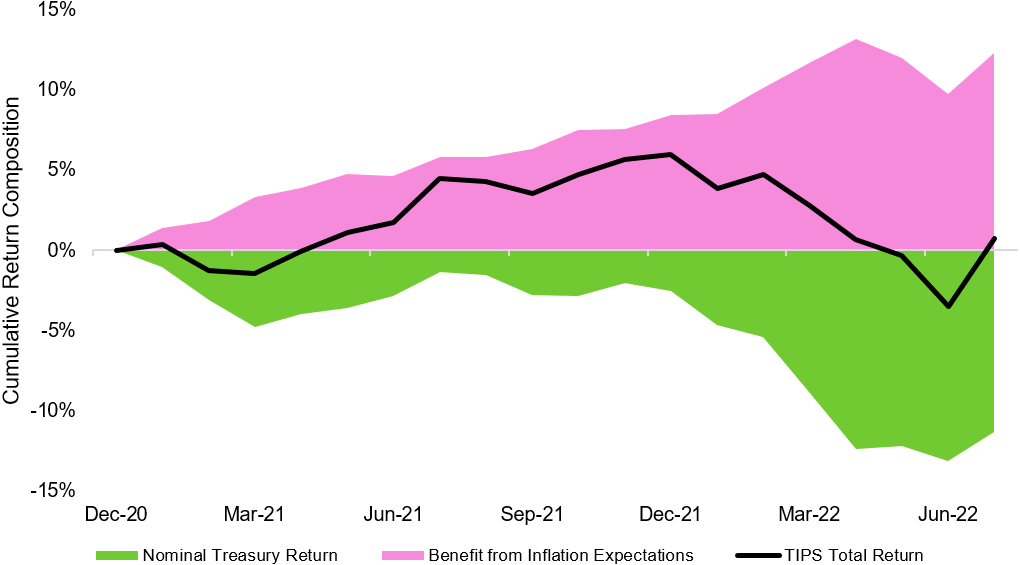
Index performance is for illustrative purposes only. Index performance does not reflect any management fees, transaction costs or expenses. Indexes are unmanaged and one cannot invest directly in an index. Past performance does not guarantee future results. Index performance does not represent actual Fund performance. For actual fund performance, please visit www.iShares.com or www.blackrock.com.
Chart description: This chart shows the total return of TIPS vs. nominal Treasuries from Jan. 1, 2021 through July 30, 2022.
Fast forward to the present and 2-year breakeven inflation rates are at 3.25%, significantly lower than the most recent year-over-year CPI change of 8.5%.7 This suggests the market is expecting inflation to moderate in the coming year.
Still, we believe inflation is likely to remain well-above the Fed’s 2% target for some time; indeed, August CPI data was higher than expected, and up 8.3% on a year-over-year basis, despite a drop in energy prices.8 Exactly how high and for how long will depend on several factors that are difficult to predict. But if inflation does surprise higher, TIPS can offer a hedge against further inflation risk, while also providing current income.
The iShares TIPS Bond ETF (TIP) is the largest TIPS ETF, with $30.6 billion of assets as of June 30, 2022.9
For investors worried higher interest rates will continue to negatively impact total returns, the iShares 0-5 Year TIPS ETF (STIP) can provide a similar level of inflation protection with a lower duration profile.
For investors who desire inflation protection for their broader fixed-income portfolios, iShares also offers the iShares Inflation Hedged U.S. Aggregate Bond ETF (AGIH), iShares Inflation Hedged Corporate Bond ETF (LQDI) and iShares Inflation Hedged High Yield Bond ETF (HYGI).
Where Do TIPS Fit Into A Portfolio?
Most traditional broad fixed-income benchmarks, such as the Bloomberg US Aggregate Index, do not include TIPS. As a result, investors may not own any TIPS in their core bond allocations. TIPS ETFs offer a low-cost and efficient way to add diversification into portfolios.
TIPS also provide investors an opportunity to diversify against other major asset classes. The correlation of TIPS to the S&P 500 was just 0.3 in the past decade and 0.5 to high-yield corporate debt.10 Correlation is a measure of the relationship between assets, as represented by a value range of -1 to 1; the lower the number, the weaker the relationship.
TIPS deliver diversification to other traditional asset classes
Correlation of TIPS to traditional asset classes
| TIPS | Nominal treasuries | High yield corporates | U.S. Aggregate Index | S&P 500 | |
|---|---|---|---|---|---|
| TIPS | 1 | ||||
| Nominal treasuries | 0.7 | ` | |||
| High yield corporates | 0.5 | 0 | 1 | ||
| U.S. Aggregate Index | 0.8 | 0.9 | 0.4 | 1 | |
| S&P 500 | 0.3 | 0.1 | 0.8 | 0.2 | 1 |
Source: Bloomberg as of 7/30/22 using monthly returns over the previous ten years.
TIPS are represented by The Bloomberg US Treasury Inflation-Linked Bond Index and Nominal Treasuries are represented by The Bloomberg US Treasury Index, High Yield Corporates are the Bloomberg US High Yield Corporate Index, US Aggregate Index is the Bloomberg US Aggregate Bond Index, and S&P 500 is the S&P 500 Index. Past correlations not indicative of future correlations.
Another advantage of TIPS ETFs is particularly attractive for investments in taxable accounts: When the principal of TIPS is adjusted upwards by inflation, the IRS considers this income, even though it is not distributed to holders of individual TIPS securities (a concept referred to as “phantom income”). The iShares TIPS Bond ETF will pay out this inflation adjustment as part of the monthly income so the cash flow the investor has the potential to exceed the tax liability.
Conclusion
Just as you might own fixed income to hedge against the possibility for declines in the equity market, investors should consider having at least some allocation to TIPS to hedge against the possibility of higher-than-expected inflation. In addition, TIPS have historically provided investors diversification and potential tax benefits, making them a core element to a well-rounded portfolio.
© 2022 BlackRock, Inc. All rights reserved.
1 Source: Bureau of Labor Statistics, July 18, 2022.
2 Source: TreasuryDirect.gov.
3 Source: Bloomberg US Treasury Inflation Linked Bond Index as of Aug. 31, 2022.
4 Source: Bureau of Labor Statistics as of July 18, 2022.
5 Source: Bloomberg.
6 Source: Bloomberg. Duration is a measure of a bond’s or portfolio’s sensitivity to interest rates. For every year of duration, a 1% change in interest rates will lead to a 1% change in the opposite direction of a bond’s value.
7 Sources: Bloomberg as of July 31, 2022; Bureau of Labor Statistics as of Aug. 10, 2022.
8 Source: Bloomberg, Sept. 13, 2022
9 Source: BlackRock
10 Source: Bloomberg as of July 30, 2022.
Carefully consider the Funds’ investment objectives, risk factors, and charges and expenses before investing. This and other information can be found in the Funds’ prospectuses or, if available, the summary prospectuses, which may be obtained by visiting the iShares Fund and BlackRock Fund prospectus pages. Read the prospectus carefully before investing.
Investing involves risk, including possible loss of principal.
Fixed income risks include interest-rate and credit risk. Typically, when interest rates rise, there is a corresponding decline in bond values. Credit risk refers to the possibility that the bond issuer will not be able to make principal and interest payments.
Non-investment-grade debt securities (high-yield/junk bonds) may be subject to greater market fluctuations, risk of default or loss of income and principal than higher-rated securities.
TIPS can provide investors a hedge against inflation, as the inflation adjustment feature helps preserve the purchasing power of the investment. Because of this inflation adjustment feature, inflation protected bonds typically have lower yields than conventional fixed rate bonds and will likely decline in price during periods of deflation, which could result in losses. Government backing applies only to government issued securities, and does not apply to the funds.
An investment in the Fund is not insured or guaranteed by the Federal Deposit Insurance Corporation or any other government agency and its return and yield will fluctuate with market conditions.
The Fund’s use of inflation hedging instruments is intended solely to mitigate inflation risk and is not intended to mitigate credit risk, interest rate risk, or other factors influencing the price of investment-grade corporate bonds, which may have a greater impact on the bonds’ returns than inflation. There is no guarantee that the Fund’s positions in inflation hedging instruments will reduce or completely eliminate inflation risk within the fund.
Diversification and asset allocation may not protect against market risk or loss of principal.
This material represents an assessment of the market environment as of the date indicated; is subject to change; and is not intended to be a forecast of future events or a guarantee of future results. This information should not be relied upon by the reader as research or investment advice regarding the funds or any issuer or security in particular.
The strategies discussed are strictly for illustrative and educational purposes and are not a recommendation, offer or solicitation to buy or sell any securities or to adopt any investment strategy. There is no guarantee that any strategies discussed will be effective.
The information presented does not take into consideration commissions, tax implications, or other transactions costs, which may significantly affect the economic consequences of a given strategy or investment decision.
This material contains general information only and does not take into account an individual’s financial circumstances. This information should not be relied upon as a primary basis for an investment decision. Rather, an assessment should be made as to whether the information is appropriate in individual circumstances and consideration should be given to talking to a financial professional before making an investment decision.
Transactions in shares of ETFs may result in brokerage commissions and will generate tax consequences. All regulated investment companies are obliged to distribute portfolio gains to shareholders.
The Funds are distributed by BlackRock Investments, LLC (together with its affiliates, “BlackRock”).
The iShares Funds are not sponsored, endorsed, issued, sold or promoted by Bloomberg, BlackRock Index Services, LLC, Cohen & Steers, European Public Real Estate Association (“EPRA®”), FTSE International Limited (“FTSE”), ICE Data Indices, LLC, NSE Indices Ltd, JPMorgan, JPX Group, London Stock Exchange Group (“LSEG”), MSCI Inc., Markit Indices Limited, Morningstar, Inc., Nasdaq, Inc., National Association of Real Estate Investment Trusts (“NAREIT”), Nikkei, Inc., Russell or S&P Dow Jones Indices LLC or STOXX Ltd. None of these companies make any representation regarding the advisability of investing in the Funds. With the exception of BlackRock Index Services, LLC, which is an affiliate, BlackRock Investments, LLC is not affiliated with the companies listed above.
Neither FTSE, LSEG, nor NAREIT makes any warranty regarding the FTSE Nareit Equity REITS Index, FTSE Nareit All Residential Capped Index or FTSE Nareit All Mortgage Capped Index. Neither FTSE, EPRA, LSEG, nor NAREIT makes any warranty regarding the FTSE EPRA Nareit Developed ex-U.S. Index or FTSE EPRA Nareit Global REITs Index. “FTSE®” is a trademark of London Stock Exchange Group companies and is used by FTSE under license.
© 2022 BlackRock, Inc. All rights reserved. BLACKROCK, BLACKROCK SOLUTIONS, BUILD ON BLACKROCK, ALADDIN, iSHARES, iBONDS, FACTORSELECT, iTHINKING, iSHARES CONNECT, FUND FRENZY, LIFEPATH, SO WHAT DO I DO WITH MY MONEY, INVESTING FOR A NEW WORLD, BUILT FOR THESE TIMES, the iShares Core Graphic, CoRI and the CoRI logo are trademarks of BlackRock, Inc., or its subsidiaries in the United States and elsewhere. All other marks are the property of their respective owners.
iCRMH0922U/S-2392579
This post originally appeared on the iShares Market Insights.
Editor’s Note: The summary bullets for this article were chosen by Seeking Alpha editors.
Be the first to comment