

ErikMandre
Thesis
The MicroSectors FANG+ Index -3X Inverse Leveraged ETN (NYSEARCA:FNGD) is an exchange traded note which provides three times inverse leveraged participation in the performance of the FANG+ Index, compounded daily. The underlying index is very closely correlated to the Nasdaq, and has been on fire in the past week as a new bear market rally has taken hold:
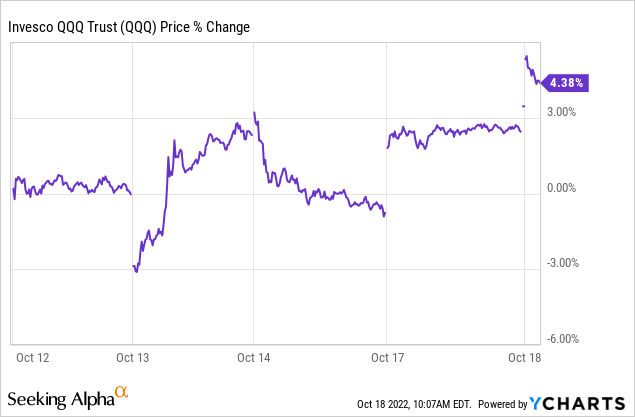
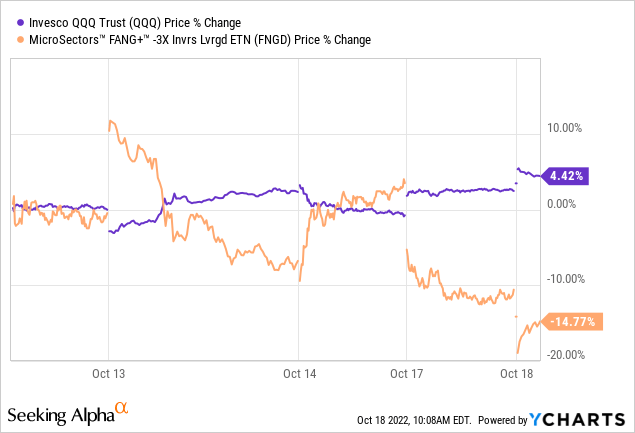
The Nasdaq is up over 4% in the past 5 days, and up more than 7% since the lows recorded on October 13. Conversely, FNGD, which is an inverse leveraged version of tech, is down substantially:
FNGD is a trading tool, not a buy and hold instrument. From that angle an investor who is long $90k worth of tech stocks can buy just $30k of FNGD in order to immunize the portfolio from market moves. As a leveraged inverse portfolio construction tool FNGD is to be traded for the ongoing bear market if an investor chooses not to liquidate stocks due to tax implications. What we are currently witnessing is another volatile bear market rally:
Bear Market Rallies (The Heisenberg)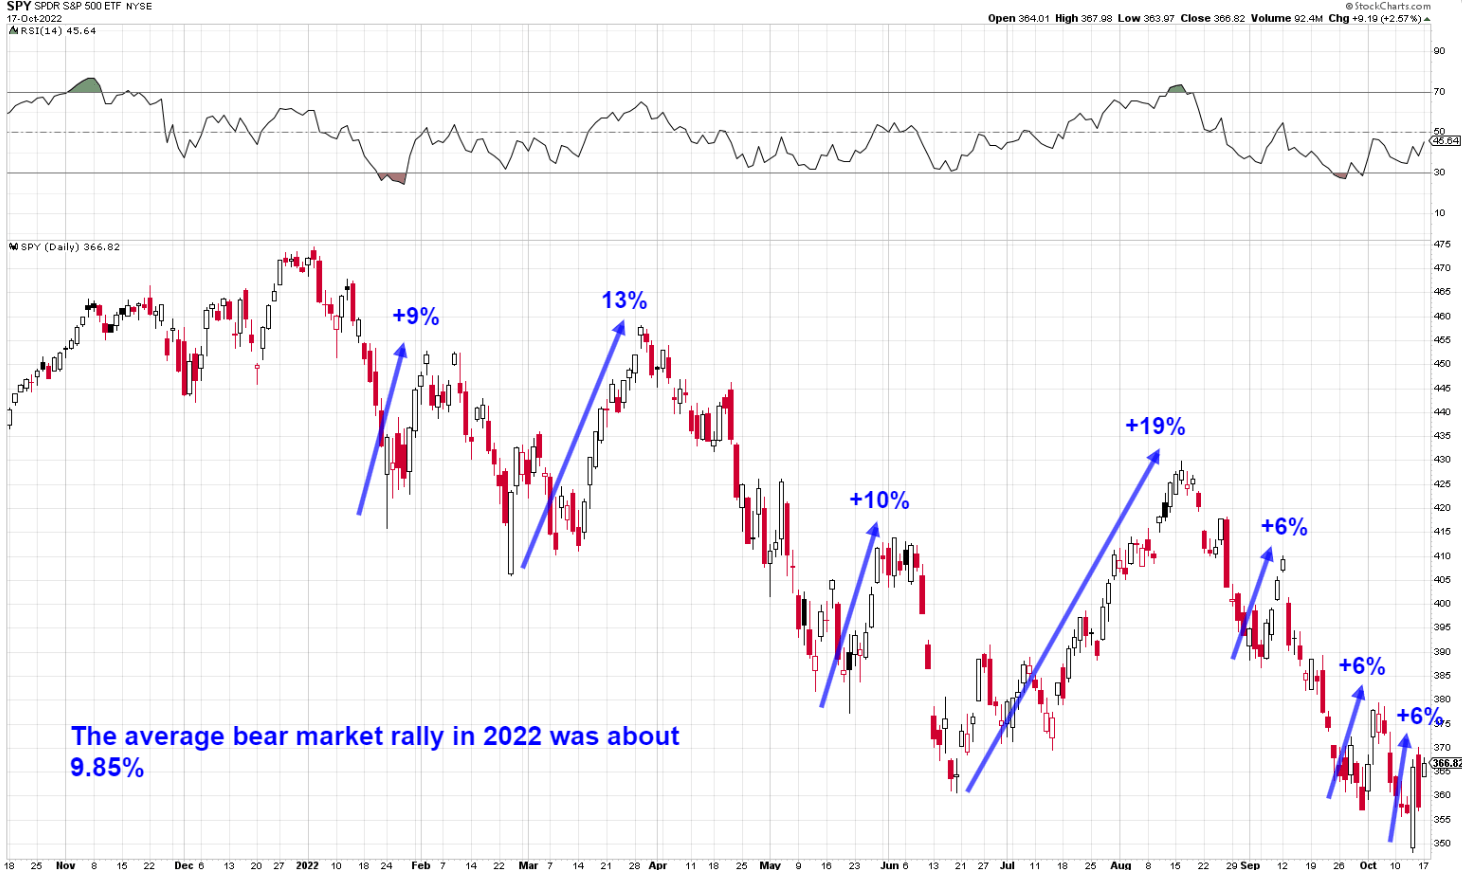
The market is fast moving, and up another 2% as we write this article. A savvy investor needs to ascertain the general market trend, which is down. Nothing goes down in a straight line, otherwise trading would be very easy and all market participants would record profits in a bear market. That is not how the real world works. Investors need to be in the dark and in doubt regarding the short term trend in order for buyers and sellers to compensate each other. This is exactly what is occurring now, during yet another bear market rally.
Fundamentally we need to look at two larger vectors for performance for tech:
1) Rates
2) Earnings
Rates: rates have not peaked yet, and most market participants expect Fed Funds to end up in the 4.75% to 5% range:
Terminal Rate (BofA)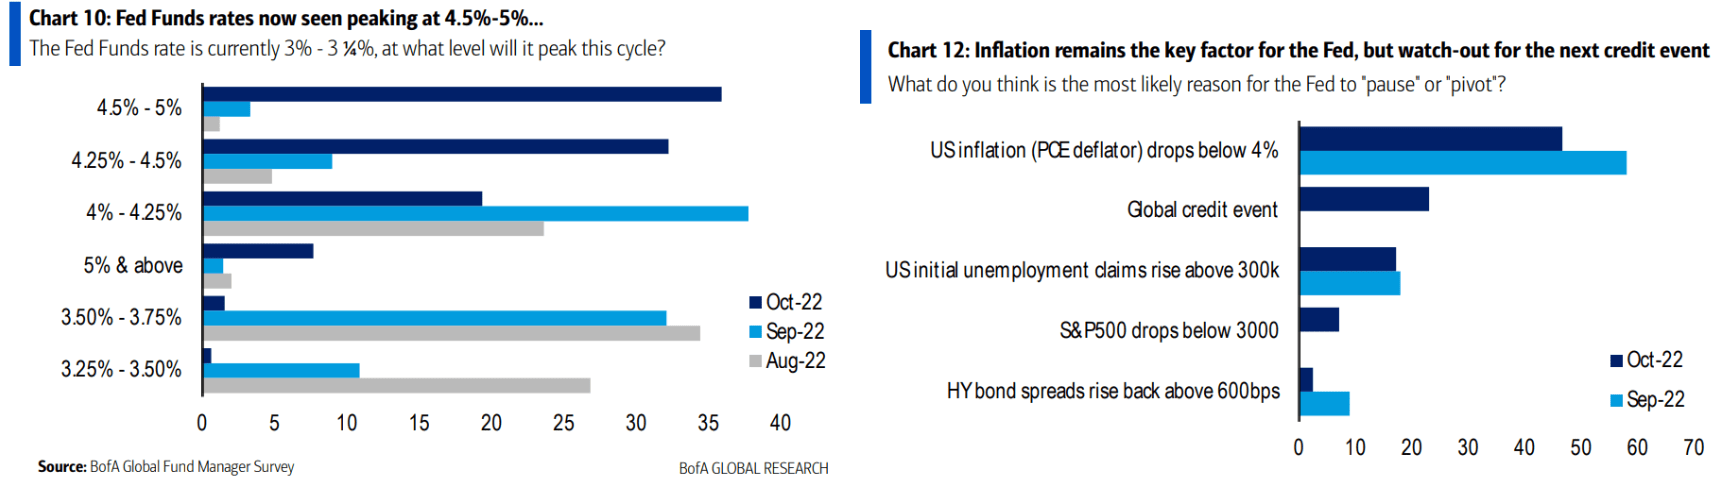
If we look at the current yield curve we can see there is somewhere between 60 and 100 bps to go depending on the point in the curve:
Yield Curve (Investing.com)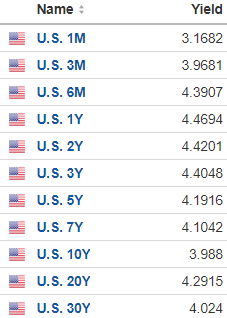
And yes, we are assuming that most of the points in the curve are going to be pulling close to Fed Funds. All year long equities, especially tech, have sold off when yields moved higher. This is not going to be any different.
Earnings: While many tech stocks have de-rated already via lower P/E ratios, the true earnings Armageddon has not arrived. We are looking for the lofty analyst projections for 2023 to come down. They need to, because we are of the opinion we are in a recession. A global recession to be more precise, where some countries like China are choosing not to even report economic figures. It will take a while for the NBER to declare a recession, and by that time the stock market would already be in a substantial rally. Stocks usually bottom 6 to 8 months before the economy does, so do not wait for economic statisticians to declare one. There is no smoke without fire and the U.S. housing market is on the ropes, inflation has not been tamed yet and the everyday Joe has seen the purchasing power erode for simple everyday goods. If you feel like we are in a recession that is because we are in one.
Holdings
The NYSE FANG+ Index is fairly new in the marketplace, having been recently launched:
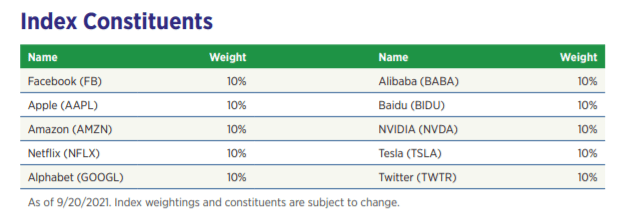
index details (fund fact sheet) The NYSE FANG+ Index is an equal-dollar weighted index that was created by the NYSE in 2017 to provide exposure to a group of highly-traded growth stocks of technology companies: Constituents (Fund Fact Sheet) Among the large North American names in the index one can also find a couple of Chinese tech names, namely Alibaba (BABA) and Baidu (BIDU) providing for a bit of geographic diversity in the technology space.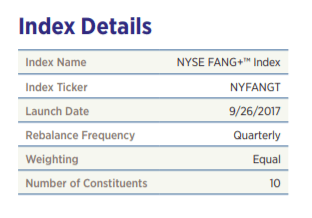
Structuring Characteristics
FNGD is an exchange traded note, not an exchange traded fund, hence it is also subject to the default risk posed by Bank of Montreal. Before we get lost in the acronyms let us spell out what an ETN is and what it entails for an investor. ETN stands for Exchange Traded Note, and in effect FNGD is a bond issued by Bank of Montreal that gives an investor the stated returns. An ETN has inherently increased risk as compared to an ETF because it is not bankruptcy remote. An investor buying FNGD would be fully exposed to the credit risk posed by Bank of Montreal. And in an outside scenario where Bank of Montreal would be taken over by a regulator / experience a bankruptcy event, an investor in FNGD would become a creditor to the estate, but in effect would lose a substantial amount of value unrelated to the underlying exposure.
The most famous case of a bank bankruptcy is Lehman, and in effect there were a number of Lehman sponsored ETNs that serve a cautionary tale for ETN investors. Always ensure you understand the difference between an ETN and an ETF and be comfortable with the ultimate sponsor.
The best way to think about an ETN is that it is an actual funding vehicle for the underlying bank (Bank of Montreal) in this case, and the institution is packaging a certain return profile within its bond so that it can i) fund itself, ii) gain certain management fees from the vehicle.
Performance
FNGD is up substantially year to date on the back of the stock market sell-off:
YTD Performance (Seeking Alpha)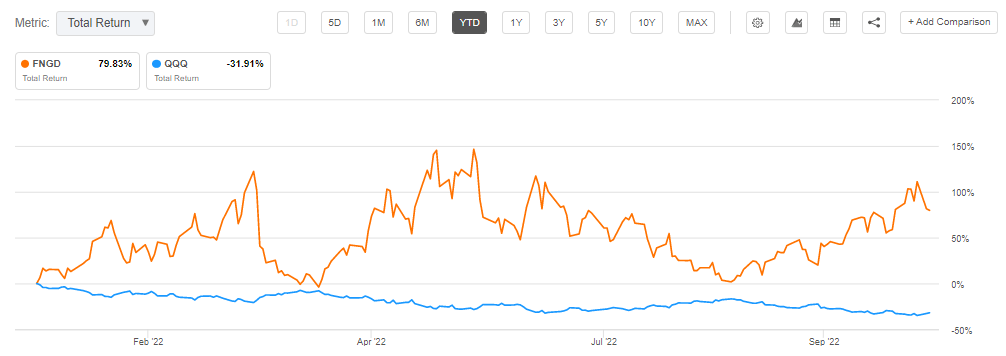
We can notice the trading tool aspect for FNGD. The instrument was up 150% in June before reverting back to a 0% return during the height of the August bear market rally. Do not buy and hold FNGD, trade it! Use it when you feel the equity market is experiencing another bear market rally during the overarching bear trend.
Conclusion
FNGD is a leveraged ETN, providing for -3x the performance of the FANG+ Index. The fund is a short term trading tool, rather than a buy-and-hold instrument. Due to its leverage, the vehicle can be utilized as a capital efficient tool when immunizing a portfolio from further market losses if equity liquidations are not possible (due to tax reasons for example). Up more than 150% earlier in the year, FNGD gave up those gains during the August bear market rally. In the past five trading days we have witnessed yet another bear market rally take hold, with the Index up more than 7% from its October 13 lows. We think this rally will fizzle as well, within the context of a larger downtrend. FNGD provides for a capital efficient tool to fade this latest bear market rally.
Be the first to comment