

vice_and_virtue/iStock via Getty Images
A guest post by D Coyne
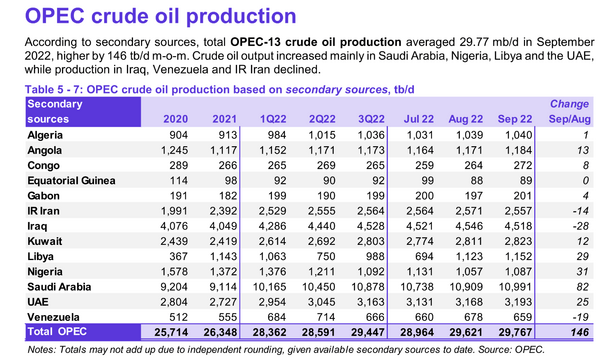
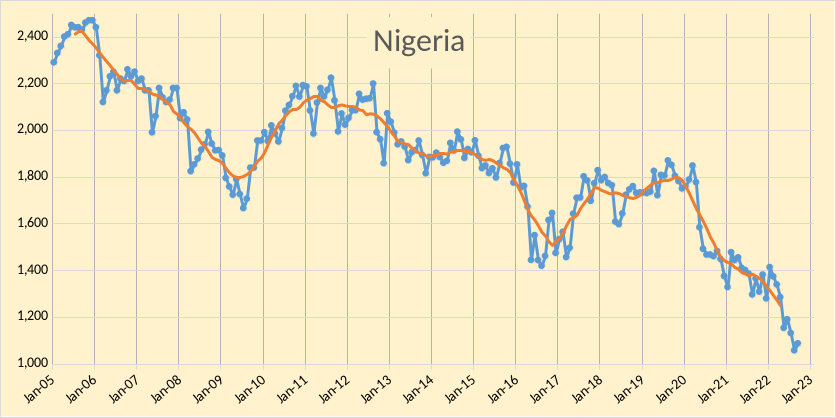
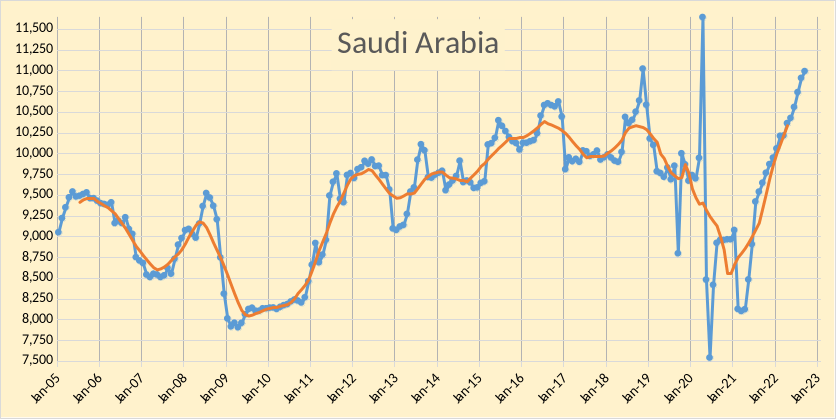
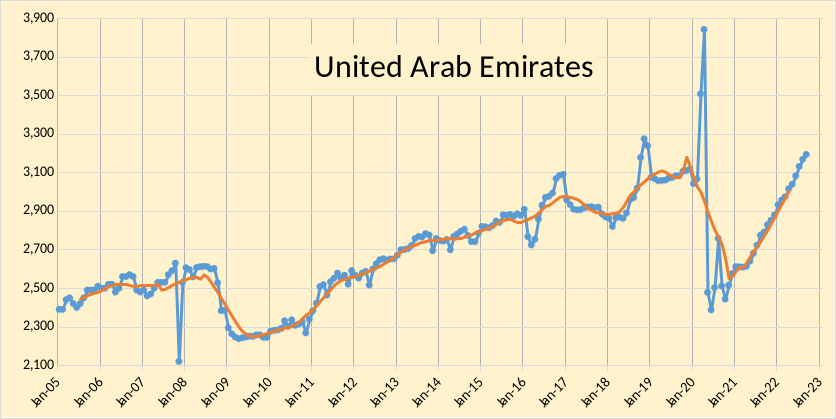
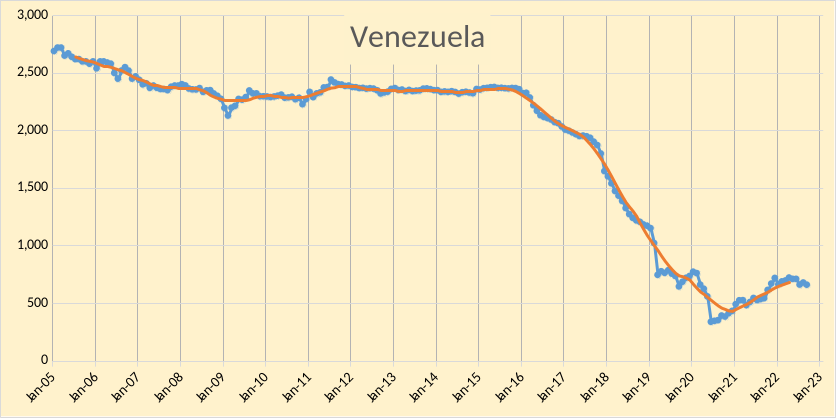
The OPEC Monthly Oil Market Report (MOMR) for October 2022 was published recently. The last month reported in most of the OPEC charts that follow is September 2022 and output reported for OPEC nations is crude oil output in thousands of barrels per day (kb/d). In most of the OPEC charts that follow the blue line is the monthly output and the red line is the centered twelve-month average (CTMA) output. Note however there are a few exceptions to this for OPEC+ charts near the end of the post where EIA C+C data was used which has the most recent data from June 2022 (so three months behind the OPEC crude only data in most of the charts that follow.)
Author Author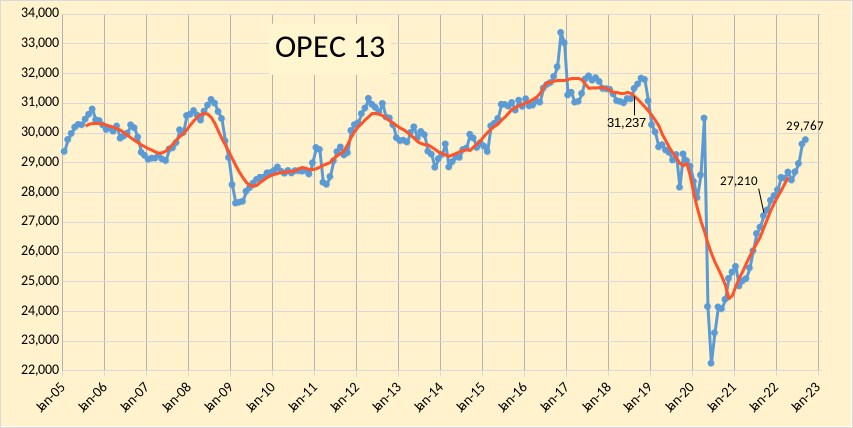
OPEC crude output was revised lower in August 2022 by 30 kb/d compared to last month’s report and July 2022 OPEC crude output was also revised down by 69 kb/d. OPEC output has increased by 1884 kb/d since December 2021 and by about 4000 kb/d above the average level in 2021.
Author Author Author Author Author Author Author Author Author Author Author Author Author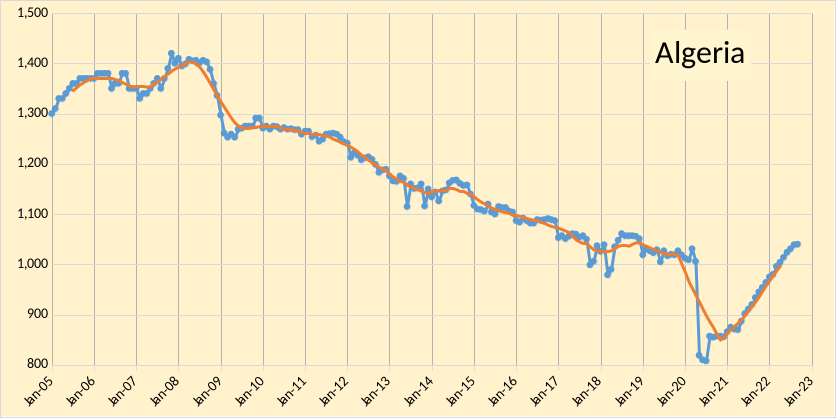
In the chart below we have Russian C + C and OPEC crude oil output. Output in September 2022 was 2366 kb/d below the centered 12-month average (CTMA) in August 2018 of 42,433 kb/d (when the World CTMA of C+C output was at its peak.)
Author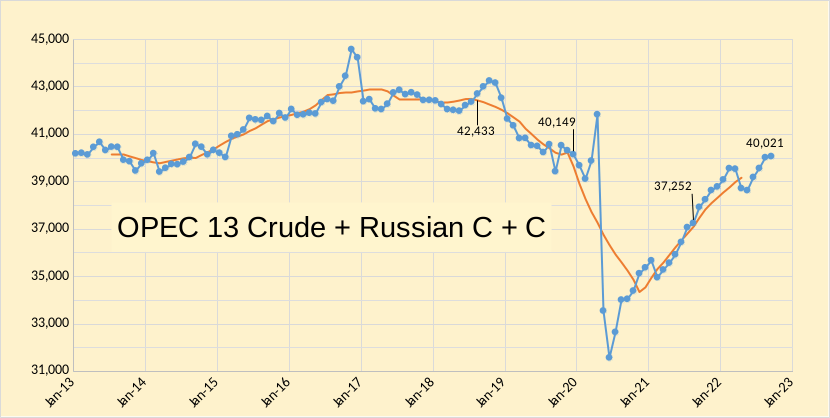
The chart below shows Russian output based on recent OPEC estimates and news reports. The preliminary estimate is 10.3 Mb/d for September 2022 and 10.4 Mb/d for August 2022.
Author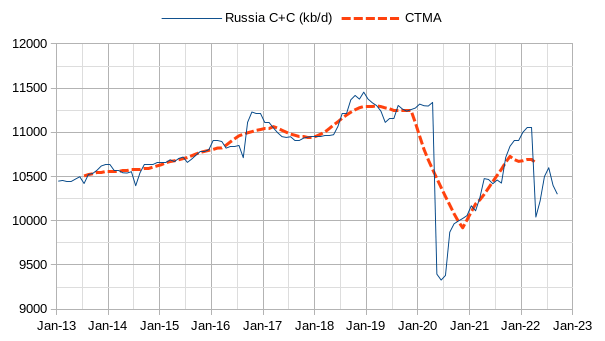
In the chart that follows, I used Short-Term Energy Outlook estimates by the US EIA for US C+C output in August and September. Output for OPEC13 crude + Russian C+C + US C+C was 1642 kb/d below the level at the World-centered twelve-month average (CTMA) peak in August 2018 of 53539 kb/d for these 15 nations.
Author Author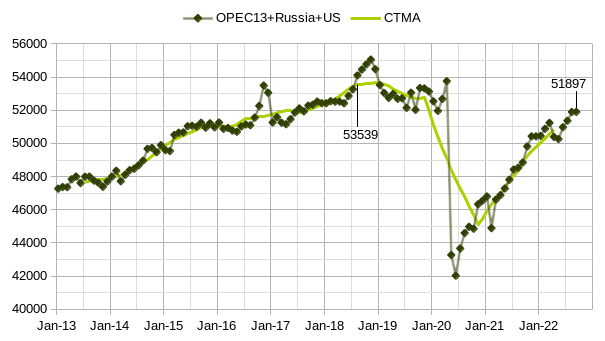
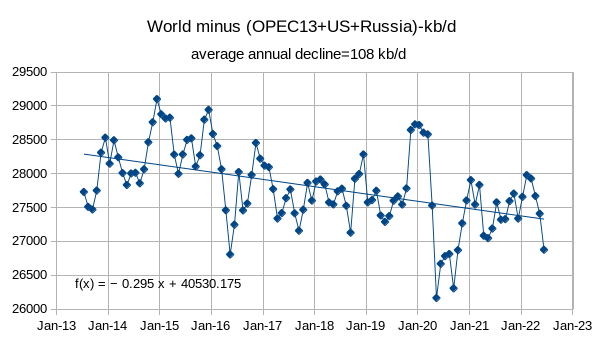
If we consider the World C+C minus the sum of OPEC13 crude and the US and Russian C+C the annual rate of decline is 0.295 times 365.25 days or 108 kb/d per year for the period from July 2013 to June 2022, this chart uses EIA data.
Author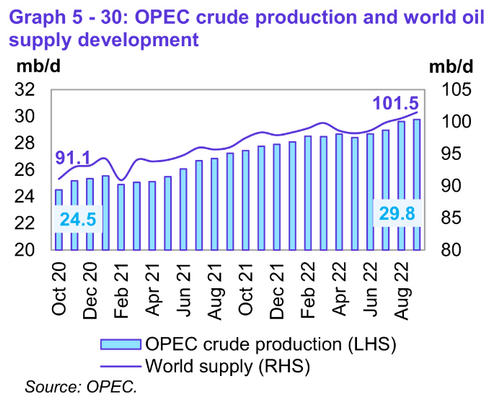
World liquids supply was 10.4 Mb/d higher than 2 years ago, OPEC crude output accounted for 5.3 Mb/d of this increase (51%).
Author Author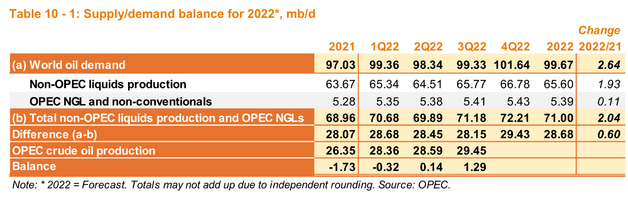
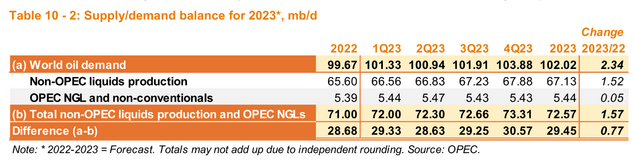
With revisions to the balance of supply and demand, it may be that OPEC can meet the call on OPEC for 2023Q4, even if they cannot, the call on OPEC for all of 2023 may be able to be met as OPEC produced that level of output for 2022Q3. Also, looking at the level of OPEC crude needed for the next 6 months (based on the OPEC forecast) it is clear that lower output was needed, this is the reason for the voluntary cuts in November and December. Note that OPEC nations are free to ignore “voluntary” cuts in output, they are largely symbolic.
Author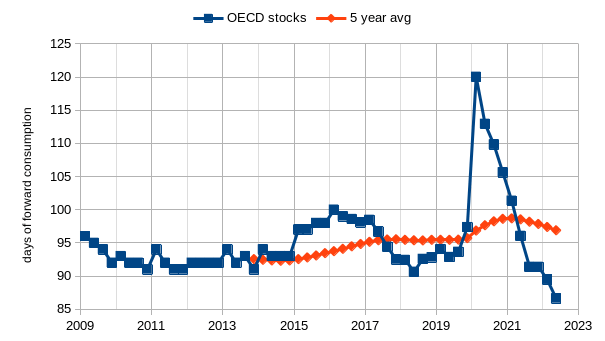
OECD stocks (commercial stocks plus SPR) have remained at very low levels at 87 days of forward consumption, this is lower than at any time since 2009Q1, with the lowest level from 2009 to 2019 being 91 days several times in 2010, 2011, 2013, and 2018. Stock levels this low suggest high oil prices in the future.
Author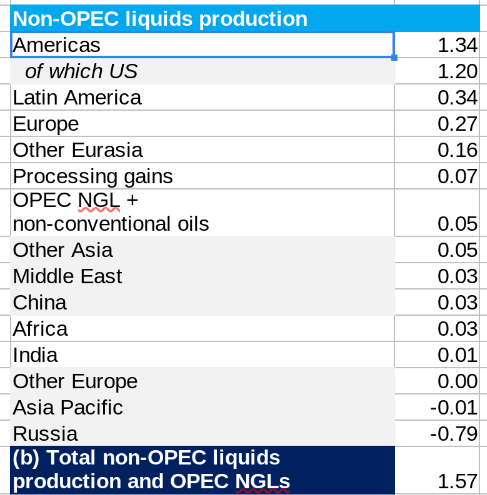
In figure 11 above I show OPEC’s estimate of the liquids increases in Mb/d from 2022 to 2023. OPEC expects (see figure 9 above) World liquids demand to increase by 2.34 Mb/d from 2022 to 2023 (change in annual average demand for liquids). The ratio of World C+C to World liquids, based on the past 12-month average of EIA data (July 2021 to June 2022) was about 80.64% and if we assume this ratio is roughly correct for 2022 and 2023, then World C+C would be approximately 80.4 Mb for 2022 (annual average rate) and about 82.3 in 2023. For comparison, the EIA in its latest STEO estimates about 101.03 of liquids output in 2023 which would be about 81.47 Mb/d of C+C output, for 2022 the estimate by the EIA is about 99.55 Mb/d of total liquids or 80.28 kb/d of C+C. An alternative estimate looks at the trend of non crude plus condensate liquids and estimates that for 2022 this will average 19.57 Mb/d and in 2023 the average will be 20.12 Mb/d. These estimates are deducted from the OPEC and EIA total liquids estimates in 2022 and 2023 to arrive at the following C+C estimates:
OPEC 80.17 Mb/d for 2022 and 81.90 Mb/d in 2023EIA 80.05 Mb/d for 2022 and 80.91 Mb/d in 2023
Lastly, we take a quick look at OPEC+ and US C+C output using EIA data through June 2022.
Author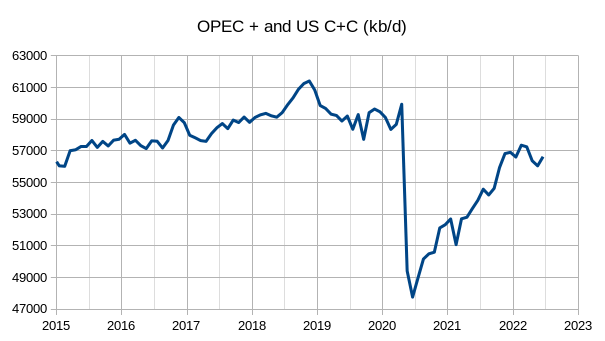
The average annual increase in output for the US + OPEC+ from Jan 2015 to Dec 2019 was about 647 kb/d. In June 2022 output was about 2750 kb/d below the CTMA peak in August 2018, in the past 3 months OPEC 13, US and Russian output rose by about 900 kb/d so for September 2022 the output may be about 1850 kb/d below the 12-month average peak (this assumes the 9 other nations of the DOC has flat output from June to September of 2022, which is likely to be incorrect).
Author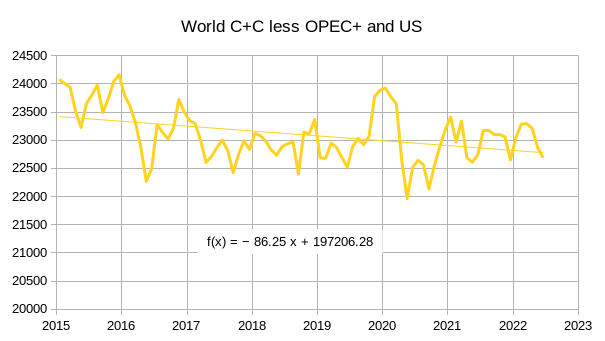
The annual decline rate for World C+C minus the sum of US + OPEC+ C+C output from Jan 2015 to June 2022 is about 86 Mb/d.
Editor’s Note: The summary bullets for this article were chosen by Seeking Alpha editors.
Be the first to comment