

Kelly Sullivan
Big Tech is Forming an Anti-Bubble
After a big sell-off in “Big Tech,” one has to be wondering if this segment of the market is forming an “anti-bubble.” This is a term I like to harken back to from the Nomad Partnership Letters, where Nick Sleep described it as one of his favorite places to look for value.
When there is a frenzy of activity in one area of the market there is very often an anti-bubble of discarded companies. In the dot com era, these were companies with steady cash flow. Where is today’s anti-bubble? – Nick Sleep, Nomad Letters p. 98.
I have very few segments of the market that I won’t invest in, just different ways of evaluating different sectors. Some I look at value related to cash flow and growth, others a combination of assets and earnings, and some for the dividends and dividend growth. During the Covid downturn, energy was an obvious anti-bubble. Exxon Mobil (XOM) was trading at a .8 price-to-book value. The whole energy market was in free fall, and earnings cratered. However, their assets were invaluable in my eyes. As soon as the world opened back up, their product would be in demand at the exact time that production had been cut. I put all my investments for that time period into energy and banking.
At this moment, Tech seems to be at the dawning of a similar opportunity.
At the heart of it all, Meta Platforms, Inc. (NASDAQ:META), seems to be the poster child of what everyone hates and wants to sell. Is it logical? This is a company with very healthy free cash flow, a large coffer of cash reserves, as well as a cash printer in their core business. Yes, they have taken on an endeavor that is deteriorating the earnings of their core, but the bet on its success is not so much roulette, but more like bridge, baccarat, or even blackjack. It’s a game of probabilities, and if we look at both a company’s resources plus its return on invested capital, we can see how fair the game is.
Meta’s Return on Invested Capital
When it comes to big tech, return on invested capital is my first and favorite metric to start with. How well does a company deploy its debt and equity? The most recent fiscal year return on invested capital for Meta is 28% versus an industry average of 20%. During the next fiscal year, this may decrease somewhat due to the Metaverse cash sink, but the starting line is healthy enough to take a hit and still beat the industry average.
Cash is something Meta is in no short supply of, with a TTM free cash flow of USD $26 Billion and a market cap that has been beaten down to $264 Billion. That’s a price-to-free cash flow ratio of 10.1X. This is on par with the price-to-free cash flow ratio of Exxon Mobil (XOM), the last poster child of the anti-bubble that is trading near 10X free cash flow.
Meta Ratio History (yahoo finance)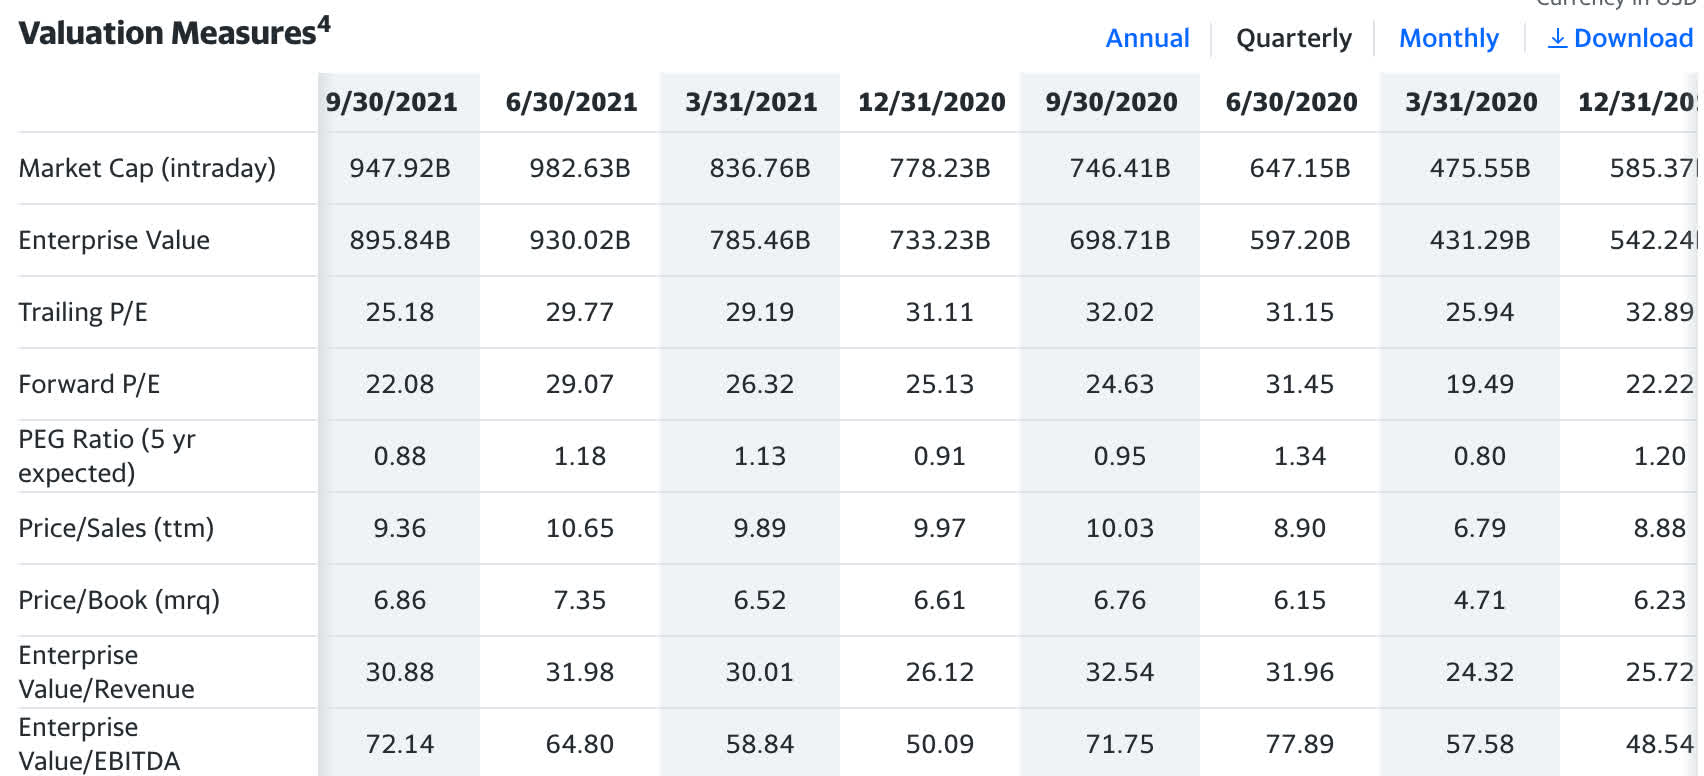
Let’s also not forget that, during Covid, when Exxon was a dog, Meta was trading at 31-32X earnings. That number has now been sliced down to below 10X! The pendulum has now completely swung in the opposite direction, down is up, and up is down. However, this is completely normal, as capital flows from yin to yang in a Zen-like fashion. Calmly identifying both irrationality and where the anti-bubble exists is where rational eats the irrational’s lunch.
Individuals were irrational to buy Meta at 32X earnings, but also irrational to not buy and dump at 10X. These individuals are the same people. To me, both the cash positions and the return on invested capital are parts of a decision tree that lead me to a logical conclusion of future success. I am not sure when that success will manifest, just that it will in time. I have time, just a few rational options.
Evaluating Your Decision Tree
A great Charlie Munger quote from the Nomad letters entails how one should invest and how it relates to the game of bridge:
In one of Charlie Munger’s talks he makes the statement “the right way to think is the way Zeckhauser plays bridge, it’s just that simple.” Well, to a young man in London that is a very infuriating statement as it took me about a year to track down Richard Zeckhauser. He was world bridge champion in ’66 and, amongst other things, now runs a brilliant Behavioral Finance course at the Kennedy School of Government at Harvard. So, how does he play bridge? He thinks via decision trees and attaches probabilities to the various branches. And as the facts change, change the probabilities. And when you are comfortable dealing with probabilities, and the vast expanse of opportunities such as the global stock and bond markets, you don’t have to be too conservative with your bets. But people don’t think clearly when faced with probability trees.
In addition to the ROIC and free cash flow branches of my decision tree evaluation, cash and the balance sheet are equally as important:
Meta Balance Sheet (yahoo finance)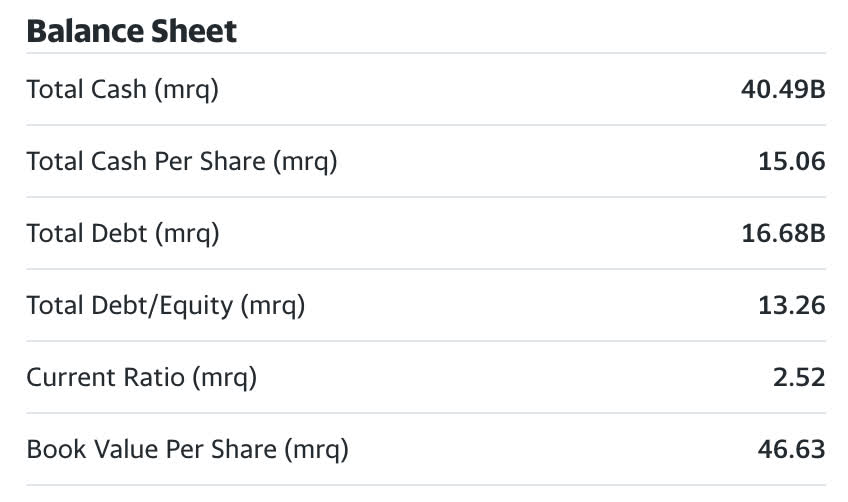
With total cash on hand, mrq of $40.49 Billion, this leads my thought process to an amalgamation of possible outcomes. With $16 Billion in debt and a debt-to-equity ratio of 13.26%, debt is covered almost 2.5X. That is a huge margin of safety, but not a likely outcome for that cash (reducing debt). The small amount of debt is easily serviced by free cash flow, thus the $40 Billion can be used for acquisitions and R&D. TTM R&D by META is at USD $29 Billion. The more spent on this item as a percentage of their revenue is normally precedent for future success, and a high ratio was sought after by the late great Phil Fisher. With a TTM revenue of USD $119 Billion, R&D makes up 24% of revenue as a ratio. This is high indeed, leading me to believe that future outcomes of success are probable.
Acquisitions
Non-organic growth in Big Tech has proven to be fruitful for the largest operators. Meta is no exception, the company has made 97 acquisitions (not including the domain name), and Wikipedia has an excellent compilation. With so many pre-IPO unicorns being devalued and many post-Covid IPO darlings’ share prices being reduced to rubble, that $40 Billion could go a long way in acquisitions. With new regulations upcoming, that will limit the amount of R&D expense that can be taken in a given year. More Big Tech acquisitions would be a logical positioning of capital.
Current Sources of Revenue and Income
Meta 2021 10-K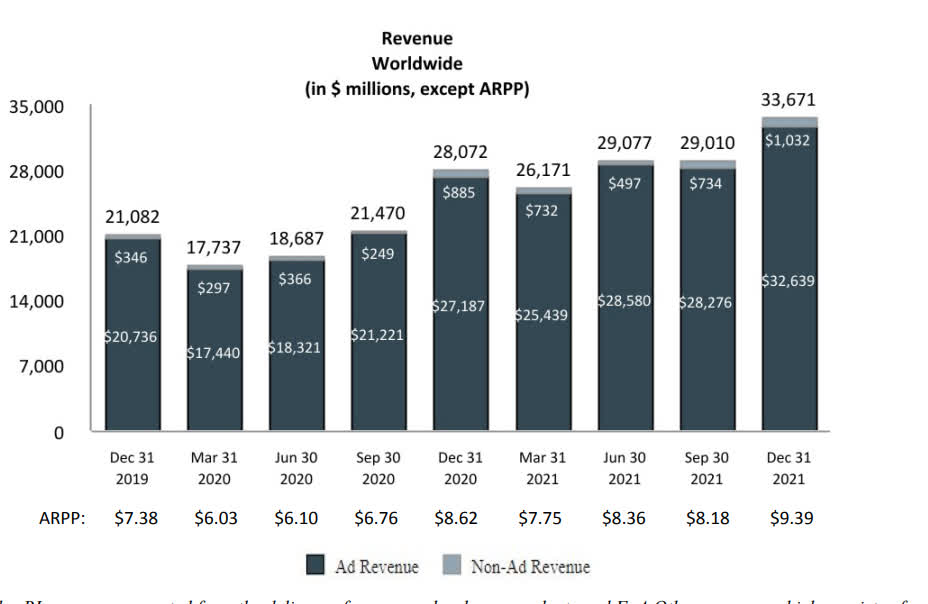
From the above, we can clearly observe that although META owns 90+ businesses, revenue is still derived almost entirely from ad revenue. The core businesses of Facebook and Instagram are the drivers for paid ad revenue. The company was able to derive a record high $9.39 per user in 2021. However, as companies begin to reduce advertising budgets, especially for high-ticket items, this revenue per user is expected to drop off in a recession. This is where META is smart to pivot a bit, attempting to diversify their business could be a smart move.
Book Value
On a price-to-book value basis, Meta is currently trading at the cheapest valuation in its history. At 2.78X book value, the second lowest valuation was back in 2012 at 3.5X. The company has consistently traded in the 6-10X book value range. Say what you will about book value, but assets have value because of their potential to produce income. Not stating that every asset on the balance sheet is producing income or even revenue for that matter, but it adds a margin of safety, nonetheless. These are just more assets outside of the cash position that could be liquidated if they’re looking to generate more capital. If the asset is deemed impaired and written off, it provides further tax benefits that can shelter earnings in lieu of some tax breaks that are being rescinded.
Valuation Based on PEG
With all Tech companies, I like to use Peter Lynch’s valuation for growth companies using the trailing 5-year CAGR in EPS as my multiplier, removing the percent sign and TTM EPS as my multiplicand. This gives us a value at which stock would trade at a price-to-earnings/growth ratio of 1. Most analysts using the PEG ratio divided the current or future estimated P/E by the future forecast in earnings growth. The estimates are consistently wrong and not evidence-based. I’ve seen the PEG ratio of NVIDIA (NVDA) for instance, repriced several times. Heck, I’ve even seen it at a PEG ratio of sub 1 when it was trading at 75X earnings early in the year. Not realistic.
I do realize that META’s growth engine has revved down, but the past 5 years are evidence in my decision tree that proves what management can achieve when the wind is beneath their wings. In companies with high ROIC, I give them the benefit of the doubt even when their growth is slowing.
Meta Analyst Estimates (yahoo finance)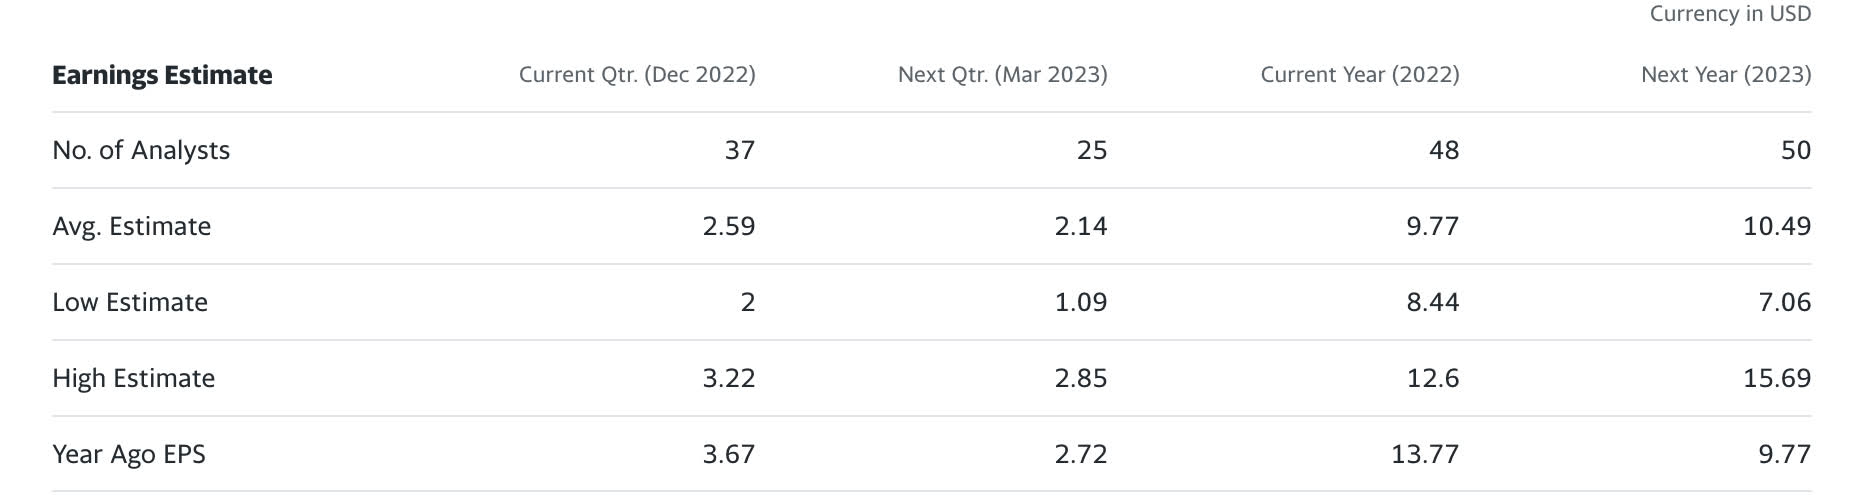
Using an average estimate of $9.77 a share in EPS as my 5th year since we are so close to the year’s end seems more appropriate than using the last full year’s data in 2021. Starting with 2018, Meta clocked an EPS of $7.65 a share. Based on this conservative estimate, Meta would have a multiplier of only 5 (5% CAGR in EPS). With a TTM EPS of $12.76, that would imply a fair value of $63. However, if we harken back to the days when the metaverse was not negatively impacting earnings, the company had an EPS of $5.49 in 2017 ending with an EPS of $13.99 in 2021. That would be a CAGR in EPS of 20.5%, giving us a high-end range of 20.5X TTM EPS of $12.76, or $261 a share based on that data set. Again, I like to be conservative. If I average out the two numbers, I would get $162 a share.
At this point, using the PEG ratio in my mind is superseded by the plain fact that the stock is trading for less than the market multiple. Once this storm comes to pass and the metaverse is self-sustainable, the underlying earnings growth possibilities are still very compelling for the core digital advertising business. Just like we didn’t need oil for a while, the economy doesn’t need as much digital advertising when it is in a recession and interest rates are climbing. Once we exit a recession and lowered interest rates put more buying power back in the pocket of the consumer, digital advertising will be in high demand and possibly more expensive as the industry’s weaker companies will fall by the wayside, reducing the capacity.
Catalysts
To me, the biggest catalysts will simply be economic growth. Advertising, especially for high-ticket items that require debt to purchase by the consumer, will only get back to growth when rate hikes pivot back in the other direction. This could be a long time off, possibly a couple of years. Companies like Meta and Google (GOOG, GOOGL) can float through the rough water. Just like we all needed more energy when we came out of our homes after lockdowns, companies will need more advertising after consumers get back into real estate and auto purchases. By the end of 2023, these companies should be ready to absorb not only increased demand but the demand of smaller firms that didn’t have the balance sheet to make it through these times. Very similar to smaller oil projects being shut down, the larger firms will just absorb their demand.
Let’s also not forget that 2023 will kick off presidential campaigns for 2024. We all know how many billions are spent on digital advertising for the presidential election. Yet another revenue catalyst.
Risks
If Meta continues to be valued as a growth story, we can see a $63 implied value based on a trailing 5-year PEG ratio using analysts’ 2022 estimates. That’s quite a bit of a downside. However, at this point, META becomes more of a value story just being priced lower than the market at less than 10X earnings and 10X free cash flow.
Summary
For investors willing to wait out the metaverse project and its effect on earnings, this is shaping up to be a great deal for the patient. I held back the temptation to write about META at earlier dates, but at under $100 a share, the price has become very compelling. The anti-bubble is certainly in Big Tech, and Meta shares have been decimated. However, when every other aspect of a company remains strong except the market sentiment and momentum, that is an opportunity. For a high-quality company like Meta, I’d be very willing to buy at 15X earnings, or $146 and below looking at analysts’ 2022 EPS average estimates. However, I do recognize the downside if the market continues to price this based on growth in the near term versus its strong balance sheet and free cash flow. I am accumulating Meta Platforms here and would place outsized bets if it gets closer to $70.
Be the first to comment