

Ronald Martinez
Introduction
Regarding oilfield equipment and services for the oil & gas industry worldwide, two leading players come to mind first and foremost. Halliburton Company (NYSE:HAL) and Schlumberger Limited (NYSE:SLB). They are the industry leaders.
One significant difference between them is their “business regional focus.” One is mainly North American business-oriented, and the other is more widespread. We can see it clearly in the chart below when we analyze the revenues per region:
HAL versus SLB revenue per region in 3Q22 (Fun Trading)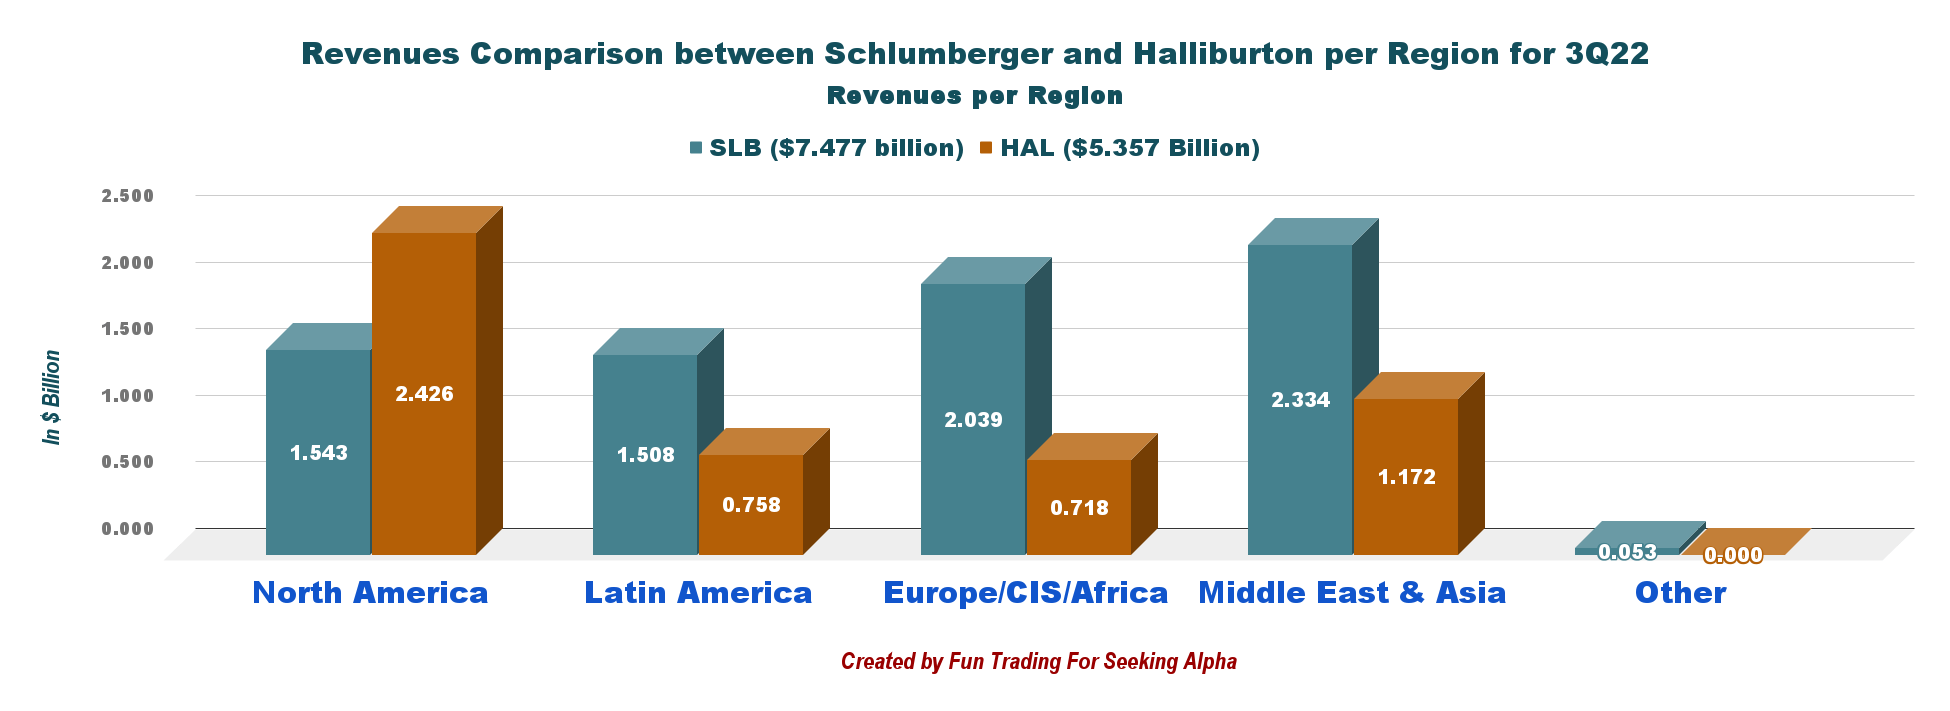
Schlumberger generated 28.4% more revenue than Halliburton in the third quarter of 2022. As we can see, Halliburton generated $2.635 billion in revenue from North America, or 49.2% of its total revenue in 3Q22, versus 20.6% for Schlumberger.
Note: I recommend reading my article on Schlumberger, published on October 25, 2022.
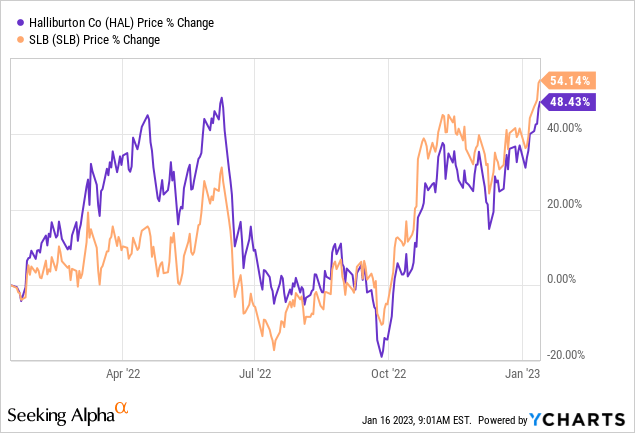
Both companies have generated significant returns over the twelve months. HAL has gained 48.4% over this period, while SLB returned 54.1%.
3Q22 Balance Sheet Comparison: HAL versus SLB
The chart below is a thorough comparison between Halliburton and Schlumberger. Most of the metrics favor Schlumberger versus Halliburton.
EBITDA per diluted share shows $3.42 for HAL and $4.09 for SLB, and the trailing 12-month free cash flow is $784 million or $0.86 per diluted share for HAL versus $2,545 million or $1.80 for SLB.
Conversely, Halliburton has a better debt profile than SLB, with net debt of $$5.05 billion in 3Q22 versus $9.74 billion for SLB. It is $5.56 per diluted share for HAL versus $$6.88 for SLB.
The dividend yield is very similar and is around 1.2%.
You can access the SLB detailed balance sheet in my article reference earlier.
HAL versus SLB Balance sheet comparison (Fun Trading)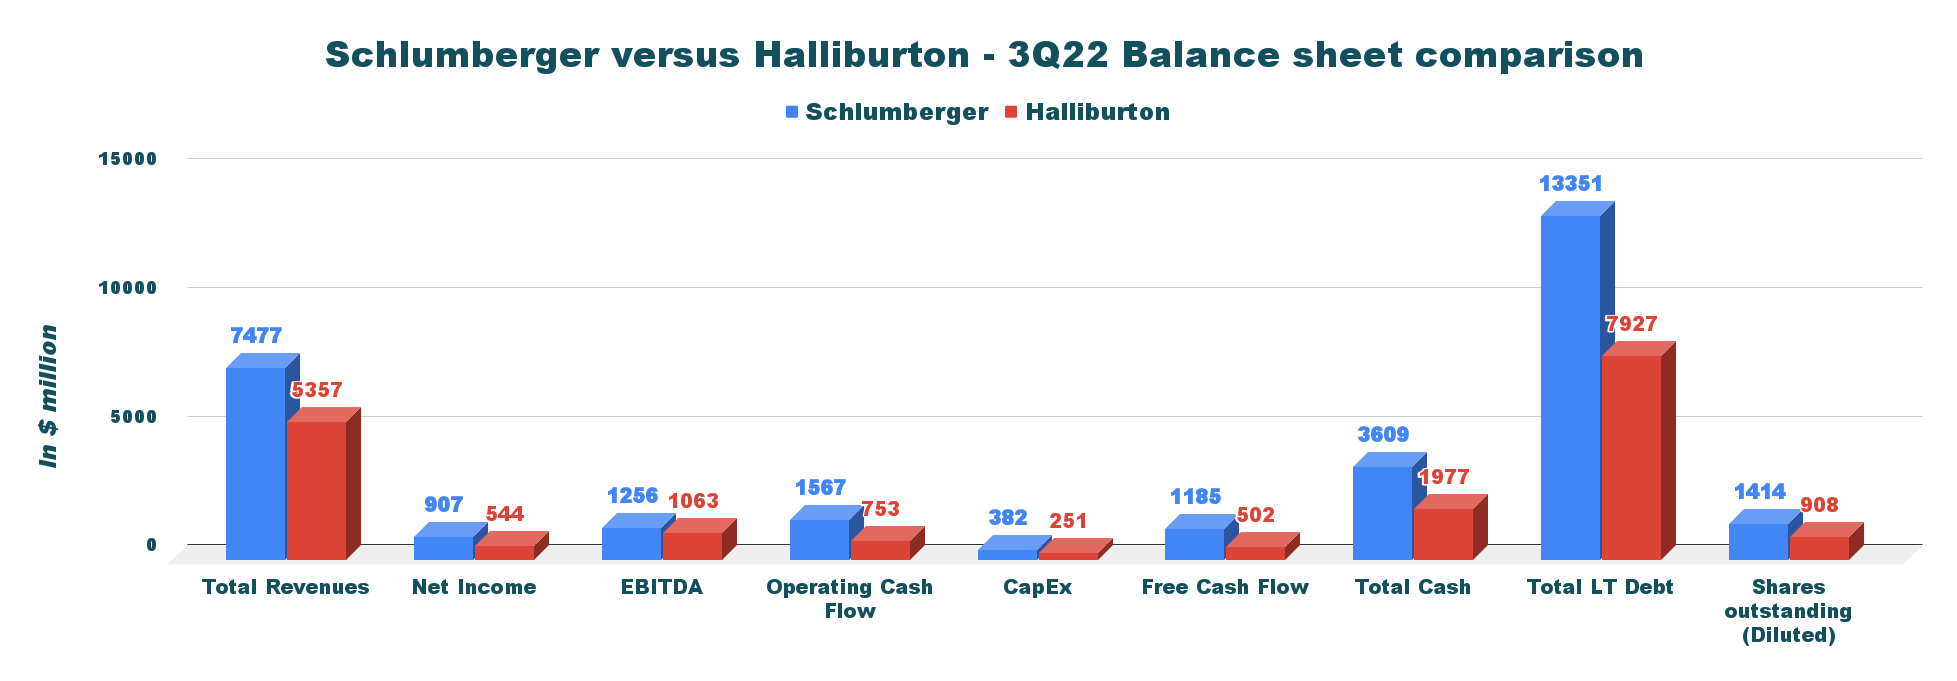
Halliburton: Financials History – The Raw Numbers until third Quarter 2022
| Halliburton | 2Q21 | 3Q21 | 4Q21 | 1Q22 | 2Q22 | 3Q22 |
| Total Revenues in $ Billion | 3.71 | 3.86 | 4.28 | 4.28 | 5.07 | 5.36 |
| Net income in $ Million | 227 | 236 | 824 | 263 | 109 | 544 |
| EBITDA $ Million |
652 |
671 |
757 |
671 |
594 |
1,063 |
| EPS diluted in $/share | 0.26 | 0.26 | 0.92 | 0.29 | 0.12 | 0.60 |
| Operating Cash Flow in $ Million | 409 | 617 | 682 | -50 | 376 | 753 |
| CapEx in $ Million | 191 | 188 | 316 | 189 | 221 | 251 |
| Free Cash Flow in $ Million | 218 | 429 | 366 | -239 | 155 | 502 |
| Total cash $ Billion | 2.66 | 2.63 | 3.04 | 2.15 | 2.23 | 1.98 |
| Total LT Debt in $ billion | 9.64 | 9.19 | 9.13 | 8.53 | 8.53 | 7.93 |
| Dividend per share in $ | 0.045 | 0.045 | 0.12 | 0.12 | 0.12 | 0.12 |
| Shares Outstanding (Diluted) in Million | 890 | 894 | 896 | 903 | 904 | 908 |
Source: HAL filings.
Commentary
Halliburton and Schlumberger are the world’s two most extensive oilfield services. Hence, both companies can be considered suitable long-term investments from a savvy investor’s perspective. Furthermore, the long-term outlook is positive.
What is the global oilfield services industry outlook?
The forecast is good worldwide, with the onshore segment accounting for a significant share of the oilfield services industry. Notably, North America is and will remain the leading region and is anticipated to continue its supremacy in the global market until 2028.
The rising oil and gas production and the development of shale play in the region are expected to stimulate the growth of the oilfield services industry. Moreover, the United States is one of the leading regions in the global oil and gas industry, both in terms of production and consumption. Additionally, the development of horizontal well bores and the availability of advanced completion techniques, such as multi-stage hydraulic fracturing, can further drive the oilfield services industry growth in the region.
However, on December 12, 2022, FitchRatings indicated that oil and gas prices are likely to moderate in 2023:
We expect average oil and gas (O&G) prices to moderate in 2023, not least because of an economic slowdown, but the hydrocarbon markets will remain tight due to lower oil and in particular natural gas supplies from Russia and OPEC+’s cautious stance. O&G companies globally will continue to report high earnings despite windfall taxes introduced by some countries. Inflation will bite but most companies have significantly reduced costs during the period of low oil prices, which will contribute to their cash flows.
Hence, do not expect another stellar year but a healthy one for the industry.
Which is the best, HAL or SLB?
Suppose you have to choose only one company for a personal reason. In that case, Schlumberger seems a slightly better choice fundamentally, as I have explained above, and despite a higher debt profile and lesser exposure in North America which is expected to outperform until 2028.
Additionally, the technical analysis seems to confirm a better outlook for SLB. The chart below shows the ratio SLB/HAL.
SLB versus HAL ratio TA chart (Fun Trading StockCharts)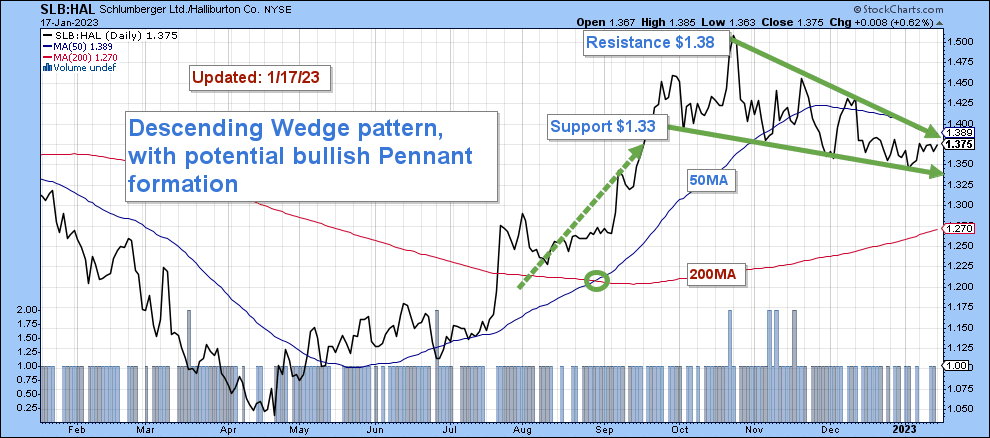
Note: SLB closed at $58.46, and HAL closed at $42.51, a ratio SLB/HAL of 1.375 close to the resistance.
The chart indicates a bullish pennant formation which suggests a possible breakout. The bullish pennant pattern is a bullish continuation pattern that signals the extension of the uptrend after the period of consolidation is over.
This suggests that SLB will probably fare better than Halliburton in 2023 and beyond.
However, is it a good time to buy HAL or SLB?
On the conservative side, HAL and SLB are now clearly overbought with an RSI close to 70, which is considered a sell signal. The stocks could eventually go a little higher so. Hence, it is not the time to buy but the time to take profits.
Thus, I recommend selling a part of your HAL and/or SLB position, expecting some possible correction soon.
I suggest trading short-term (using the LIFO method) 50% of your position and waiting for a significant retracement to buy back again, possibly in 2Q23.
Warning: The TA chart must be updated frequently to be relevant. It is what I am doing in my stock tracker. The chart above has a possible validity of about a week. Remember, the TA chart is a tool only to help you adopt the right strategy. It is not a way to foresee the future. No one and nothing can.
Author’s note: If you find value in this article and would like to encourage such continued efforts, please click the “Like” button below to vote for support. Thanks.
Be the first to comment