

nicolas_/E+ via Getty Images
Figure 1. Price Target Range (Samuel Eneh Research)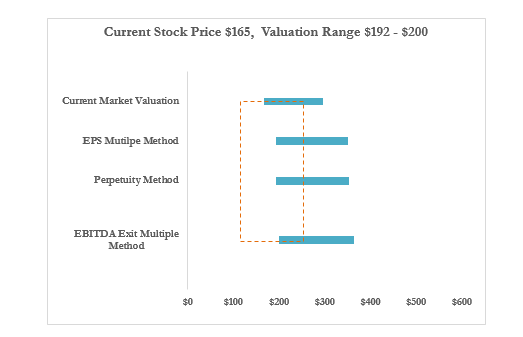
Medpace Holdings Inc. (NASDAQ:MEDP) spooked investors on February 15th, 2022 during its Q4FY21 earnings call. The company reported a 10% Request For Proposal (RFP) decline in 2H21 vs 1H21 and a 25% RFP decline in January 2022 vs January 2021. RFP in the Contract Research Organization (CRO) space typically lags awards and backlogs by several quarters. Awards/backlogs provide some visibility into potential revenue. Simply put, a decline in RFP can be a sign of future revenue decline. An increase in RFP is a sign of a good funding environment; CROs need a robust funding environment to support business growth.
As Medpace’s RFP news hit the market, the stock price dropped 21% in a matter of hours. Investors wary of the potential impact of Russia’s invasion of Ukraine on the global market (Russia was massing troops on the Ukrainian border at the time), and primed to penalize any stock that display a sign of deterioration in fundamentals, sold off Medpace stock as the news was released though the stock has recovered some since then.
Figure 2. Net New Business Awards (Company Reports)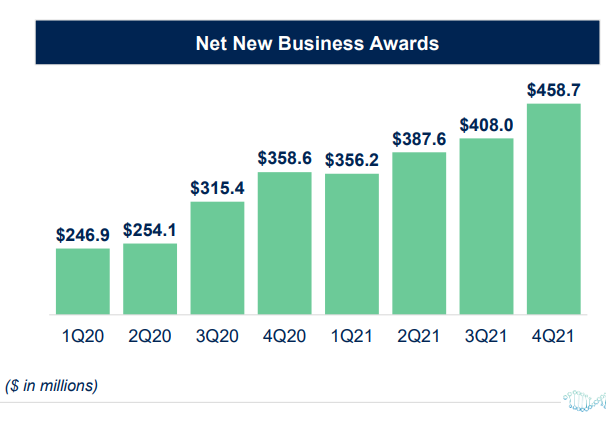
Is Medpace RFP decline a sign of deterioration in the funding environment? After listening to and reviewing earnings calls and financial data from Medpace’s five major competitors in the CRO space, I believe that Medpace’s RFP decline is simply part of the ebbs and flows of its business. CRO space has enjoyed a robust funding environment in recent years and had a record funding year in 2020, partly due to COVID. The 2020 record funding flowed 1H21, as we accelerated into 2021, things started to normalize, therefore, Medpace 2H21 RFP data is against some overflow from the 2020 record funding year. The same applies to January 2022 vs January 2021 RFP data.
Figure 3. Ending Backlog and Est. NTM Backlog Conversion (Company Reports)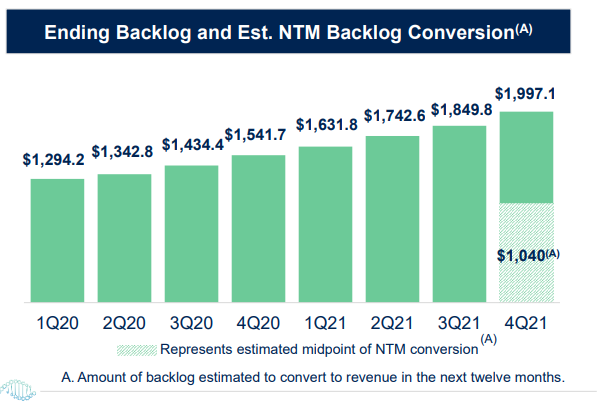
The price dislocation investors witnessed since the earnings reports present a buying opportunity. Based on the research in this report, I’m issuing a buy recommendation on Medpace. Price target $192-200, approximately 19% upside from the Medpace $165 trading price. Additionally, I anticipate further price dislocation as Medpace reports Q1FY22 earnings given that Q1FY22 RFP would be against tough comps from Q1FY21. I believe the CRO funding environment is starting to normalize from 2020 record levels, if the CRO funding environment begins to deteriorate due to recession or any other exogenous variable, this report will be updated appropriately.
Company Description
Figure 4. Revenue (Company Reports)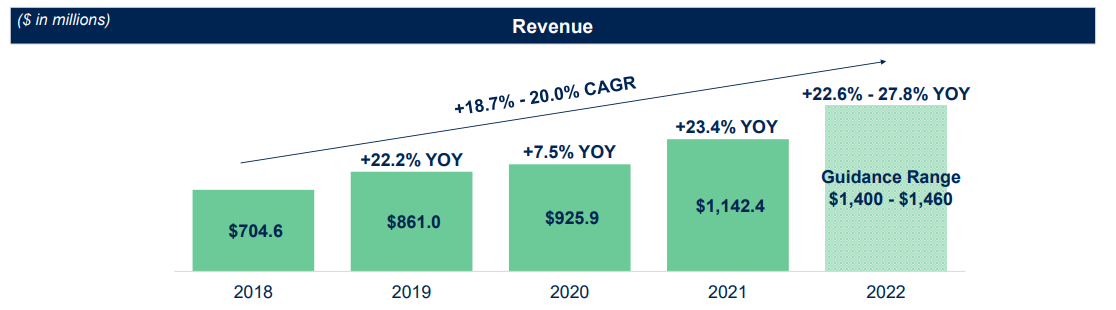
$5.6B market cap Medpace Holdings is a CRO player headquartered in Cincinnati, Ohio with approximately 4500 employees. To be descriptive, for a pharmaceutical or biotech company like Pfizer (PFE), Moderna (MRNA), etc. to successfully discover and market a drug, often requires clinical trials. Some of the trials are done in-house, sometimes outsourced to third parties known as contract research organizations (CROs). Medpace happens to be one of them, so is Syneos Health (SYNH), IQIVIA (IQV), LabCorp (LH), Charles River (CRL), ICON plc (ICLR), etc.
Medpace’s strength lies in phase I-IV clinical trials across major therapeutic areas like Oncology 32% FY21 Revenue, Metabolic Diseases 14%, Cardiology 10%, Anti-Viral and Anti-infective (AVAI) 10%, Central Nervous System (CNS) 11%, and Other 23%. Medpace is a customer of choice in the aforementioned therapeutic areas for small and midsize biotech companies. Medpace’s backlog which provides visibility into the company’s potential revenue is approximately $2B as FYE21 and backlog conversion to revenue rate is approximately 17-18%. Net Book-to-Bill which is new business awards divided by revenue, net, is 1.41 as of FYE21. Small biotech companies represent 77% of Medpace FY21 topline and midsize biotech represent 16%, while large pharma accounts for 7%.
According to Proficient Market Insight, CRO is a “$63.5B market, expected to grow at 11.8% CAGR through 2028”. CRO phase I-IV penetration is less than 50%.
How is Medpace different from the peers mentioned above? See Market Positioning below.
Figure 5. Historical Growth (Samuel Eneh Research)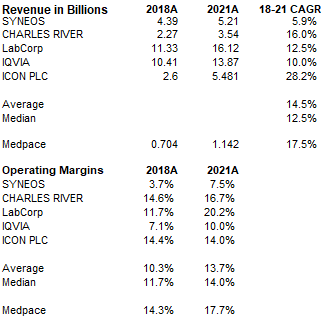
Market Positioning
- Medpace is different from peers in two ways. Medpace offers full service at a fixed price with no ancillary services like FSP, whereas peers like Syneos Health etc. offer various ancillary services including but not limited to commercialization and FSP.
- Medpace generated 77% of its FY21 topline from small biotech firms and 16% from midsize biotech firms, thus, approximately 93% of Medpace’s topline comes from small and midsize biotech/pharma. Whereas Medpace peers generate half or more of its revenue from large pharma.
The implication of Market Positioning
- The CRO space is driven by the funding environment. In the past few years, we have had a robust funding environment. Disruption in the funding environment i.e. recession would adversely affect all the CRO players including Medpace, the difference is just the degree of impact. The impact on Medpace could be higher given that Medpace clients are mostly small and midsize biotech firms, of which some are pre-revenue companies funded by VCs, and PEs – who will likely halt funding if the economy goes south, thus, lead to cancellation of contracts awarded to Medpace. In contrast to peers like Syneos with 49% of FY21 revenue coming from top 50 large pharma such as Pfizer, Moderna, etc. with strong balance sheet that could support clinical trials in a market downturn.
- The implication of offering full service at a fixed price with no ancillary services is akin to one honing their skill in a particular craft. Over time, you become an expert and build a competitive barrier in the target area, though at the expense of missing out on potential revenue from low margins business like FSP and commercialization. Medpace is the customer of choice in Oncology for small and midsize biotech companies. To drive this point home, in 2021 “Clinical Leader and Life Science Leader teamed up with Industry Standard Research (ISR) to determine the 2021 award recipients. 60 contract research organizations were assessed on 20+ performance metrics in ISR’s annual CRO Quality Benchmarking survey. Medpace received five awards across all categories including Capabilities, Compatibility, Expertise, Quality, and Reliability across all three groups of respondents (Big Pharma, Small Pharma, and Overall (combined Big and Small Pharma)”.
Valuation
Figure 6. Valuation Output (Samuel Eneh Research)
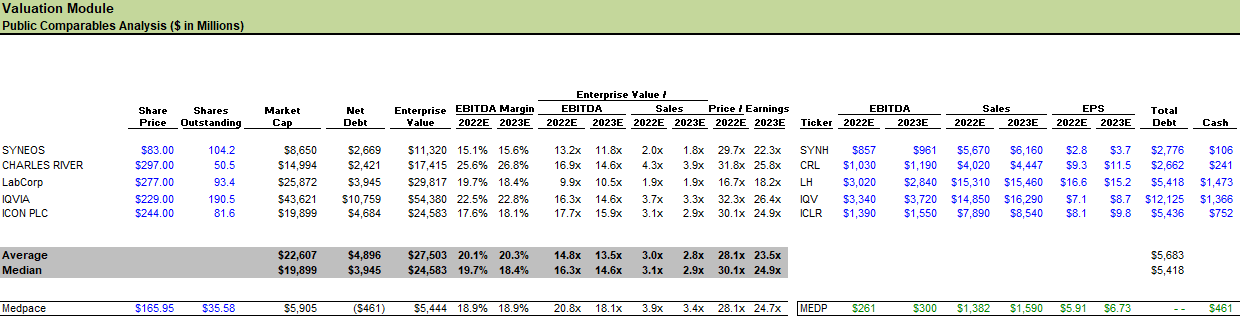
To get a comprehensive valuation of Medpace, I utilized different valuation methodologies to value the company, such as comparable company analysis, DCF including perpetuity and EBITDA Exit Multiple, and lastly, EPS Multiple. As the table above show, I obtained the lowest valuation under comparable company analysis using the 2022 public comps median EBITDA and Revenue multiple of 16.3x and 3.1x, respectively, resulting in a price point of $133. I consider the comparable company analysis specifically Revenue and EBITDA multiples the weakest of the valuation methodologies because of the differences in firm size, the comps are relatively larger than Medpace, and also EBITDA can be manipulated using various accounting principles. Worth noting that the comps capitalize the finance lease on the balance sheet, which is amortized over time, thus, increasing the EBITDA base and correspondingly reducing the multiple. Medpace does not have a finance lease on the balance sheet as of 2021FYE. For more on comps, see the public comps table.
Medpace 2022 and 2023 forward PEs are in line with its peers, thus, with 2022 comps median PE of 30.1x I obtained a price point of $190. Beyond the comparable company analysis. I obtained a price range of $192 to $200 using EPS, perpetuity, and EBITDA Exit Multiple.
Figure 1. Price Target Range (Samuel Eneh Research)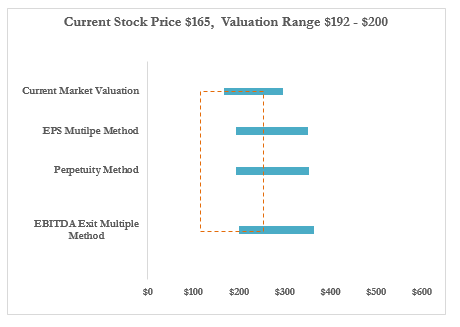
EPS valuation utilizes a discount rate of 6.6% and EPS CAGR of 12% through FY26. Medpace EPS between 2017 and 2021 has a 50% CAGR. Thus, the 12% CAGR is pretty conservative for a base case scenario. Price point is $192.
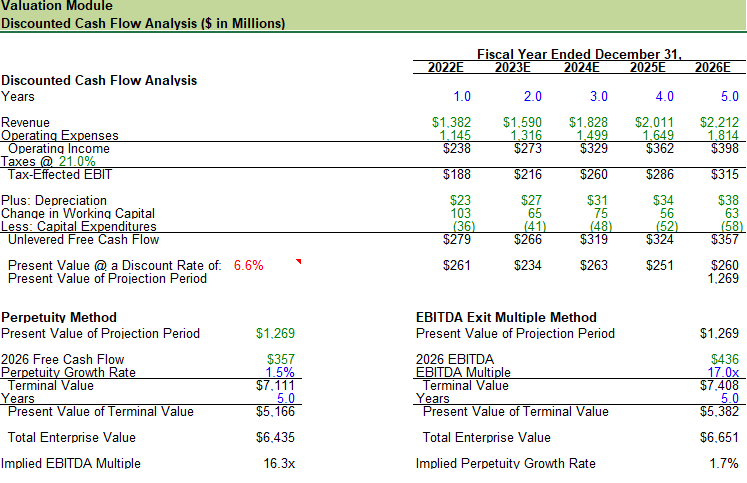
EBITDA Exit Multiple base case implies 17x my 2026 EBITDA estimate of $436M with topline growing at 14% CAGR over the next five years and EBITDA margins improved to 19.7% by FY26. Price point $200.
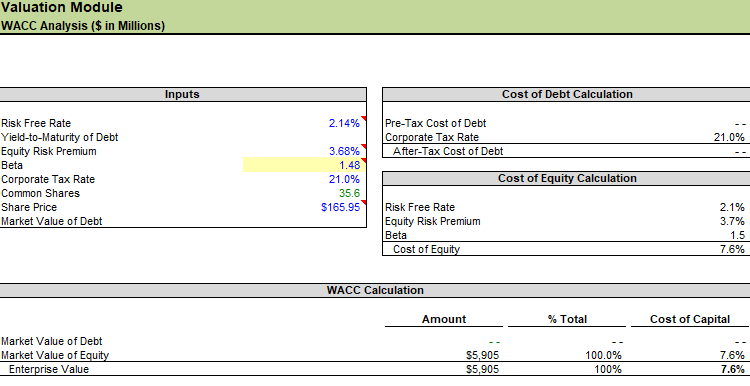
Perpetuity Method base case utilizes my 2026 unlevered free cash flow estimate of $357M and WACC of 6.6%. The model assumes a topline of 14% CAGR over the next five years, worth noting that between FY18 and FY21, Medpace’s topline grew at 17.5% CAGR. Additionally, the model assumes that the operating margin stays at 17.7% on average. Tax Rate 21%. EBITDA growing 13.6% CAGR through FY26, culminating in $436M EBITDA by FY26 while improving the EBITDA margins from 18.9% to 19.7% by YE26. You may wonder why I utilized 6.6% WACC as opposed to the 7.6% obtained in the WACC tab computation (WACC tab and all model tabs are shown at the end of the research). I artificially adjusted the WACC to account for Medpace’s zero balance sheet debt. Price point $194
Catalysts
Short-term: From a strictly short-term perspective, I view the RFP and EBITDA margins as the catalysts for Medpace stock price movement. The RFP declined 10% in 2H21 vs 1H21 and 25% in January 2022 vs January 2020, backlog/awards typically lag RFP by several quarters, thus, declining RFP signals future declining awards/backlog. Medpace’s 18-19% EBITDA margins are in line with its peer group average, however, contract pricing hasn’t kept up with inflationary pressure given that the contracts are fixed. Therefore, I anticipate Medpace would provide some color during the Q1FY22 earnings call on a potential mechanism to address inflationary pressure on EBITDA margins. If we see a further decline in RFP, and/or increased inflationary pressure on margins without a mechanism to address the margins pressure, I anticipate that Medpace stock could decline up to 10% post Q2FY22 earnings release.
Given that we saw a 25% RFP decline in January, I will assign a high probability to Q1FY22 RFP decline, because the Q1FY22 RFP will against Q1FY22 tough comps. Should this event materialize, it would present additional buying opportunity to own a healthy business growing at double-digit organically, with a stronger balance sheet than peers. It’s my view that we’re in a normalized funding environment, Medpace RFP over the next two quarters would likely show decline given that it would be compared to tough comps from 1H21. Medpace RFP decline thus far is not a reflection of the industry funding environment, and should the industry funding environment deteriorate over the next few months, this report will be updated appropriately. I will be watching other CROs to gauge the temperature of the funding environment. Medpace earnings call date; April 26th, 2022. 9 a.m.
Long-term: From a long-term perspective, 1. what variables drive Medpace’s business? 2. What’s the risk of permanent loss of capital? The funding environment is the most important variable for the CRO players, including Medpace. I listened to and reviewed the latest earnings call transcripts from Medpace peers (all five in the public comps tab), and none expressed concern on RFP or the funding environment, which prompts me to argue that the Medpace RFP issue is simply comparison against tough comps from 1H21, which is part of the ebbs and flow of the business as opposed to a sign of deterioration in the funding environment.
Assume the funding environment which would impact all CRO players is a non-factor, the CRO space is a $63.5B industry projected to reach $139B via 11.8% CAGR through 2028. Medpace revenue grew at 17.5% CAGR over the last four year and projected to grow at 14% CAGR over the next five years as the industry grow, and Medpace continues to take 2-3% market share in small and midsize biotech segment. Worth noting that Medpace topline organic growth, and operating margins in the past four years outperformed peer group, see figure 5.
Lastly, regarding the risk of permanent loss of capital, Medpace has zero debt on its balance sheet, the average debt on the peer group balance sheet is $5.7B. Additionally, Medpace holds $461M in cash on the balance sheet, non-GAAP EBITDA grew 17% CAGR over the past four years. Medpace’s 18-19% EBITDA margins are in line with or better than 60% of its peer group. Medpace achieved all this organically, as opposed to its peer group that has done multiple M&A and saddled with debt. For this reason, I artificially reduced Medpace WACC from 7.6% as seen in the WACC tab to 6.6% seen in the DCF tab. The risk of permanent loss of capital on Medpace stock is relatively low compared to its peers.
Investment Risks
- The single most important risk factor for CRO players, Medpace included, is the funding environment. Deterioration in the funding market would adversely affect Medpace.
- Changes in health and regulation could adversely impact Medpace’s business.
- CRO space remain a growing market, however, reductions in R&D spending could adversely affect Medpace.
- CROs are pivoting to hybrid/decentralized trials, however, future lockdown due to COVID could impact Medpace’s ability to recruit patients and adversely affect the topline.
- Medpace contracts are typically fixed, if underpriced could adversely affect the top and bottom line.
Management FY22 Guidance
Management anticipates FY22 revenue in $1.4-1.460B range, implying 22.6%-27.8% y/y growth rate, EBITDA in $262-278M range implying 17.4%-24.6% y/y growth rate, which would translate to GAAP net income $204-216M implying 12.2%-18.8% y/y growth rate and GAAP net income per diluted share $5.35-5.67, 11.2%-17.9% y/y growth rate.
Model Cases
Base Case
The base case assumes a normal funding environment with CRO space growing at 6-7% CAGR over the next few years and Medpace continues to take 2-3% market share in the small biotech segment. Medpace topline growing at 14% CAGR through FY26, worth noting that between FY18 and FY21, Medpace topline grew at 17.5% CAGR. Additionally, the model assumes that the operating margin stays at 17.7% on average. The model account for inflationary pressure on margins, thus, though EBITDA will be growing at 13.6% CAGR through FY26, culminating in $436 EBITDA in FY26, EBITDA margins is expected to drop from 19.5% in FY21 to 18.9% in FY22 then improved to 19.7% by YE26. Tax Rate at 21%, adjusted WACC 6.6%. The base case price target range is $192-200.
Bull Case
The bull case assumes that we maintain the record funding environment we saw in 2020, CRO space growing at low double digits over the next few years, and Medpace continues to take better than expected market share in the biotech/small pharma space. Additionally, the bull case assumes that Medpace topline will be growing 18.6% CAGR through FY26 vs (17.5% FY18-FY21), operating margins through the period will be around 18.8% on average. EBITDA growing 20% CAGR through FY26 which is in line with (FY17-FY21 CAGR of 19.9%), culminating in $567 EBITDA in FY26. The model assumes that Medpace addressed the wage inflationary pressure better than expected, thus, improving the EBITDA margins from 19.7% to 21.2% by YE26. Tax Rate at 21%, adjusted WACC 6.6%. Price target range $250-265.
Bear Case
The bear case assumes a recession, and funding dries up, thus, VC and PE supporting pre-revenue biotech firms decide to withhold funds. Therefore, leading to backlog cancellations, increased cash collection cycle, and a pause on some ongoing clinical trials. The model assumes that these events would translate to revenue growing at 15% in FY22 vs 21% base case-I have not seen backlog cancellation thus far or any other critical data to suggest that recession would have a higher impact than the bear case model project for FY22. However, the model assumes the impact of recession accelerates in FY23 and beyond leading to zero topline growth in FY23, a 5% topline decline in FY24 and FY25, and a 2% rebound in FY26. Operating margins drops to 10% flat across the period, while EBITDA declined 10.4% through FY26 and EBITDA margins dropped from 16.7% in FY22 to 11.7% in FY26. Tax Rate 21%, adjusted WACC 6.6%. Price target range $57-66
Note: The model is detailed, descriptive, and dynamic. Each tab may be linked to one or multiple tabs for dynamism. I built the model from data and information gathered from multiple sources including 10-k, 10-Qs, Earnings Call Transcript, Bloomberg, MSN Money, Yahoo Finance, and NYU Aswath Damodaran webpage. Docoh.com. Some of the forward projections are based on my knowledge of the company, industry, and overall assessment of all the available data, whereas some, like 2022 projection are based on Medpace 2022 guidance.
Base Case Model
Income Statement (Samuel Eneh Research)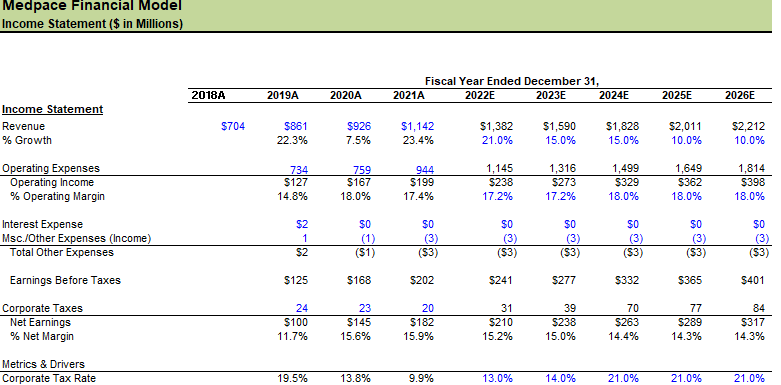
Balance Sheet (Samuel Eneh Research)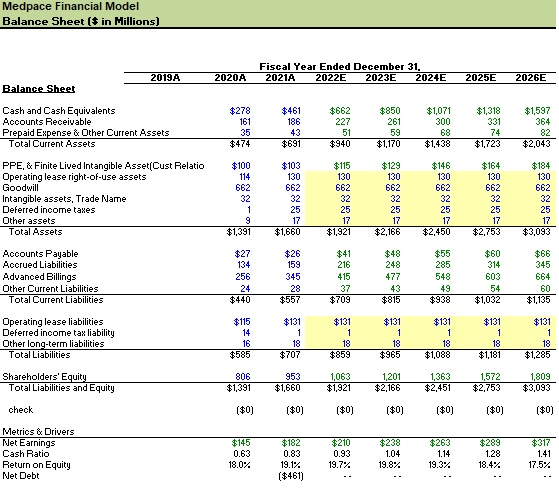
Cash Flow Statement (Samuel Eneh Research)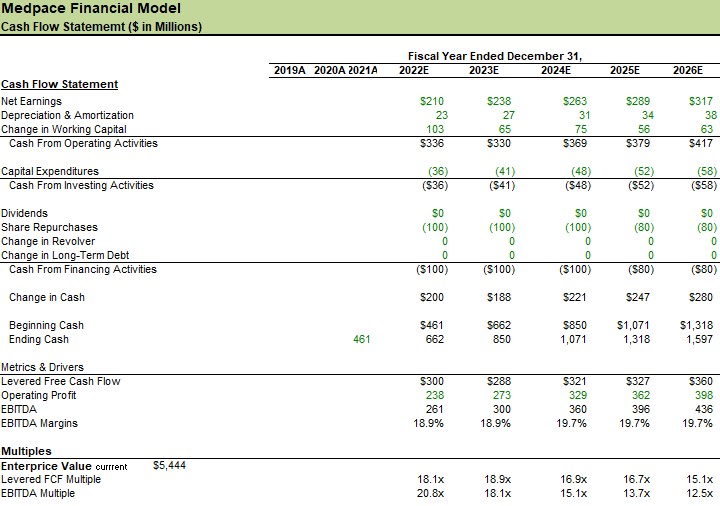
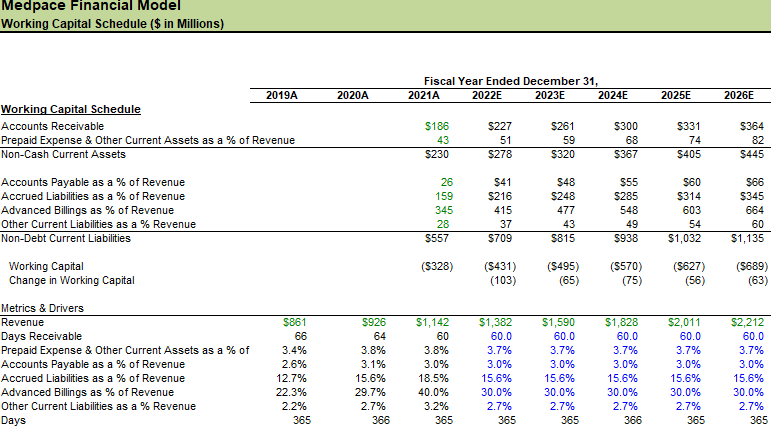
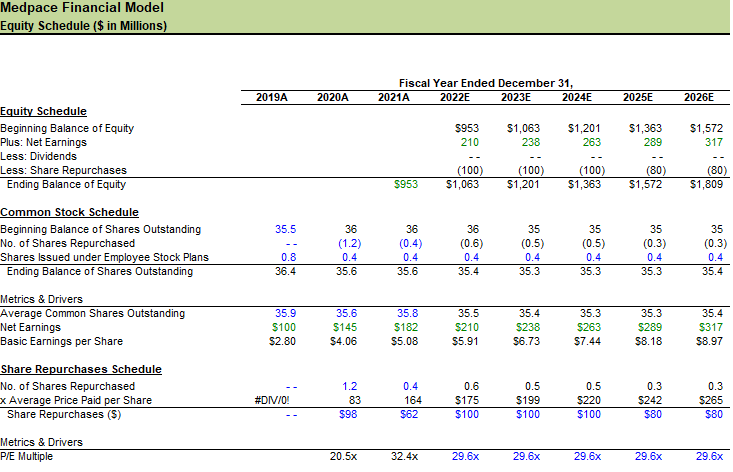
Fixed Asset Schedule (Samuel Eneh Research) Working Capital Schedule (Samuel Eneh) Equity Schedule (Samuel Eneh) Public Comps (Samuel Eneh Research) WACC Analysis (Samuel Eneh Research)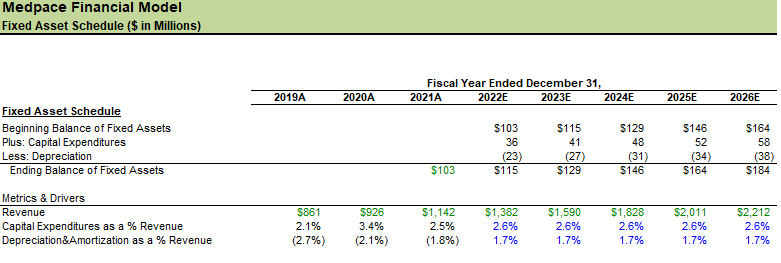
Valuation Output (Samuel Eneh Research) DCF Analysis (Samuel Eneh Research)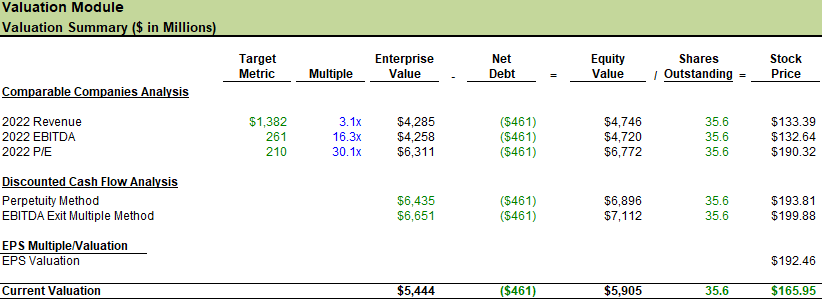
Equity Schedule + EPS Valuation (Samuel Eneh Research)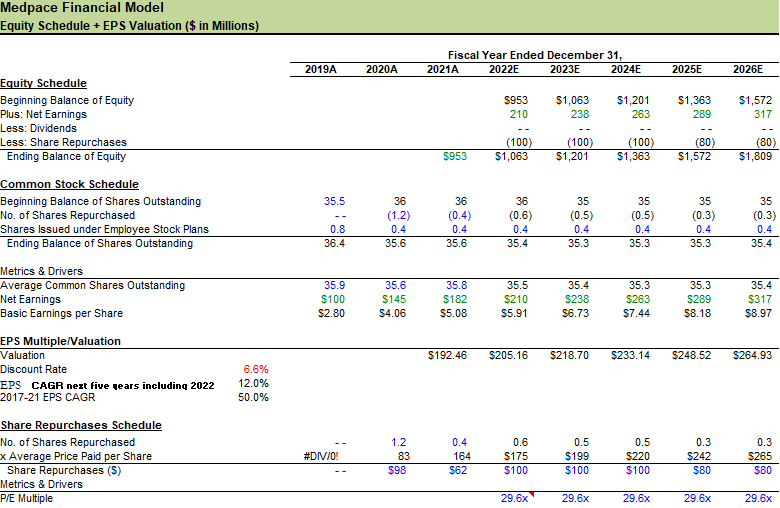
Be the first to comment