

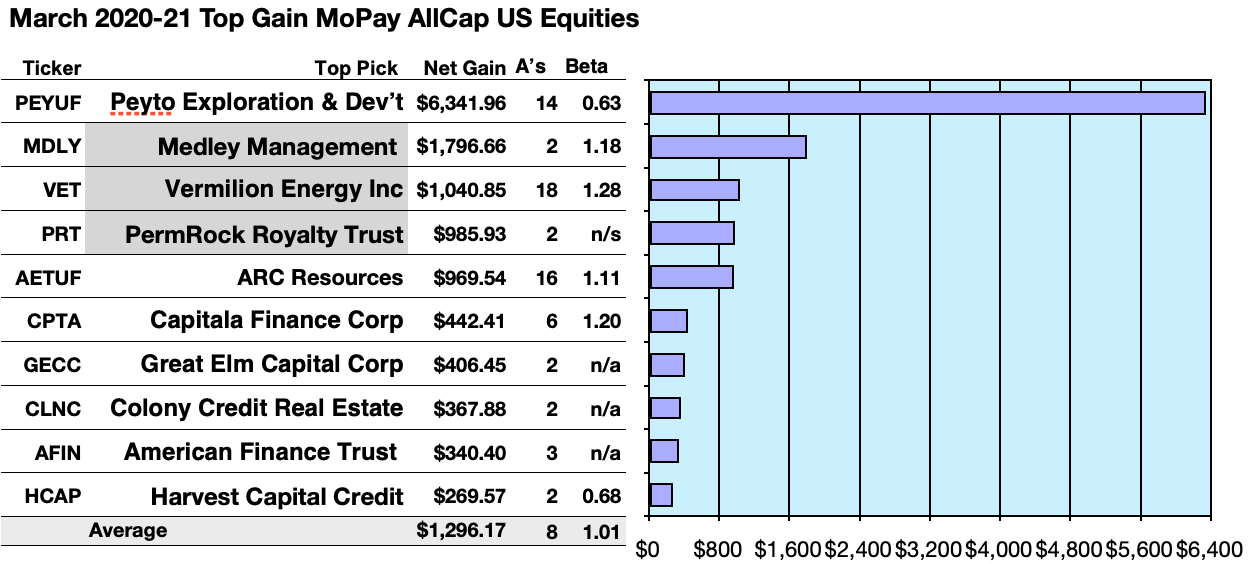
Actionable Conclusions (1-10): Brokers Estimated Top Ten MoPay Equities To Net 26.96% to 634.2% Gains By March 2021
Three of the ten top-yield MoPay stocks (shaded in the chart below) were verified as being among the top-ten gainers for the coming year based on analyst one-year target prices. Thus, the yield-based strategy for this MoPay group, as graded by broker estimates for this month, proved 30% accurate.
Projections based on estimated dividend amounts from $1,000 invested in each of the ten highest yielding stocks and the one-year analyst median target prices for those stocks, as reported by YCharts, made the data points. Note: one-year target prices from single analysts were not applied (n/a). Ten probable profit-generating trades to 2021 were:
source: YCharts
Peyto Exploration & Development Corp. (OTCPK:PEYUF) netted $6,341.96 based on the median of target price estimates from fourteen analysts, plus dividends less broker fees. The Beta number showed this estimate subject to risk 37% less than the market as a whole.
Medley Management Inc. (MDLY) netted $1,796.66 based on the median of target estimates from two analysts, plus estimated annual dividends less broker fees. The Beta number showed this estimate subject to risk 18% more than the market as a whole.
Vermilion Energy Inc. (VET) netted $1,040.85 based on dividends plus the median of annual price estimates from eighteen analysts less broker fees. The Beta number showed this estimate subject to risk 28% more than the market as a whole.
PermRock Royalty Trust (PRT) was forecast to net $985.93 based on the median of target estimates from two analysts, plus estimated annual dividends less broker fees. A beta number was not available for PRT.
ARC Resources Ltd. (OTCPK:AETUF) netted $969.54 based on dividends plus the median of annual price estimates from sixteen analysts less broker fees. The Beta number showed this estimate subject to risk 11% more than the market as a whole.
Capitala Finance Corp. (CPTA) netted $442.41 based on a median of target price estimates from six analysts, plus dividends less broker fees. The Beta number showed this estimate subject to risk 11% more than the market as a whole.
Great Elm Capital Corp. (GECC) netted $406.45 based on dividend, plus the median of target prices estimated by two analysts, less broker fees. A beta number was not available for GECC.
Colony Credit Real Estate (CLNC) netted $367.88 based on dividends plus the median of annual price estimates from two analysts less broker fees. A Beta number was not available for CLNC.
American Finance Trust (AFIN) netted $340.40, based on dividends plus the median of annual price estimates from three analysts less broker fees. A Beta number was not available for AFIN.
Harvest Capital Credit (HCAP) netted $269.57 based on dividends plus the median of annual price estimates from two analysts less broker fees. The Beta number showed this estimate subject to risk 32% less than the market as a whole.
Average net gain in dividend and price was 129.62% on $1k invested in each of these ten MoPay stocks. This gain estimate was subject to average risk 1% more than the market as a whole.
source: doggiemanners.com

The Dividend Dogs Rule
Stocks earned the “dog” moniker by exhibiting three traits: (1) paying reliable, repeating dividends, (2) their prices fell to where (3) yield (dividend/price) grew higher than their peers. Thus, the highest yielding stocks in any collection became known as “dogs.” More specifically, these are, in fact, best called “underdogs”.
February Monthly Pay Dividend Data
Three lists produced numerous actionable conclusions and several more unnumbered results. To draw these conclusions and results, February 27 closing prices and estimated annual dividends were referenced from YCharts. Monthly pay (MoPay) equity (1) yield and (2) upside potential lists were compared and contrasted against (3) a high yield (and higher risk) MoPay CEICs/ETFs/ETNs list. Note: Ycharts data policy retains frequency of pay status on its lists for one year after termination.
Monthly Pay Dividend Qualities
Quarterly, Semi-Annual and Annual dividend investors anxiously await announcements from a firm, fund, or brokerage to learn if their next dividend will be higher, lower, or paid at all.
Monthly pay stocks, funds, trusts, and partnerships inform the holder every four and one-third weeks by check and/or statement. If the entity reduces or suspends a payment, the holder can sell out of the investment immediately to cut future losses.
This advantage has been curtailed when companies suddenly cut monthly dividends to save cash. Three prominent MoPay firms declared dividend cuts between December 2016 and July 2019.
Former MoPay top ten regular by yield. Bluerock Residential (BRG) announced in December it is retreating to quarterly dividend payments “in keeping with industry tradition.”
Third, Capitala Finance Corp. cut its monthly payout from $0.13 to $0.0833 as of October 30, 2017.
Tahoe Resources (TAHO) skipped its monthly payouts and dropped out as a MoPay resource in 2018.
Top yield stock for October 2016, Orchid Island Capital (ORC), released this cautionary note with its monthly dividend announcements: “The Company has not established a minimum distribution payment level and is not assured of its ability to make distributions to stockholders in the future.” ORC directors proceeded to back-up their words with actions cutting the dividend from $0.14 to $0.11 in February, to $0.09 in March, and to $0.08 since September, 2018.
Recently, in July 2019, ARMOUR Residential REIT (ARR) cut its payout from $0.19 to $0.17.
Upon inspection, the August 2019 YCharts equity list was pared down by removing four former MoPay members: JMP Group (JMP), Global Net Lease (GNL), and Dividend Select 15 Corp. (OTCPK:DVVDF).
The November list scrubbed Pacific Coast Oil Trust (ROYT) which announced curtailment of its dividend as of October.
The U.S. exchange MoPay segment is volatile, transitive, and shrinking. More trades in monthly pay equities are available from Canadian firms, many of which are picking up U.S. OTC authorization.
Most Readers like MoPays:
“[Y]ou list a few issues here whose distributions are rife with RETURN OF CAPTAL [ROC] at its most destructive form, funds that pay you back your own money each and every month in their distributions with no regard to what they truly earn…- these should not be included in any list containing the word “dividend”. –NYer1
“I can enter or exit a position and still reap dividends for at least 2/3s of the quarter. They also smooth the income stream so I have cash at any given time to make a purchase at dips.” –Ed Invests
“At this level of risk, I’m only buying monthly dividend payers. Dividend if cut only [sits] for a month and not a quarter.” –Sinjjn Smythe
“…love those monthly payers.” –Hardog
“Some of us are comfortable investing in Dog stocks because we feel the reward is worth the risk. As long as [my sin stock] continues to pay and raise the dividend like it has for 16 years now, it will have a spot in my portfolio.” —Miz Magic DiviDogs
“One thing to point out: These stocks are not buy & hold. If you buy any of these stocks, set a price where you will sell… trailing stops work real good & with mopays you can get out & get back in without losing a whole quarter of dividends…” –drking
List One:
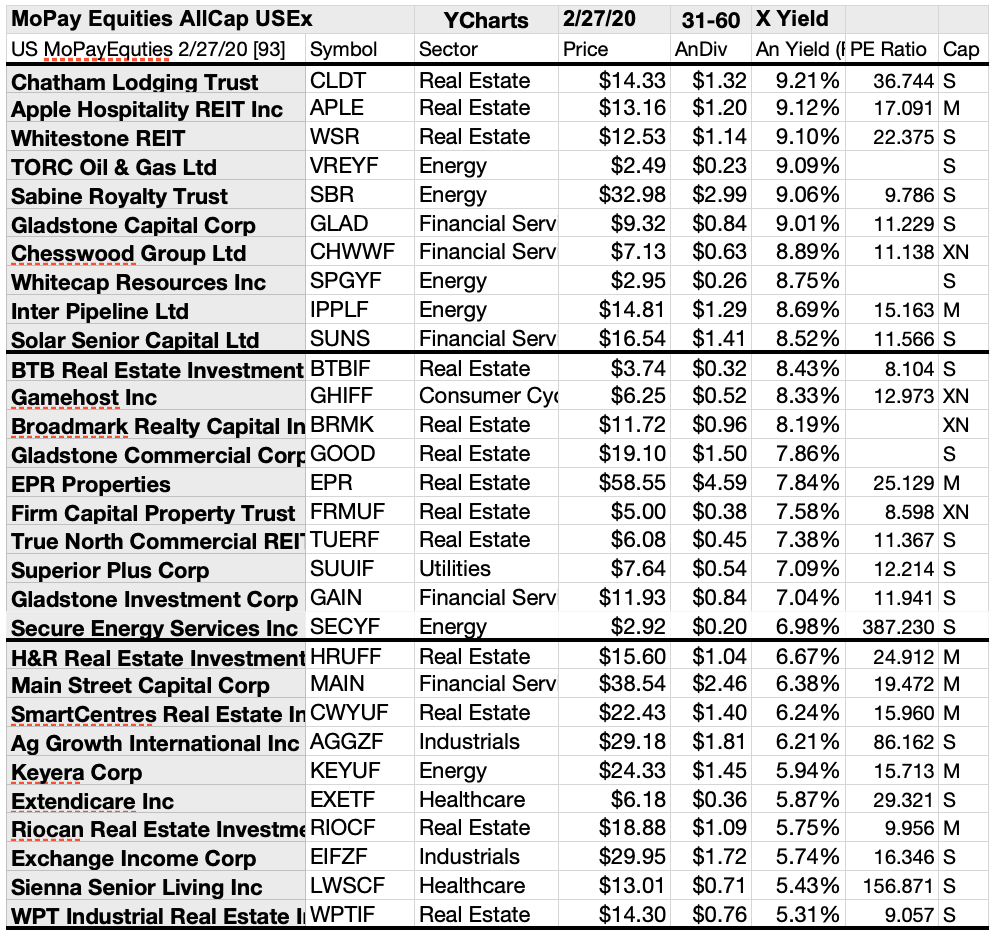
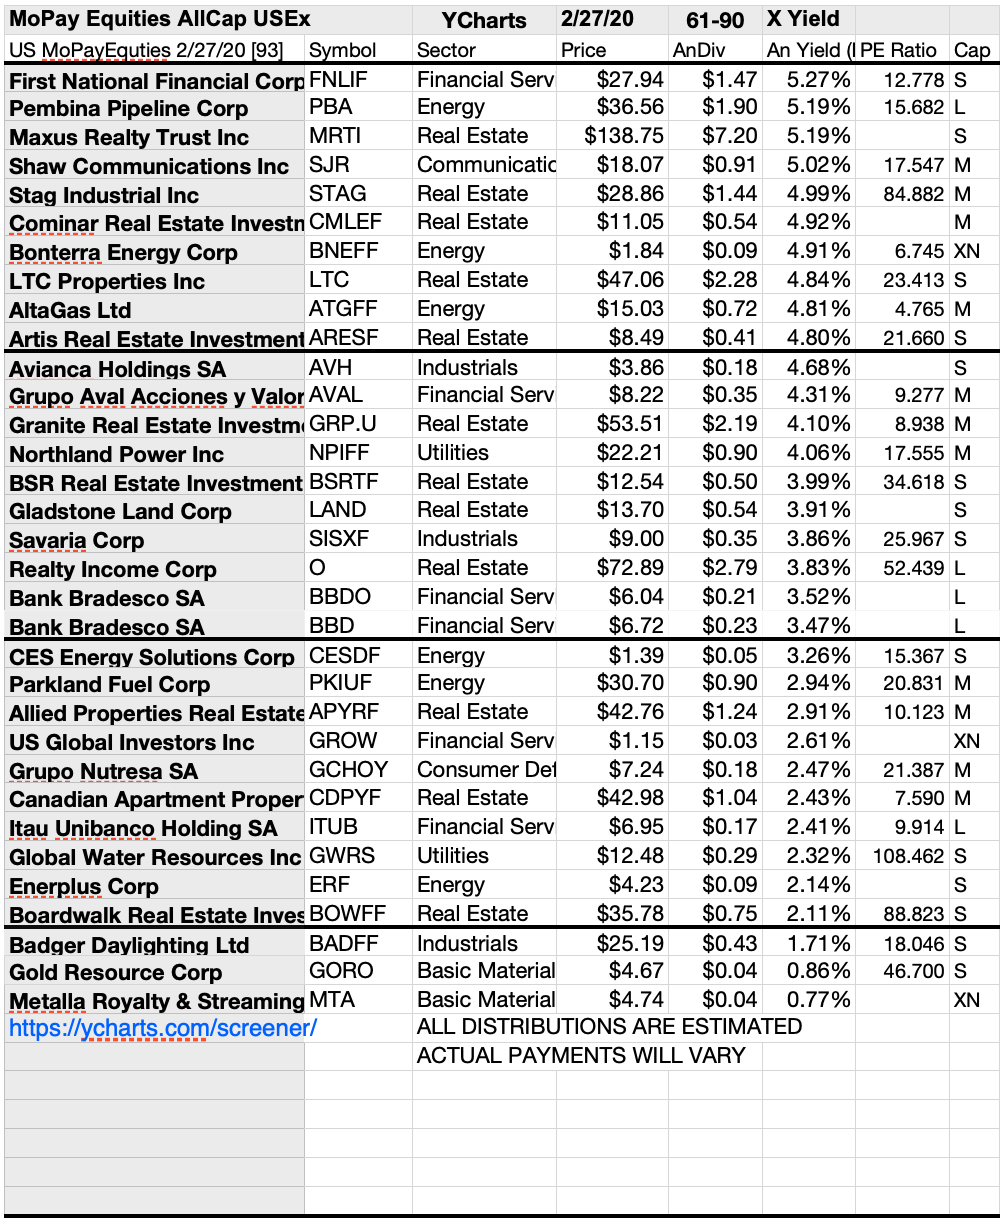
93 U.S. Exchange-Traded Monthly Pay Dividend Equities by Yield
source: YCharts
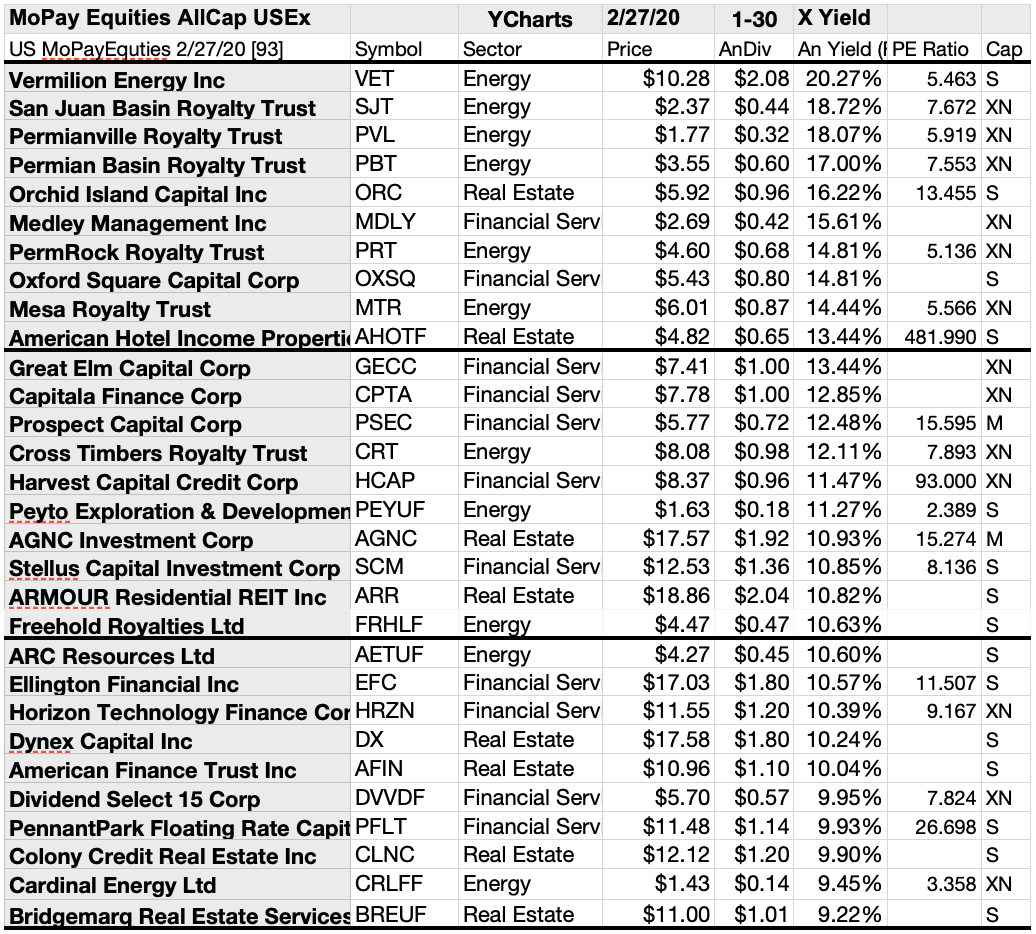
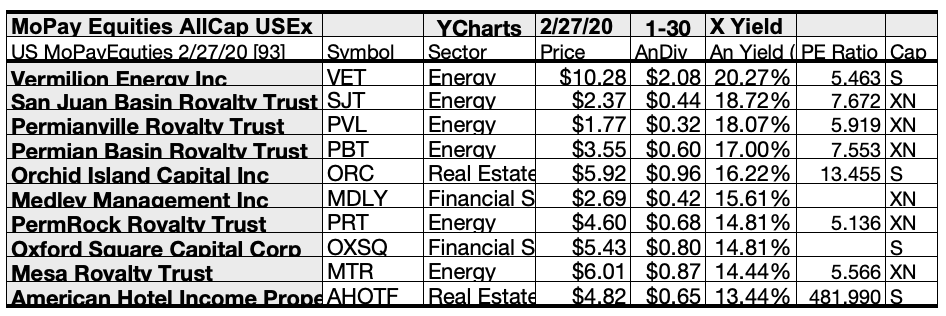
Top ten of these U.S. exchange listed monthly pay dividend equities showing the best yields into March represented three of the eleven Morningstar market sectors, with representative firms split 6, 2, to 2 between the energy, real estate, and financial services sectors.
The first of six energy sector representatives led the top ten by yield, Vermilion Energy Inc. [1]. The other four energy dogs placed second, third fourth, seventh, and ninth: San Juan Basin Royalty Trust (SJT) [2]; Permianville Royalty Trust (PVL) [3]; Permian Basin Royalty Trust (PBT) [4]; PermRock Royalty Trust (PRT) [7]; and Mesa Royalty Trust (NYSE:MTR) [9].
Then two real estate representatives placed fifth and tenth, Orchid Island Capital Inc. [5] and American Hotel Income Properties REIT LP (OTC:AHOTF) [10].
Finally, financial services equities took the two remaining slots, placing sixth and eighth, Medley Management Inc. [6] and Oxford Square Capital Corp (OXSQ) [8], to complete the March MoPay top ten list by yield.
List Two:
Monthly Pay Dividend Equities by Price Upside
The results shown below from YCharts for MoPay dividend stocks as of market closing price February 27 were compared with analyst median target prices one year out. The ten top stocks displayed 6.89% to 48.86% price upsides for the next year based on analyst 1 yr. targets.
source: YCharts
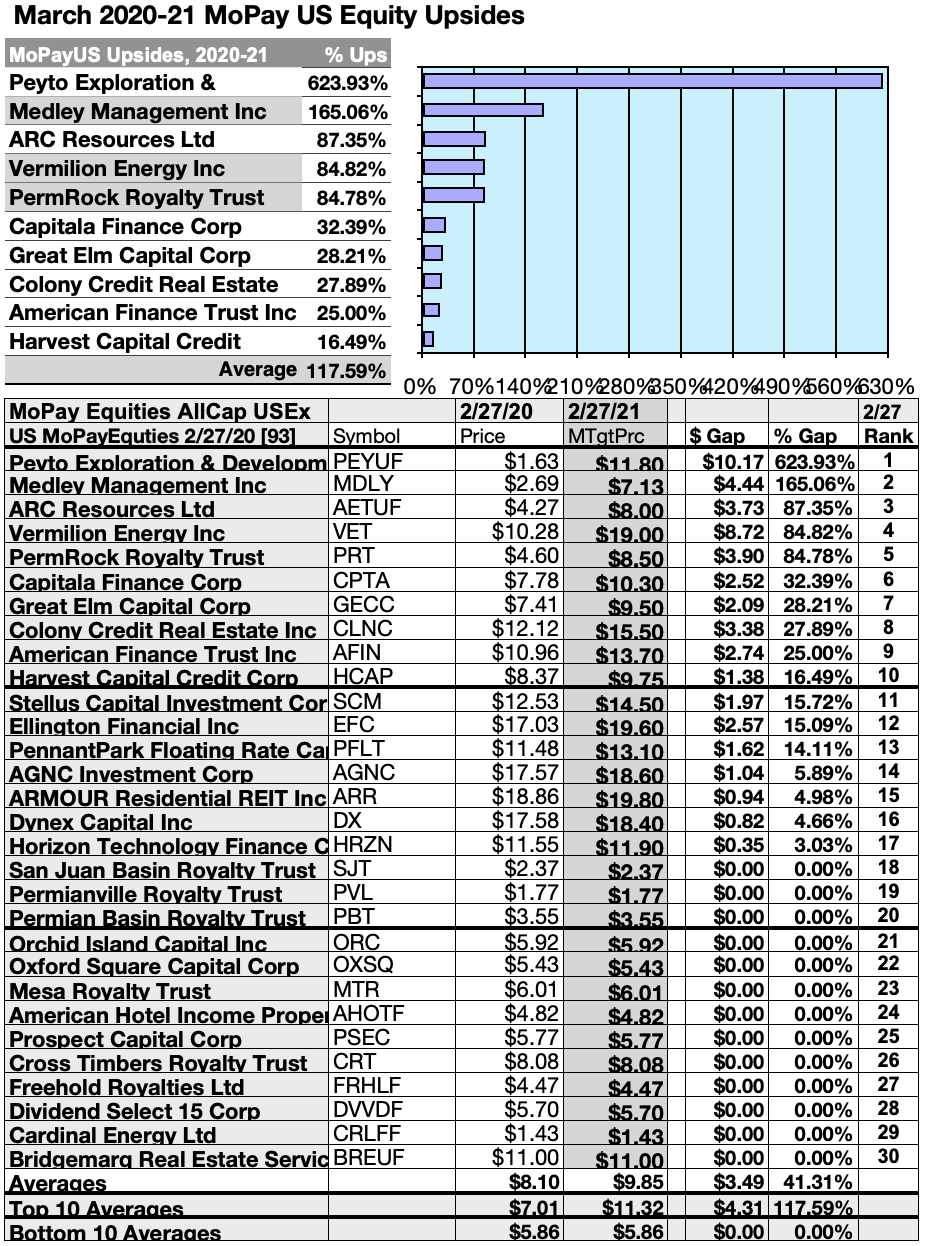
Three (tinted) of the ten on this price upside list were also members of the top ten list by yield. The first five places on this upside list went to: Peyto Exploration & Development Corp. [1], Medley Management Inc. [2], ARC Resources Ltd. [3], Vermilion Energy Inc. [4], and PermRock Royalty Trust [5].
The lower level five were, Capitala Finance Corp. [6], Great Elm Capital Corp. [7], Colony Credit Real Estate Inc. [8], American Finance Trust Inc. [9], and Harvest Capital Credit Corp. [10].
Price upside, of course, was defined as the difference between the current price and analyst target one-year median price targets for each stock.
Those ten MoPay stocks showing the highest upside price potential into 2020 were gleaned from 30 selected by yield. Three to nine analysts have historically provided the most accurate median target price estimates.
List Three:
Monthly Pay Dividend Closed End Investment Companies, Exchange-Traded Funds, and Notes by Yield
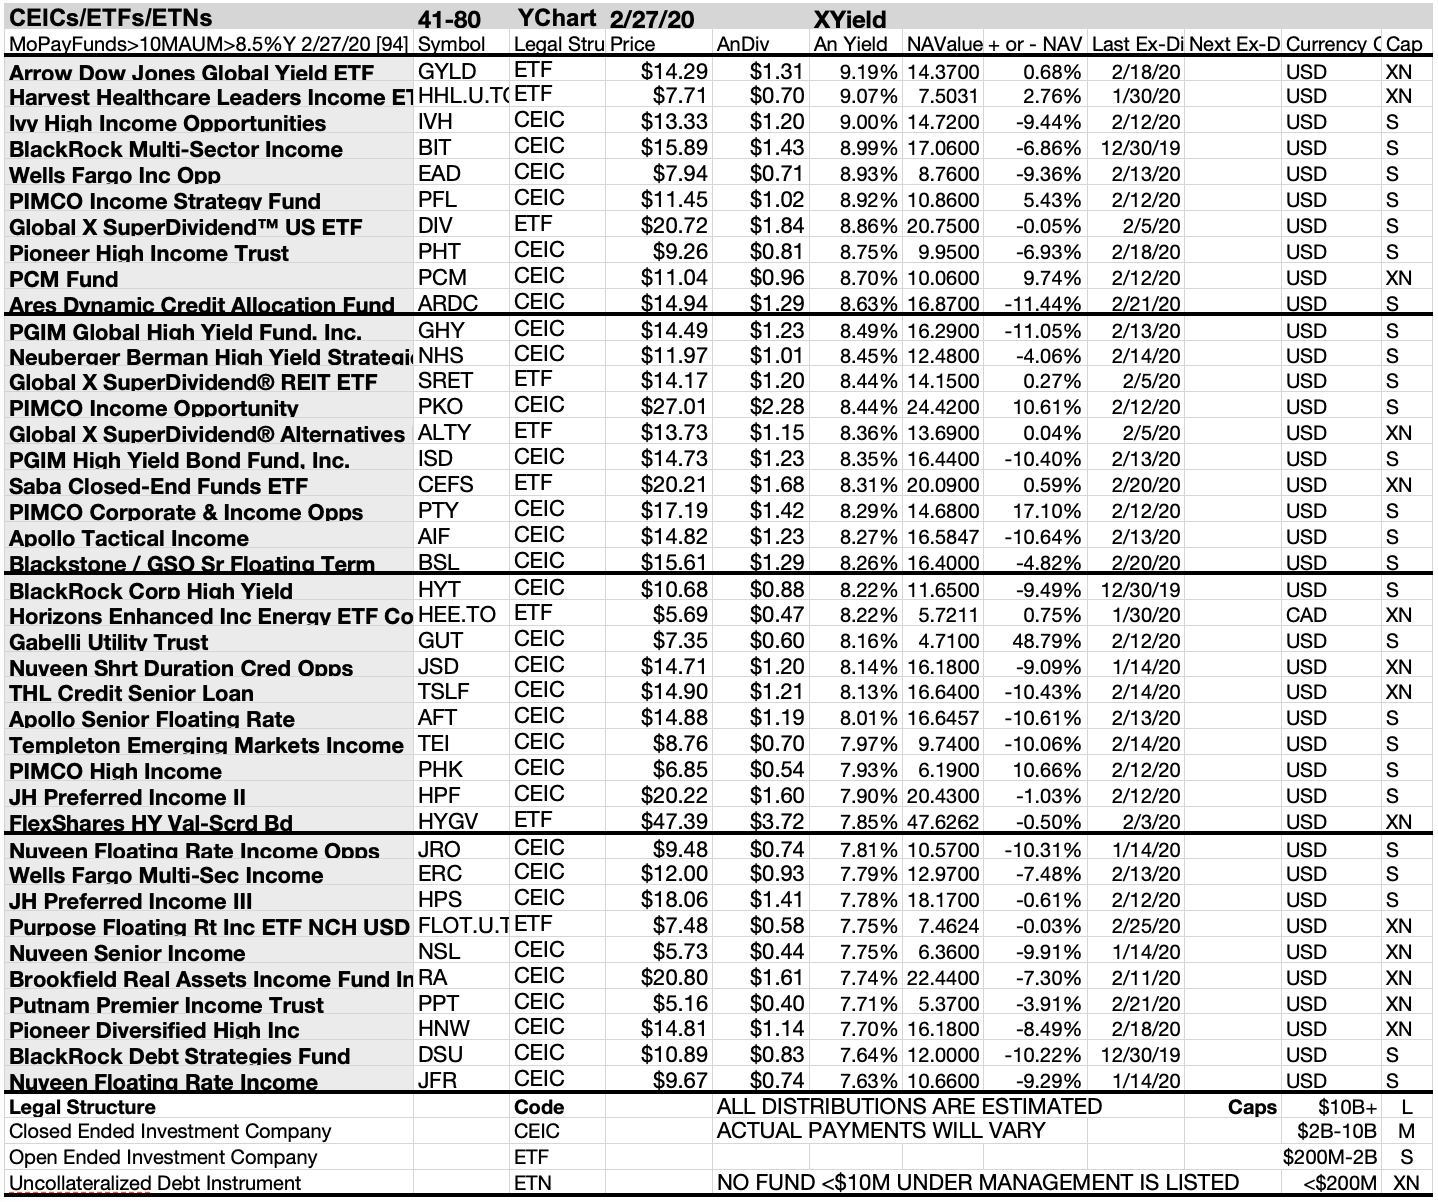
Eighty top monthly dividend paying (MoPay) Closed-End Funds, Exchange-Traded Funds and Notes listed below were culled from nearly 800 candidates. Yields greater than 14% calculated as of February 27 determined the top ten.
source: YCharts
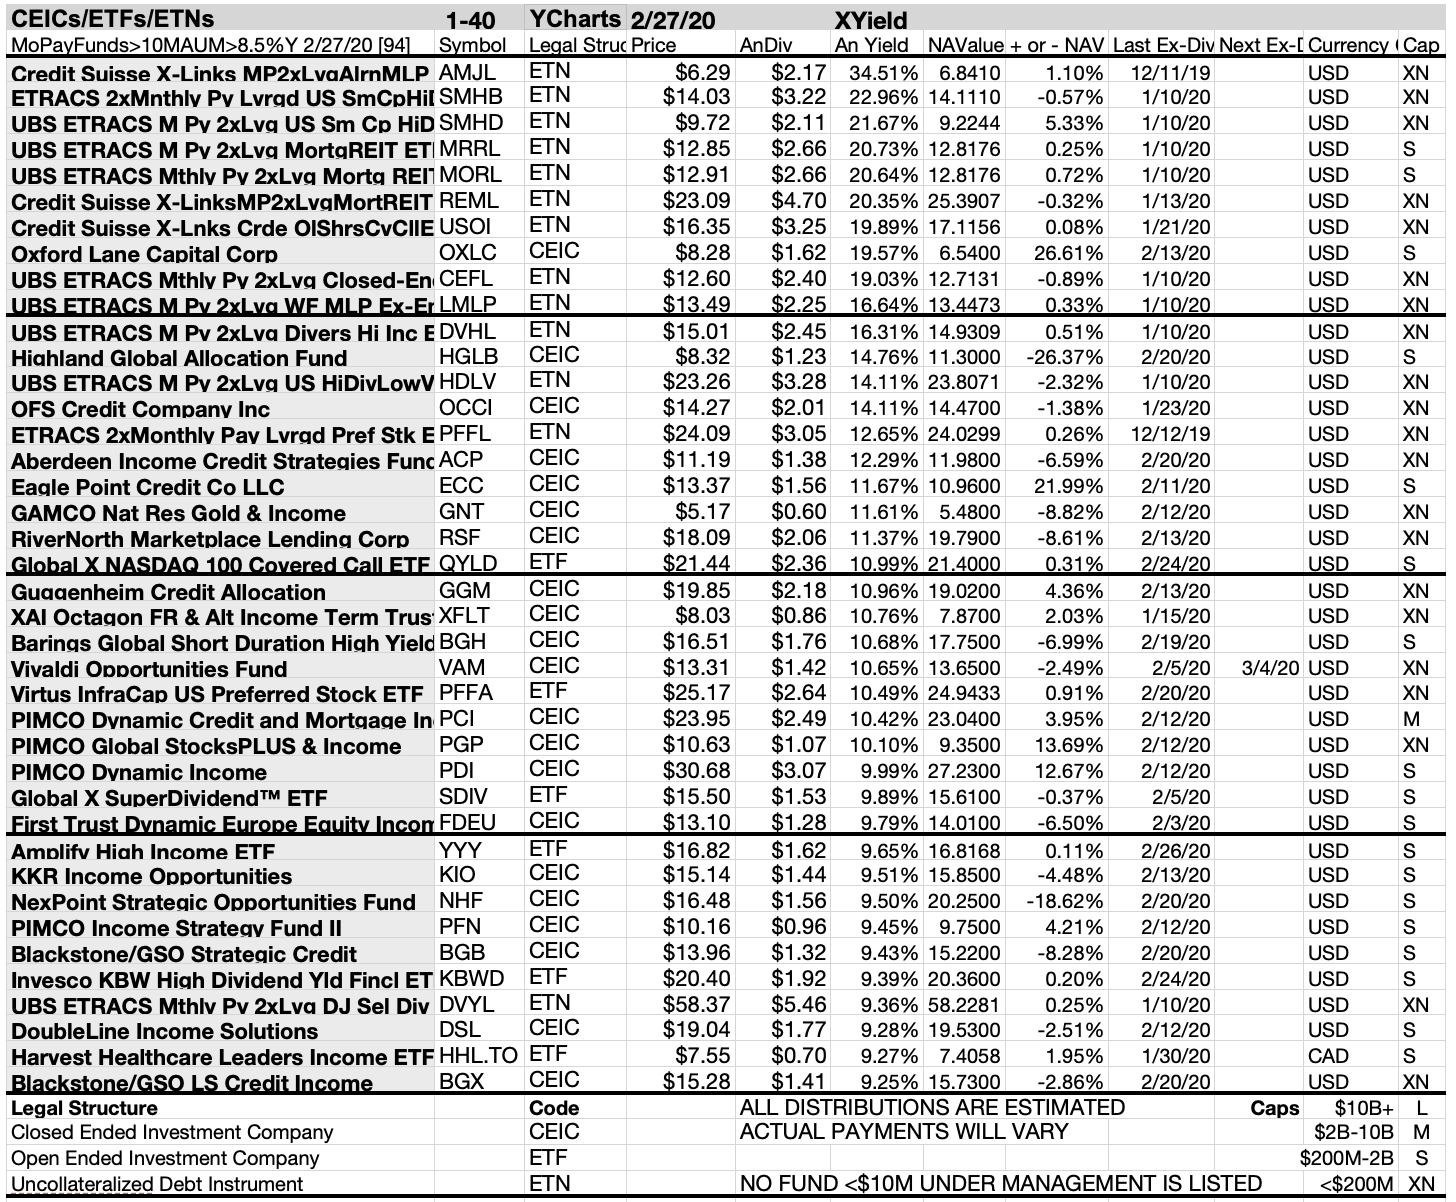
The top ten monthly paying dividend investment companies, funds, and notes showing the biggest yields for per YChart and Yahoo Finance data featured nine uncollateralized debt instruments [ETNs] and one closed-ended investment company [CEIC].
source: YCharts
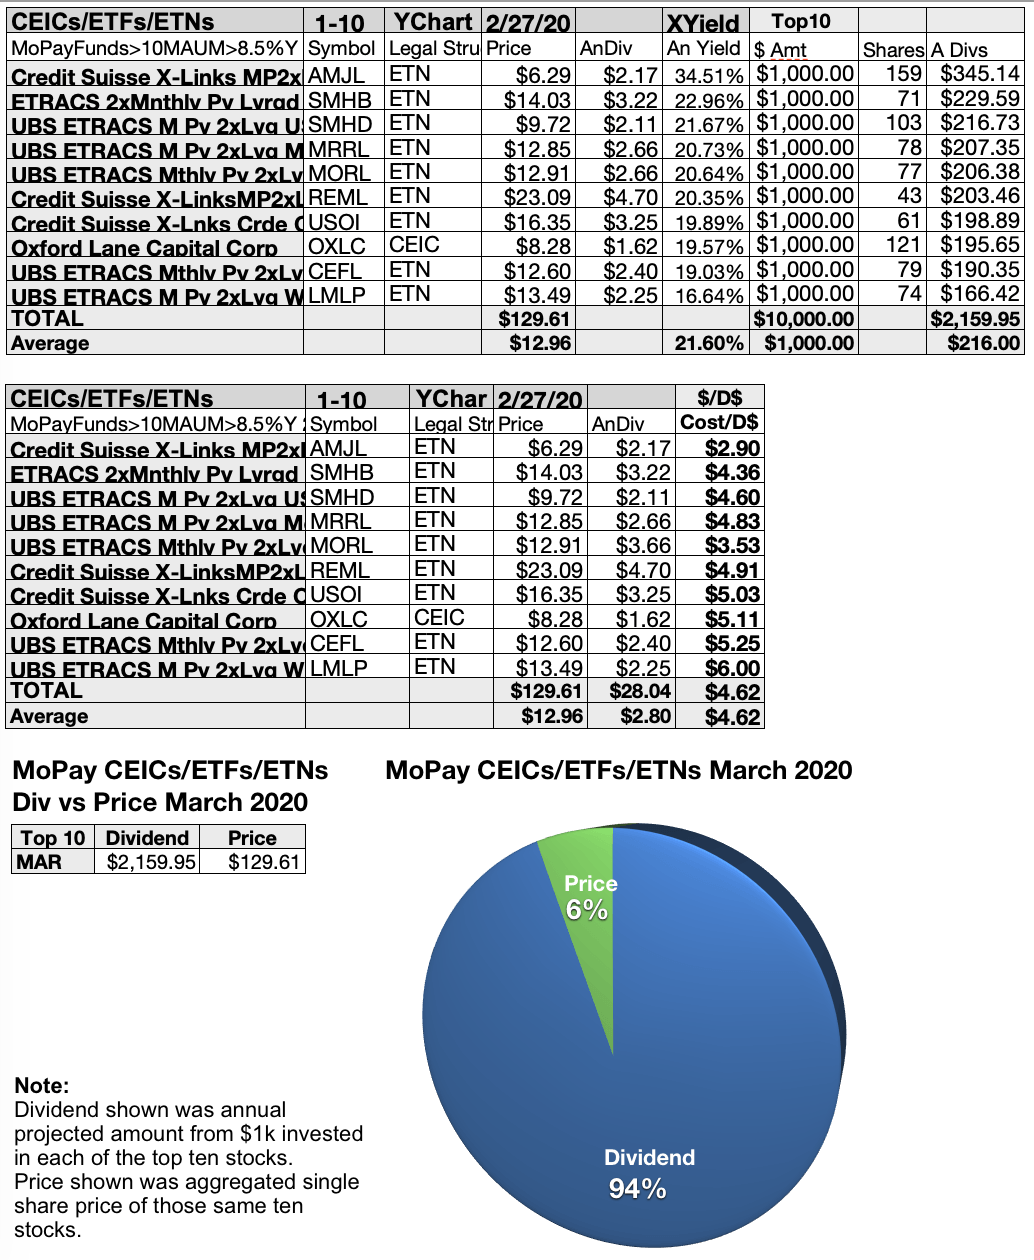
Uncollateralized debt instruments (ETNs) captured the first through seventh, ninth and tenth, positions: Credit Suisse X-Links Monthly Pay 2x Leveraged Alerian MLP Index ETN (AMJL) [1]; ETRACS Monthly Pay 2x Leveraged US Small Cap High Dividend ETN (SMHB) [2]; ETRACS Monthly Pay 2x Leveraged US Small Cap High Dividend ETN (SMHD) [3]; ETRACS Monthly Pay 2x Leveraged Mortgage REIT ETN Series B (MRRL) [4]; UBS ETRACS Monthly Pay 2x Leveraged Mortgage REIT ETN (MORL) [5]; Credit Suisse X-Links Monthly Pay 2x Leveraged Mortgage REIT ETN (REML) [6]; Credit Suisse Crude Oil Shares Covered Call ETN (USOI) [7]; UBS ETRACS Monthly Pay 2x Leveraged Closed-End Fund ETN (CEFL) [9]; ETRACS Monthly Pay 2x Leveraged Wells Fargo MLP Ex-Energy ETN (LMLP) [10].
Finally, one closed end investment company placed eighth, Oxford Lane Capital [8], to complete the top ten Exchange-Traded Notes, Exchange-Traded Funds, and Closed-End Investment Companies list for March 2020.
Compare Equity To Fund Performance
source: YCharts
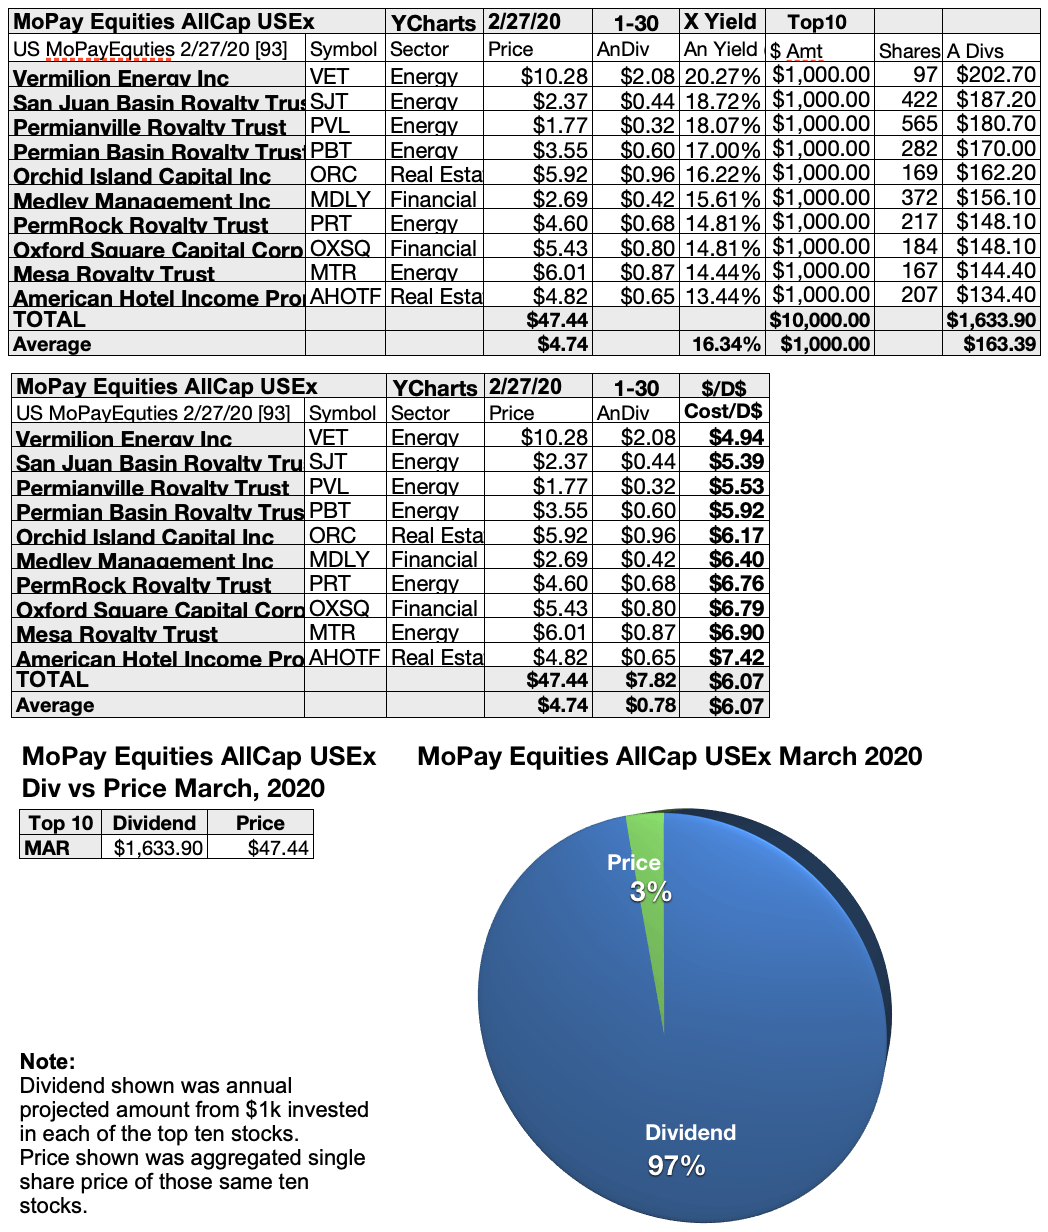
Note that the top ten equity dividends are priced 3% less those of the top ten funds. They were 2% apart in December and November 2019, but in October they were 1% less. For September, equities were 2% under funds, but in August they were equal. The difference is likely found in management fees collected in the fund world and the price of risk.
Background and Actionable Conclusions
Since June 2012, reader suggestions to include funds, trusts, and partnerships, a list of MoPay equities to buy and hold in September 2012 resulted from those reader suggestions supplemented with a high yield collection from here. That list was supplemented by an upside potential article in October and a upside vs. buy & hold in November. Another list factored December 2012 reader comments.
In January, February, March, April, May, June, July, August, September, October, November, and December 2013 readers contributed.
Reader suggestions continued in 2014 following the January, February, March, April, May, June, July, August, September, October, November, and December articles.
2015 continued with readers contributing in January, February, March, April, May, June, July, August, September, October, November, and December.
The 2016 articles in January, February, March, April, May, June, July, August, September, October, November, and December.
The 2017 articles of January, February, March, April, May, June, July, August, September, October, November, and December.
The 2018 articles in January, February, March, April, May, June, July, August, September, and October/November, and December. The 2019 articles in January, February, March, April, May, June, July, August, September, October, November, and December. Now we have a new year and decade of 2020 beginning in January, and continuing in February, and March, to compare and contrast MoPay equity upside potential to the now lower yield (but higher risk) buy and hold Exchange Traded Funds and Notes.
Yield Metrics Found A 35% Advantage For Five Lowest Priced Of Ten High Yield MoPay Equities
source: YCharts
Ten monthly pay stock equities were ranked by yield. Those results, verified by YCharts and Yahoo Finance, produced the following charts.
Actionable Conclusions: Analysts Estimated 5 Lowest Priced of Top Ten High Yield MoPay Dividend Stocks (11) Would Produce 66.8% Vs. (12) 48.8% Net Gains from All Ten by March 2021
source: YCharts
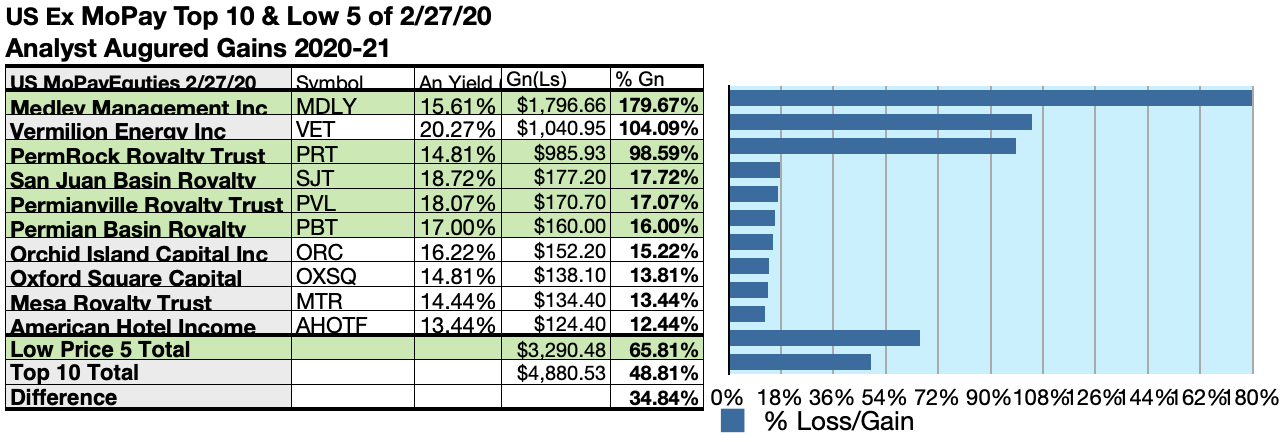
$5,000 invested as $1k in each of the five Lowest priced stocks in the top ten MoPay dividend dog kennel by yield were predicted by analyst 1 year targets to deliver 34.84% more net gain than $5,000 invested as $.5k in all ten. The third lowest priced MoPay dividend dog, Medley Management Inc., was predicted to deliver the best net gain of 179.67%.
source: YCharts
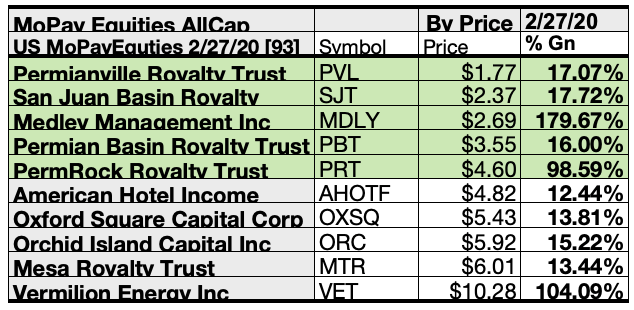
Lowest priced five MoPay dividend stocks estimated as of February 27 were: Permianville Royalty Trust; San Juan Basin Royalty Trust; Medley Management Inc.; Permian Basin Royalty Trust; PermRock Royalty Trust, with prices ranging from $1.77 to $4.60.
Higher priced five MoPay dividend equities estimated as of February 27 were: American Hotel Income Properties REIT LP; Oxford Square Capital Corp.; Orchid Island Capital Inc.; Mesa Royalty Trust; Vermilion Energy Inc., whose prices ranged from $4.82 to $10.28.
This distinction between five low-priced dividend dogs and the general field of ten reflects the “basic method” Michael B. O’Higgins employed for beating the Dow. The same technique, you now see, may someday be usable to find rewarding dogs in the MoPay Stock kennel.
The added scale of projected gains based on analyst targets contributed a unique element of “market sentiment” gauging upside potential. It provided a here and now equivalent of waiting a year to find out what might happen in the market. It is also the work analysts got paid big bucks to do.
Caution is advised, however, as analysts are historically 20% to 80% accurate on the direction of change and about 0% to 20% accurate on the degree of the change.
Gains/declines as reported do not factor-in any tax problems resulting from dividend, profit, or return of capital distributions. Consult your tax advisor regarding the source and consequences of “dividends” from any investment.
Stocks listed above were suggested only as decent starting points for your MoPay dividend stock purchase or sale research process. These were not recommendations.
Disclaimer: This article is for informational and educational purposes only and should not be construed to constitute investment advice. Nothing contained herein shall constitute a solicitation, recommendation or endorsement to buy or sell any security. Prices and returns on equities in this article except as noted are listed without consideration of fees, commissions, taxes, penalties, or interest payable due to purchasing, holding, or selling same.
Graphs and charts were compiled by Rydlun & Co., LLC from data derived from www.ycharts.com; www.dividend.com; finance.yahoo.com; analyst mean target price by YCharts. Dog Photo: doggiemanners.com
Get The MoPay ‘Safer’ Dividend Dog Story
Click here to subscribe to The Dividend Dogcatcher & get more information.
Catch A Dog On Facebook At 8:45 AM every NYSE trade day on Facebook/Dividend Dog Catcher, A Fredrik Arnold live video highlights a portfolio candidate in the Underdog Daily Dividend Show!
Root for the Underdog. Comment below on any stock ticker to make it eligible for my next FA follower report.
Disclosure: I/we have no positions in any stocks mentioned, and no plans to initiate any positions within the next 72 hours. I wrote this article myself, and it expresses my own opinions. I am not receiving compensation for it (other than from Seeking Alpha). I have no business relationship with any company whose stock is mentioned in this article.
Be the first to comment