


Marco Prosch/Getty Images Entertainment
Joyride
Buy the dip. That is what the crowd has been conditioned to do. After all, the Fed has always had your back. They have taken every single step to ensure that asset bubbles were constantly pumped. Why then did we take a negative stance on the 3 funds, PIMCO Income Strategy Fund (NYSE:NYSE:PFL), PIMCO Corporate & Income Opportunity Fund (NYSE:NYSE:PTY) & PIMCO Income Strategy Fund II (NYSE:NYSE:PFN) last year?
Recent Coverage (Seeking Alpha)
Let’s start with 2020 first. The mollycoddling investors had gotten used to, took a whole new level during the pandemic. We had the largest monetary and fiscal stimuli firing off at the same time. The job of the central bank is to prevent fiscal spending from becoming inflationary and instead they suppressed interest rates via quantitative easing. The result was complete bear annihilation.
AMC Entertainment Holdings, Inc. (AMC) with 100X pre-pandemic market capitalization? No problem.
SPACs with no revenues? No problem.
Every absurdity that we had seen previously in investing, was amplified. But underneath the surface things had started to become just a bit…
Dangerous
While the bond bulls were looking at the most heavily distorted market as a signal that inflation was well controlled, we were seeing the opposite. Retail sales were so far above the trend line and supplies were so far below, that we expected inflation to perk up. We expected far higher interest rates, regardless of what the Federal Reserve preached at the time. The longer they took to get their act together, the worse would be the outcome.
It Must Have Been Love, But It Is Over Now
The Fed has now not only acknowledged they are behind the curve but actually said things that would be considered blasphemous pre-2021. Bill Dudley actually said that they would like lower stock and bond prices.
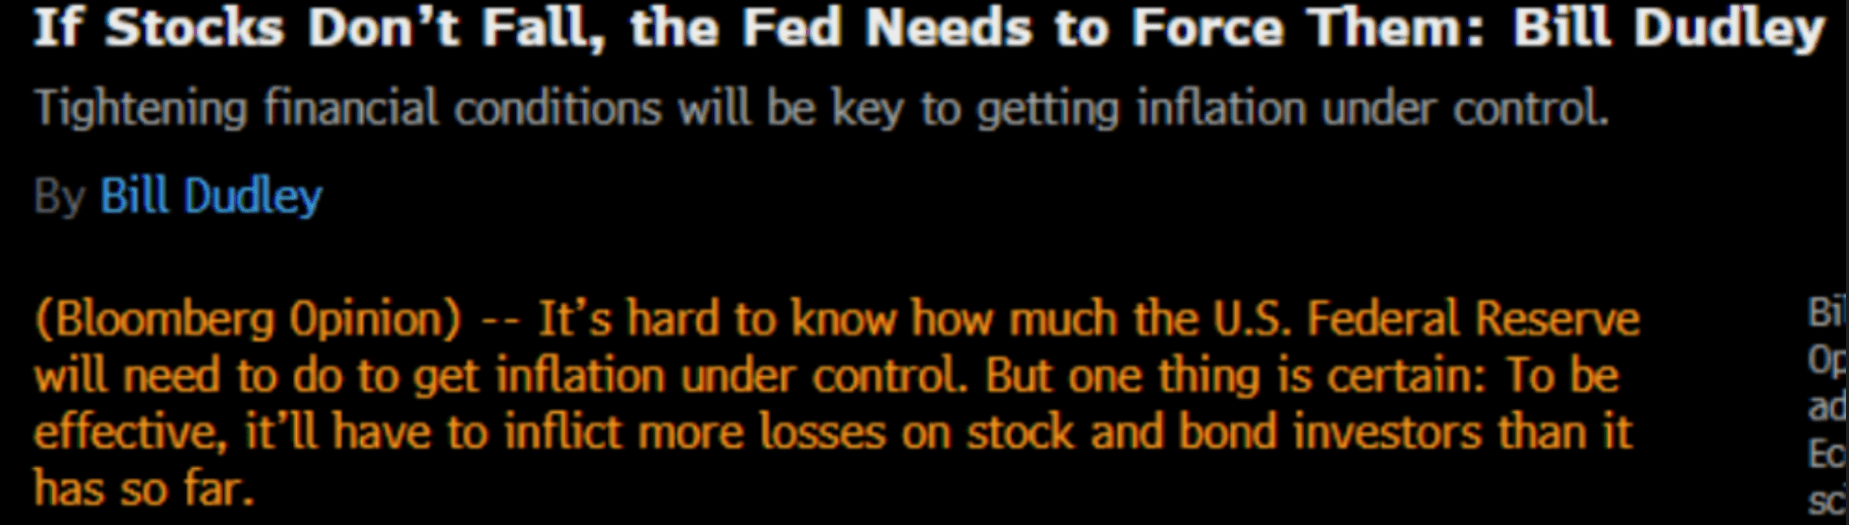
Dudley Says It Will Get Ugly (Bloomberg)
What’s going on here? This is a case of trying to fix the asset bubble that is powering consumption and decreasing labor supply via early retirements. Consumption has been high as people “feel” rich. See how far above the trend line those retail sales are? Those need to come back down…or hover there until the trend line catches up.
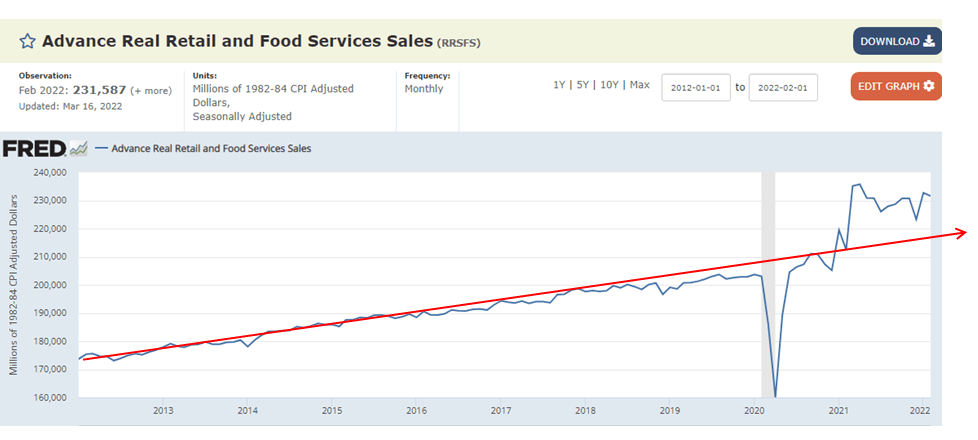
Real Retail Sales (FRED)
A more negative number means things are less stressful for the credit markets.
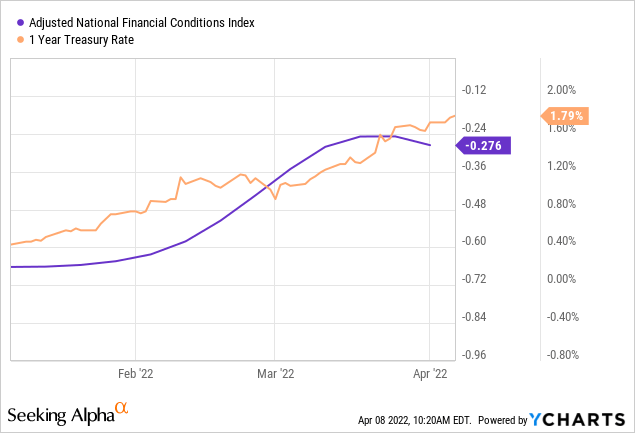
That means that the collective public is not listening to what the Fed is saying and you are going to have a larger kitchen sink coming your way.
Listen To Your Chart
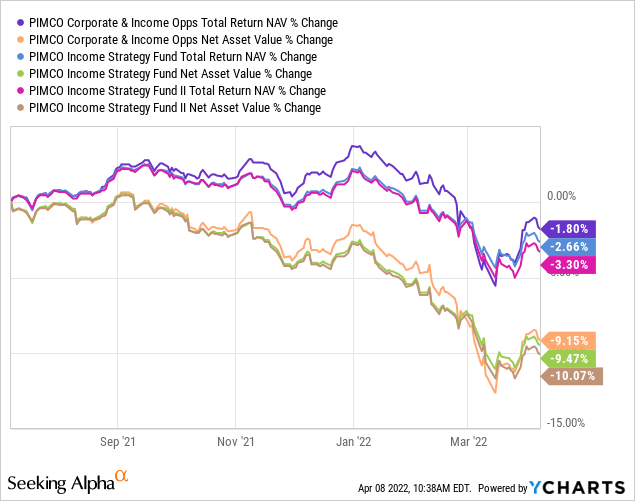
In all the debate about premiums and the right price to pay, investors have ignored the most important fact. The fact that the fund is not making any money. Since our July piece, the NAV has fallen an average of 9.5% for these three funds. Total return which includes all your “I just want my dividends”, is also negative.
The Federal Reserve sees this current change in the credit markets and they are telling you that is not enough, not even close. Why? Well besides the retail sales shown above, Atlanta Fed Wage Tracker hit 6%, up from 5.8% last month.
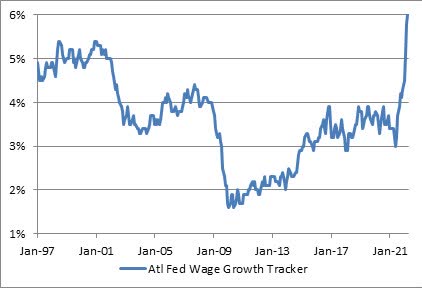
Atlanta Fed Wage Growth Tracker (Atlanta Fed)
At least their chart is running out of room, so maybe it will stop there.
Jokes aside, if you did not make any money when the bulk of the last 10 months was spent with quantitative easing, what do you think will happen in the next 10?
Of the three, PTY looks to be the most dangerous. It holds the most leverage out of three and also trades at the biggest NAV premium. You can see below the bulk of the rally (which we suggested was coming) from the mid-March lows have been expanding premiums in this fund.
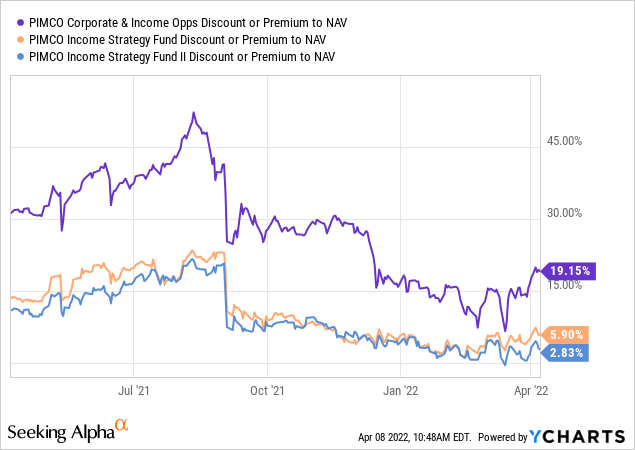
Visualize a 10% NAV drop with this fund trading at a slight discount and you will get the point we might put a buy on it. We are putting this back at a sell rating today.
PFL is in the middle of the road here with effective leverage at 34.50% vs 40.96% for PTY.
PFL premium (CEF Connect)
The premium is in the middle as well at 5.9%. The drop here should be less. We maintain this at a hold/neutral.
PFN is definitely the one with the best characteristics today. At 30% leverage and just a 3% premium, this likely is one where we will issue a buy alert for our subscribers when reality sinks in on this asset class. We maintain this as well at a hold/neutral.
Please note that this is not financial advice. It may seem like it, sound like it, but surprisingly, it is not. Investors are expected to do their own due diligence and consult with a professional who knows their objectives and constraints.
Be the first to comment