

AndreaAstes/iStock Editorial via Getty Images
What Does Consensus Expect?
Macy’s (NYSE:M) plans to announce its Q3 results on the 17th of November. In Q2, Macy’s saw revenue decline by -1.6% YoY (Q1:14%), and this is only expected to worsen in Q3 to levels of -4%. Consensus currently has a revenue figure of $5.204bn, which is slightly above the mid-point of management’s guidance of $5.16-$5.23bn. On the EPS front, consensus is currently factoring in an EPS figure of $0.188, which would also put it closer to the upper end of management’s guided range of $0.15-$0.21.
What I also found quite interesting is that the sell-side community is largely lukewarm on Macy’s stock. Half of the 18 analysts who cover the stock have a HOLD rating, and crucially, the average price target of all these analysts only works out to $22.49; compared to the current price levels, that isn’t a great deal of potential upside to get excited about (just 7%). Needless to say, if Macy’s wants to see upward revisions, it would need to come out with some strong numbers, well above the upper end of management’s guidance.
Q3 Earnings – Key Discussion Points
A lot of attention will no doubt be focused on how effectively Macy’s managed their inventory in this quarter. It’s been well-publicized, that the retail industry is plagued by excess inventory which will likely be marked down at severe rates, thus impacting potential GMs. These inventory re-adjustments are likely to linger until the end of the year.
In H1, Macy’s gross margins were down by 50bps, and I believe it would be perfectly reasonable to not expect any improvements on this front, as aggressive mark-downs and promotions, particularly in pandemic-related categories, private-brand categories, and seasonal good categories would likely have left their mark.
Quite unlike Q2, what’s tricky about Q3 is that Macy’s will also have to replenish inventory in some popular avenues ahead of the holiday season; which means on a net basis, inventory builds are still expected to be a drain on cash flow. In Q2, investments in merchant inventory drained operating cash flow by -$227m and according to management, a similar cadence could be expected in Q3.
As of H1, Macy’s operating cash flow had collapsed by more than 3x (to $303m) on an annual basis, and it’s also worth noting that, the ability of its assets to generate ample FCF has halved since the start of the year. I’m not ruling out the probability of some improvement on the OCF front (despite likely elevated inventory builds) as the cash position was also adversely impacted by some timing issues related to bonuses and other payments, which could reverse in Q3.
YCharts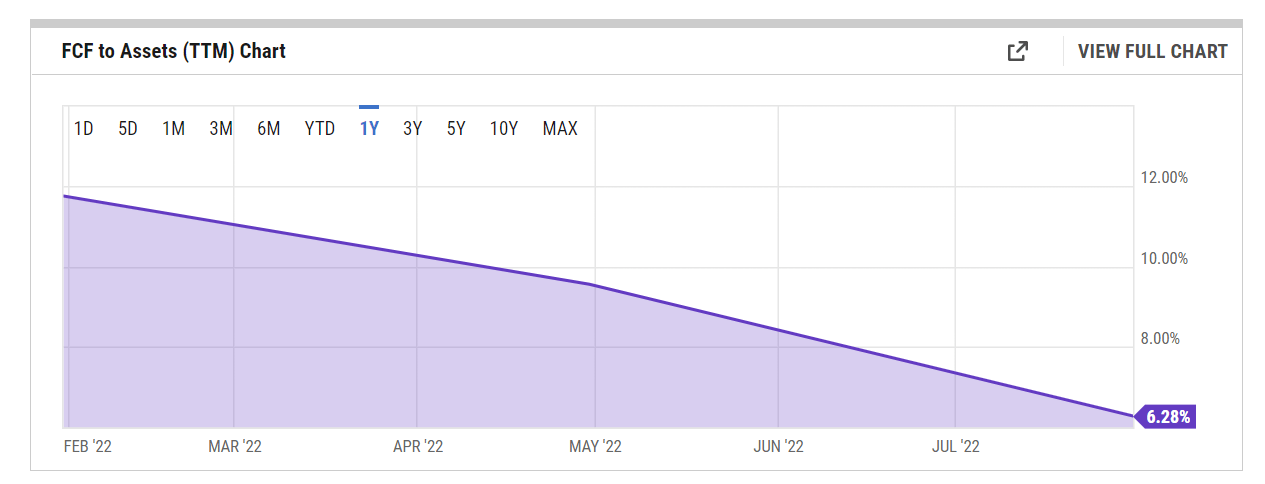
As we enter a recessionary environment, some investors may be hesitant to pay too high a premium for a stock whose FCF dynamics have been sliding, so, if Macy’s could arrest this fall, it would be a welcome development.
Retail stocks including Macy’s have been seeing some interest of late as investors looking to exploit a favorable holiday season which is expected to be better than the 10-year average of mid-single-digit growth. The NRF (National Retail Federation) points to potential factors such as savings level and credit support, but I’m not so sure one can be too buoyant. It’s worth considering that the savings rate in the US is now well below the pre-pandemic norm at just around 3%. Meanwhile, banks in the US have also begun to tighten standards for all consumer loans, including credit cards. Their willingness to dabble with these loans too has taken a beating of late.
US Federal Reserve Survey-Oct 2022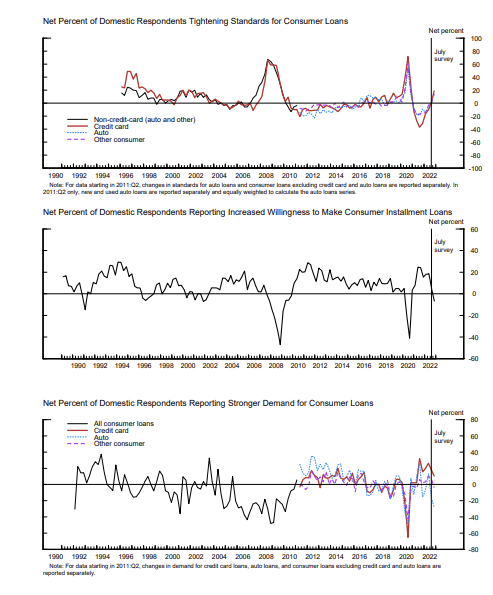
In this environment, Macy’s could be better placed than some of its other peers if customers then choose to trade down towards off-price avenues such as Backstage (the company currently has over 300 Backstage stores across the country). With a US consumer that is not in the best of health, investors should also expect Macy’s credit card revenue share (it was 3.6% in Q2) to decline.
Macy’s management will also likely talk up the potential of the Toys “R” Us partnership, given how effective it could be in the holiday season to generate cross-selling momentum in other kids’ categories. In the store, Macy’s has appropriately positioned the Kids categories near Toys “R” Us, and they last said this could potentially generate $1bn of sales by the end of this year.
I would also expect management to provide additional color on how effectively they have been revamping their private brand portfolio; this could play an important role in the company’s desire to ensure greater customer retention in FY23 and beyond.
Closing Thoughts
Whilst the fundamental and macro environment isn’t entirely resplendent, the valuation and technical backdrop still look promising.
On the valuation front, since the last time I covered this stock, M’s forward EV/EBITDA (FY24) multiple has become pricier by around 9% (4.66x); This is a consequence of the EV expanding by ~6%, even as sell-side EBITDA estimates for FY24 have been curtailed by ~3%. Having said that, we’ve also seen relatively similar dynamics play out with the other close departmental peers of Macy’s. So much so, the valuation differential between M and its peers – of roughly 20% – still continues to be maintained from August.
Seeking Alpha, YCharts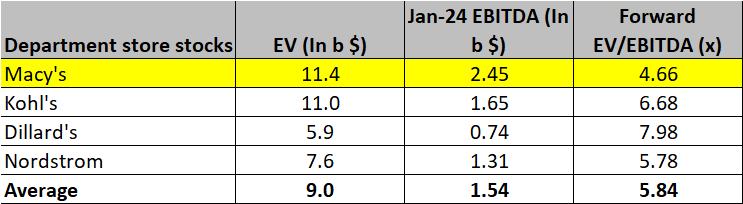
I’ve also previously noted that Macy’s is well-positioned to be a good rotational candidate for those looking for mean-reversion opportunities in the retail space. The relative strength ratio hasn’t moved a great deal from levels last seen in August.
StockCharts Investing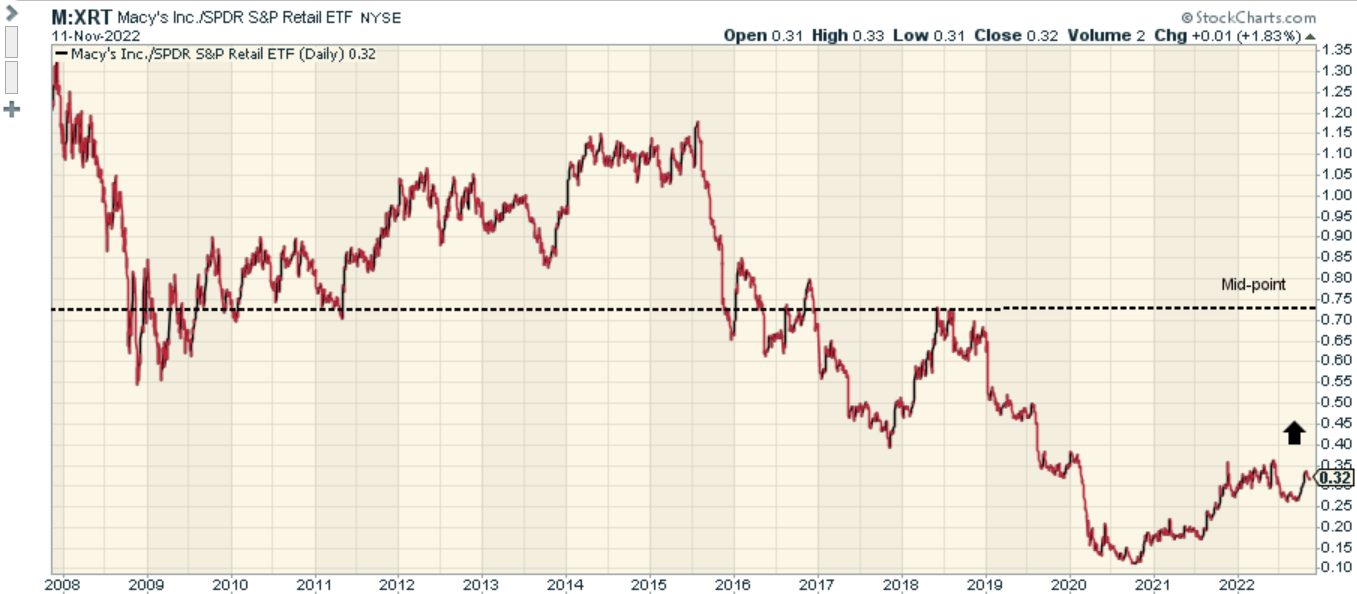
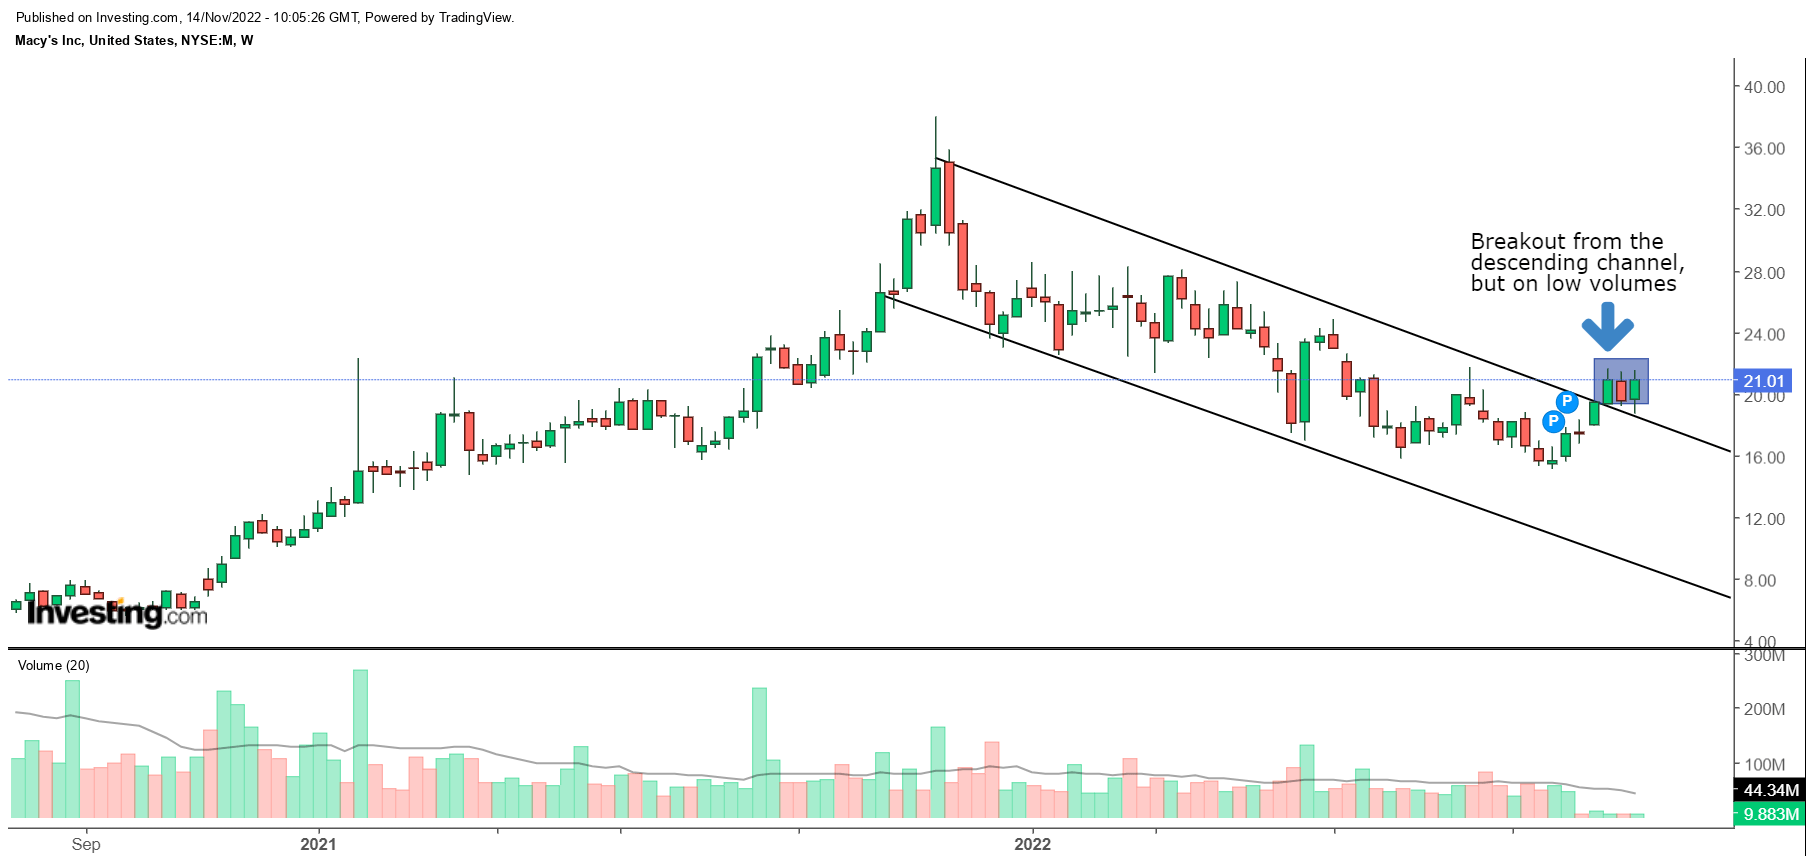
On Macy’s weekly chart, it was encouraging to note that the stock recently put an end to the descending channel pattern that was in play since November 2021. However, the breakout wasn’t wholly convincing as the volumes backing that move were relatively low.
However, what’s interesting to note, is that short-selling momentum appears to have faded substantially. Back in mid-June, the percentage of float that was short was at an elevated level of 17%; according to Seeking Alpha data, it is now at only around 7%!
Investing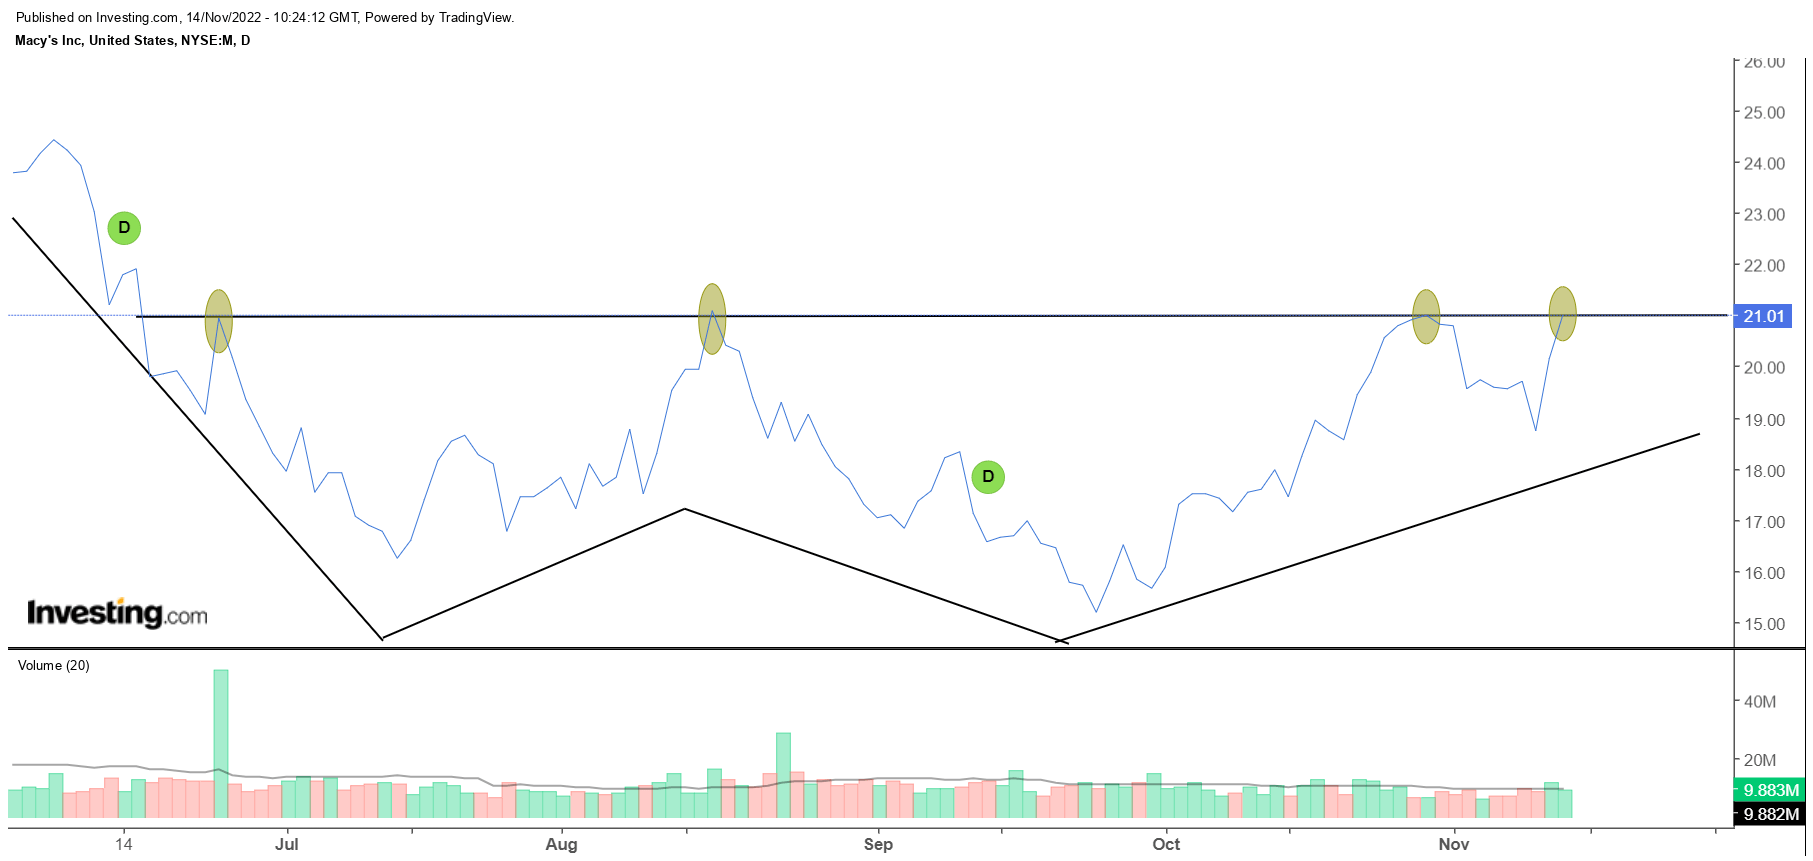
Shifting focus to the smaller time frame daily chart, it appears as though the stock is currently in the midst of a W-shaped reversal pattern, and just ahead of the Q3 results, it appears finely perched around a price zone that it had failed to cross on three separate occasions. Could it break free from here? Well, needless to say, the Q3 results on the 17th could be the perfect catalyst one way or the other.
Be the first to comment