

Juan Jose Napuri/iStock via Getty Images
After years of wondering what would come of Fruta Del Norte, arguably the most exciting gold discovery of the past 15 years, the mine is now in commercial production and is performing exceptionally well under Lundin Gold (OTCQX:LUGDF). For those unfamiliar with the story’s history, Fruta Del Norte was discovered by Aurelian in 2006, with a trading halt after the company hit 237 meters at 4.4 grams per tonne of gold in its third drill hole on the Ecuadorian Project that lay just near the Peruvian border. This was followed up by multiple higher-grade hits that included:
- 189 meters at 24 grams per tonne gold
- 204 meters at 8.40 grams per tonne gold
- 255 meters at 12.55 grams per tonne gold
- 192 meters at 7.43 grams per tonne gold
- 216 meters at 10.12 grams per tonne gold
- 250 meters at 35.2 grams per tonne gold
- 158 meters at 25.21 grams per tonne gold
- 141 meters at 16.91 grams per tonne gold
- 217 meters at 12.85 grams per tonne gold
These intercepts would make most geologists drool even if they came in at 1.5 – 2.0 grams per tonne of gold, and 0.80 gram per tonne grades would excite any company if they were oxide hits. However, Aurelian consistently hit 5.0+ gram per tonne grades, with the odd 15-20 gram per tonne intercept. The results were almost too good to be true, with some investors likely wondering if this was a Busang 2.0. Fortunately, for Aurelian investors and the industry’s reputation, it wasn’t, and Aurelian reported a resource of 58 million tonnes grading 7.0 grams per tonne of gold and 12 grams per tonne of silver.
Fruta Del Norte Project (Company Presentation)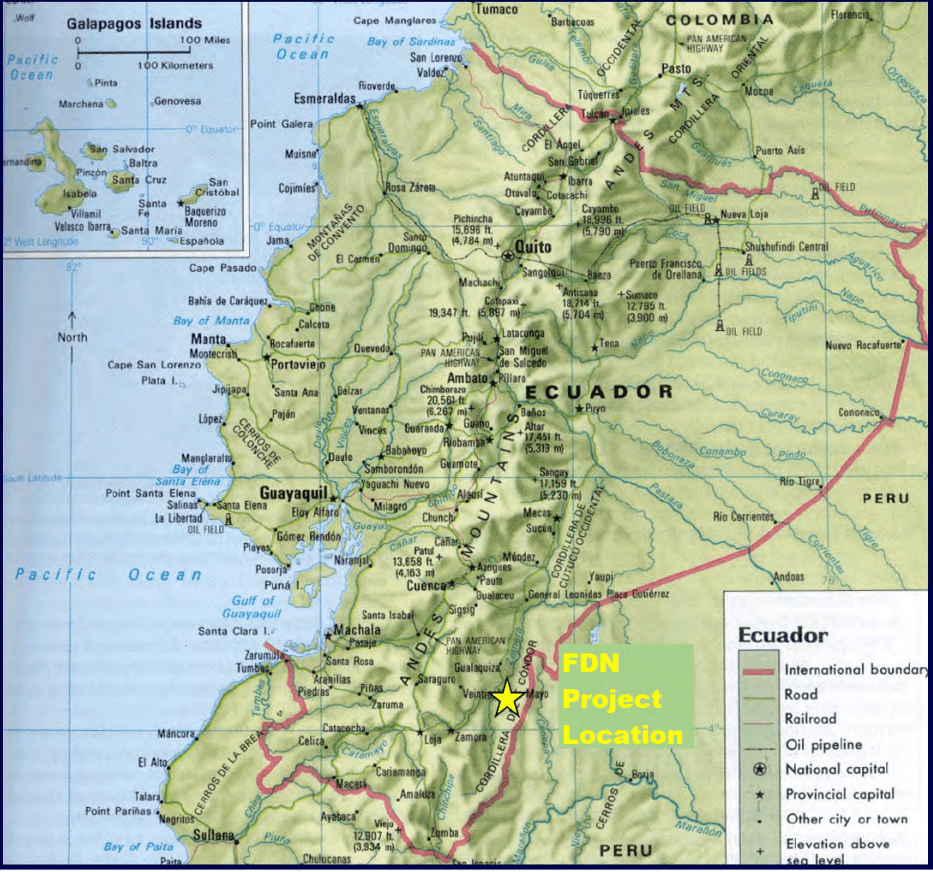
Not surprisingly, Aurelian’s share price went up over 4000% in barely a year following its discovery hole, but following an acquisition by Kinross (KGC) and subsequent sale, the project laid dormant, with no mining completed more than a decade after its incredible discovery. Kinross’ choice to abandon the project related to exorbitant taxes expected from the previous Ecuadorian government, with Kinross taking a bath on the deal, spending ~$1.0 billion to acquire and move the project to Feasibility, before letting go of the asset for $240 million.
Fortunately, the Lundin Family was much more successful in Ecuador than Kinross, bringing the project into commercial production on time and on budget with the help of G Mining Services as of early 2020. Since then, the mine has maintained industry-leading costs. In fact, despite challenges related to its south ventilation raise, a national strike, and a period of inflationary pressures, Lundin Gold has excelled relative to its peer group. This was evidenced by the company being one of the only producers to raise annual output guidance and lower cost guidance. Let’s take a closer look at the recent results below:
Fruta Del Norte Operations (Company Presentation)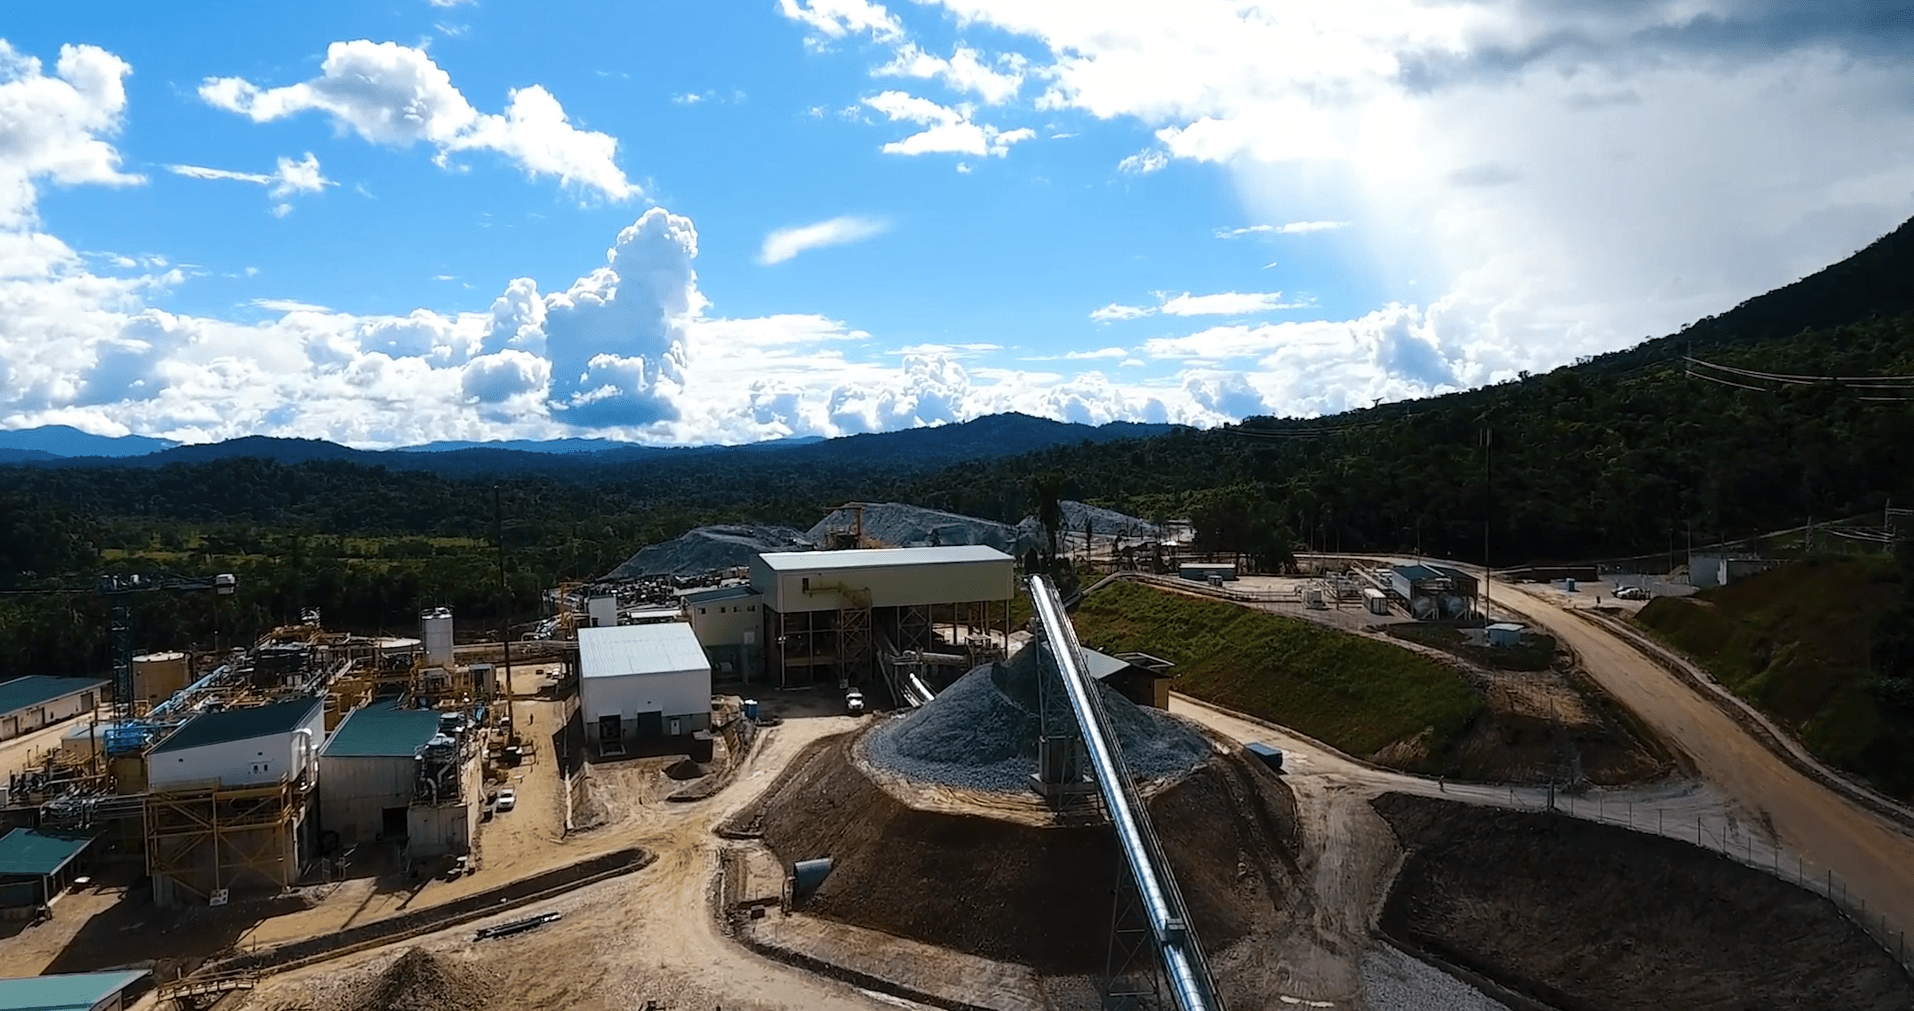
Quarterly Production & Sales
Lundin Gold released its Q2 results last month, reporting production of ~111,900 ounces, a 3% increase from the year-ago period. This was helped by higher throughput in the period, with the operation processing ~385,700 tonnes, offsetting the slightly lower head grade in the period (10.3 grams per tonne gold vs. 11.1 grams per tonne gold). These results pushed H1 2022 production to ~233,600 ounces, tracking well ahead of the planned ~425,000 ounces in FY2022 based on the previous guidance mid-point. Given the strong results, Lundin raised its FY2022 guidance to 445,000 ounces at the mid-point, set to break last year’s record of ~428,500 ounces.
Lundin Gold – Quarterly Gold Production & Costs (Company Filings, Author’s Chart)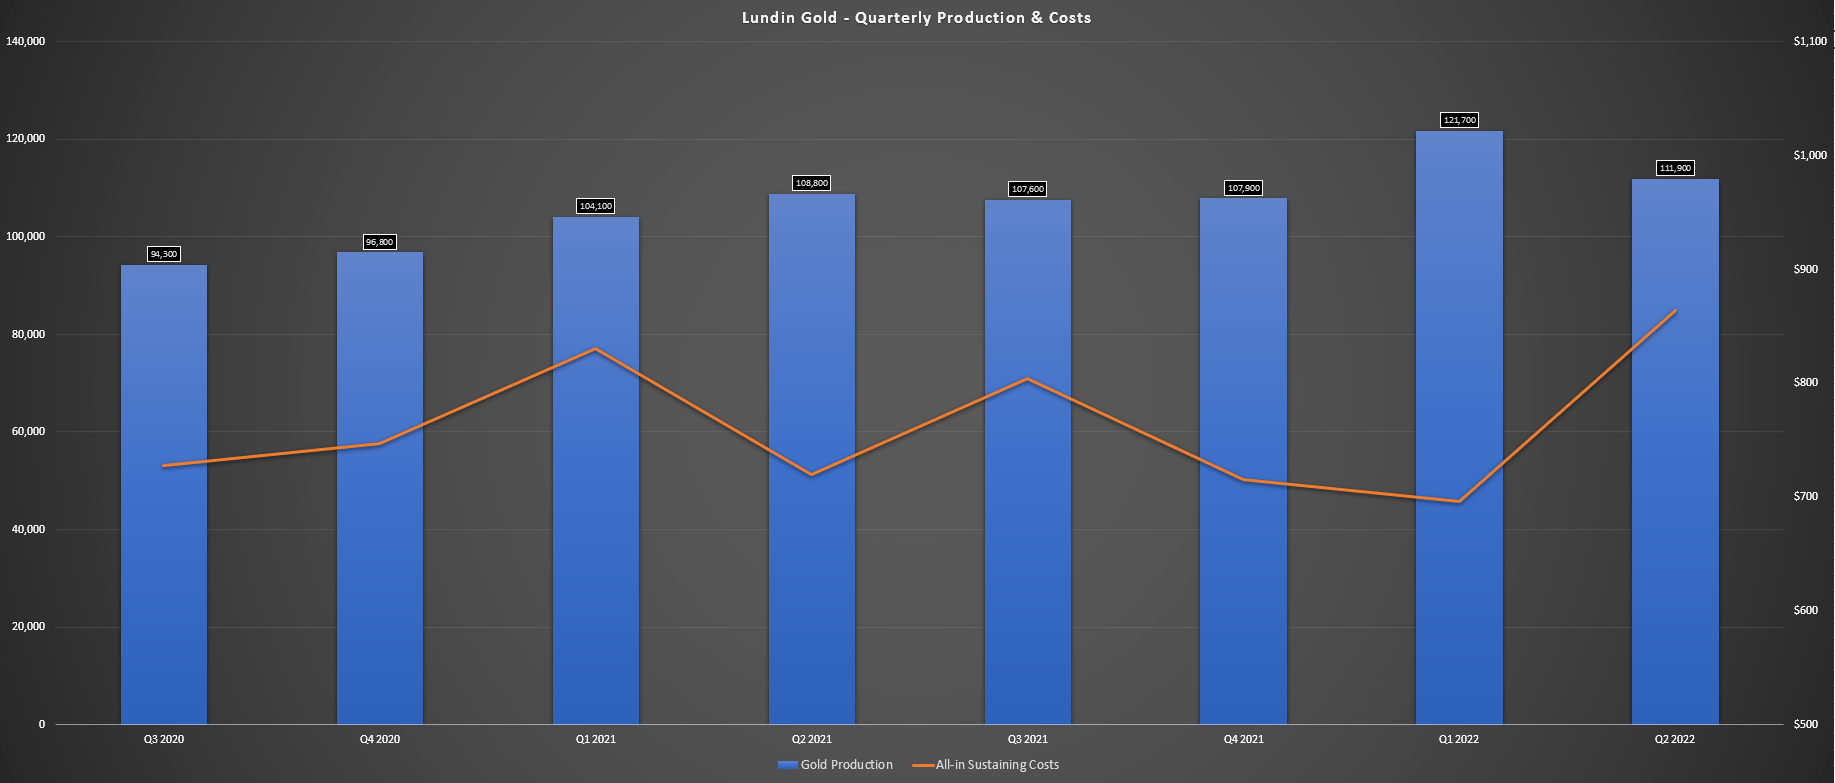
Looking at the key operating metrics below, we can see that tonnes mined have steadily improved since the start of operations in 2020, but mine production was throttled back slightly to allow the mill to process more tonnes and reduce run of mine stockpiles. Notably, the mill has also performed very well, just above the design capacity of 4,200 tonnes per day in Q2, with quarterly production regularly above the 378,000-tonne mark for two of the past three quarters, and grades continue to reconcile well with reserves.
Lundin Gold – Fruta Del Norte Operating Metrics (Company Filings, Author’s Chart)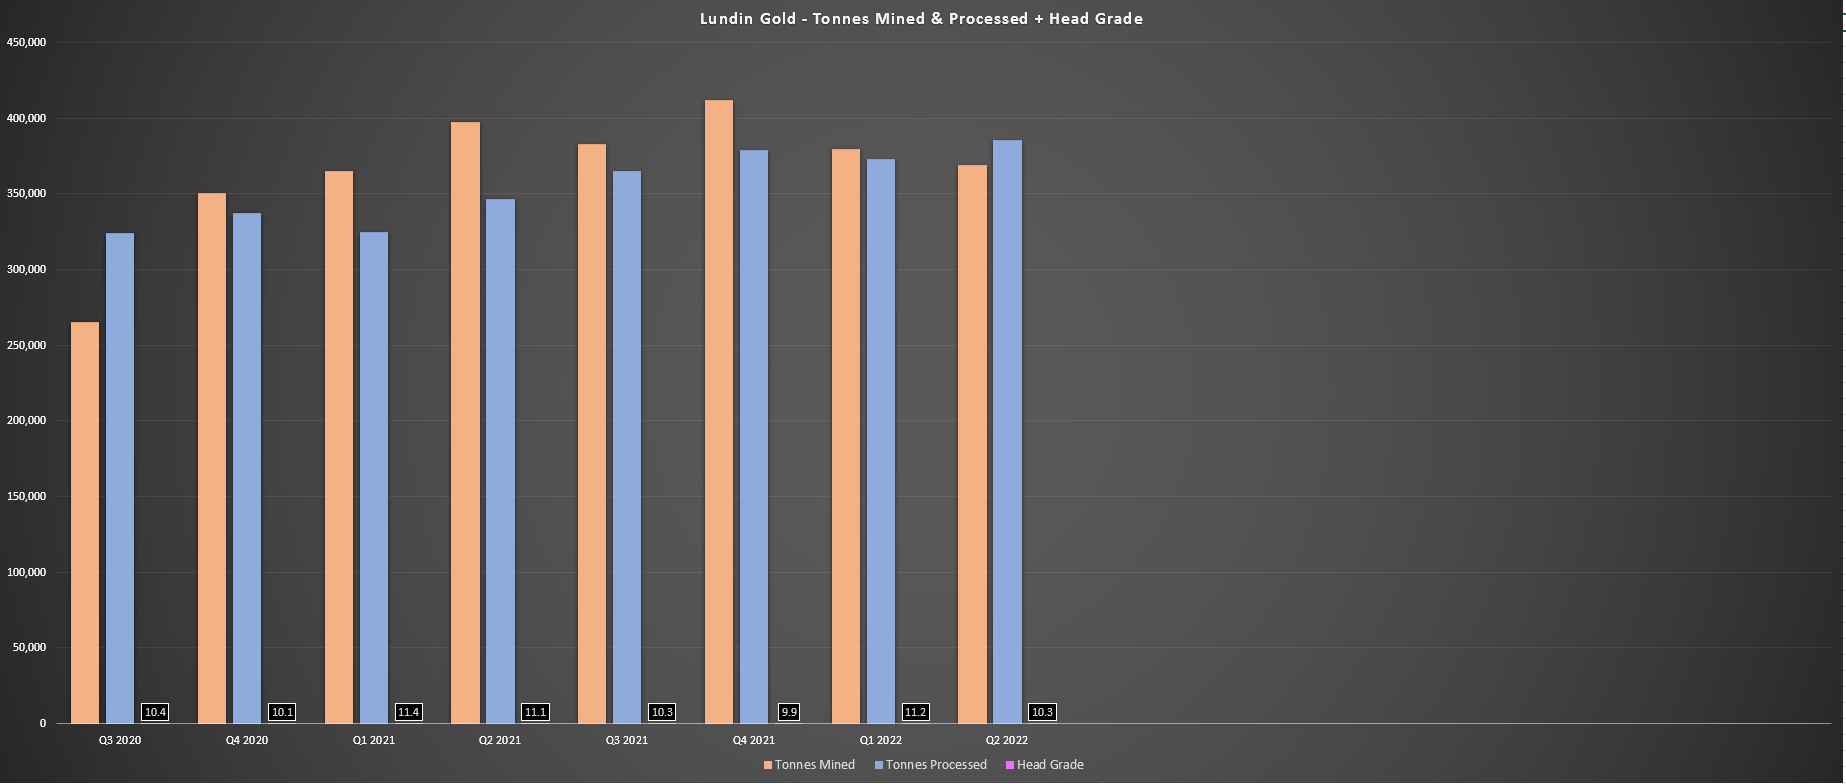
However, while production was up year-over-year and the company benefited from one of the best average realized gold prices sector-wide ($1,907/oz) in Q2, revenue came in lighter than anticipated at $117.8 million. This translated to a 16% decline year-over-year but was out of Lundin’s control, with the company noting that the national strike in Ecuador (which ended June 30th) impacted the timing of gold sales. The result was that it sold approximately ~16,000 fewer ounces than planned, which would have translated to over $29 million and also impacted its unit costs.
While this did hurt the Q2 results, and free cash flow dipped sharply ($21.2 million vs. $103 million) due to lower sales volumes and the impact of profit-sharing payments and 2021 taxes paid during the period, the company still exited the quarter with over $300 million in cash. Notably, work on the South Ventilation Raise continues to progress, and it’s now expected to be completed by year-end. Fortunately, the delays clearly didn’t impact guidance due to conservatism, but it will be important to finish this before year-end, or there could be some impact on FY2023 production levels.
Costs & Margins
While the production results were phenomenal, with the company operating at a nearly 500,000-ounce annualized run rate in H1, the cost performance was just as impressive. During Q2, all-in-sustaining costs came in at industry-leading levels of $864/oz, well below the industry average costs of ~$1,300/oz. While this figure was up sharply year-over-year from $720/oz in Q2 2021, it’s important to note that this was largely due to lower by-product credits and the impact of much fewer ounces sold, as well as difficult comps (~125,400 ounces sold in the previous period). However, assuming all ounces were sold with no deferred sales due to the strike, all-in sustaining costs would have come in at $744/oz, only up slightly year-over-year.
Lundin Gold – Average Realized Gold Price, All-in Sustaining Costs & AISC Margins (Company Filings, Author’s Chart)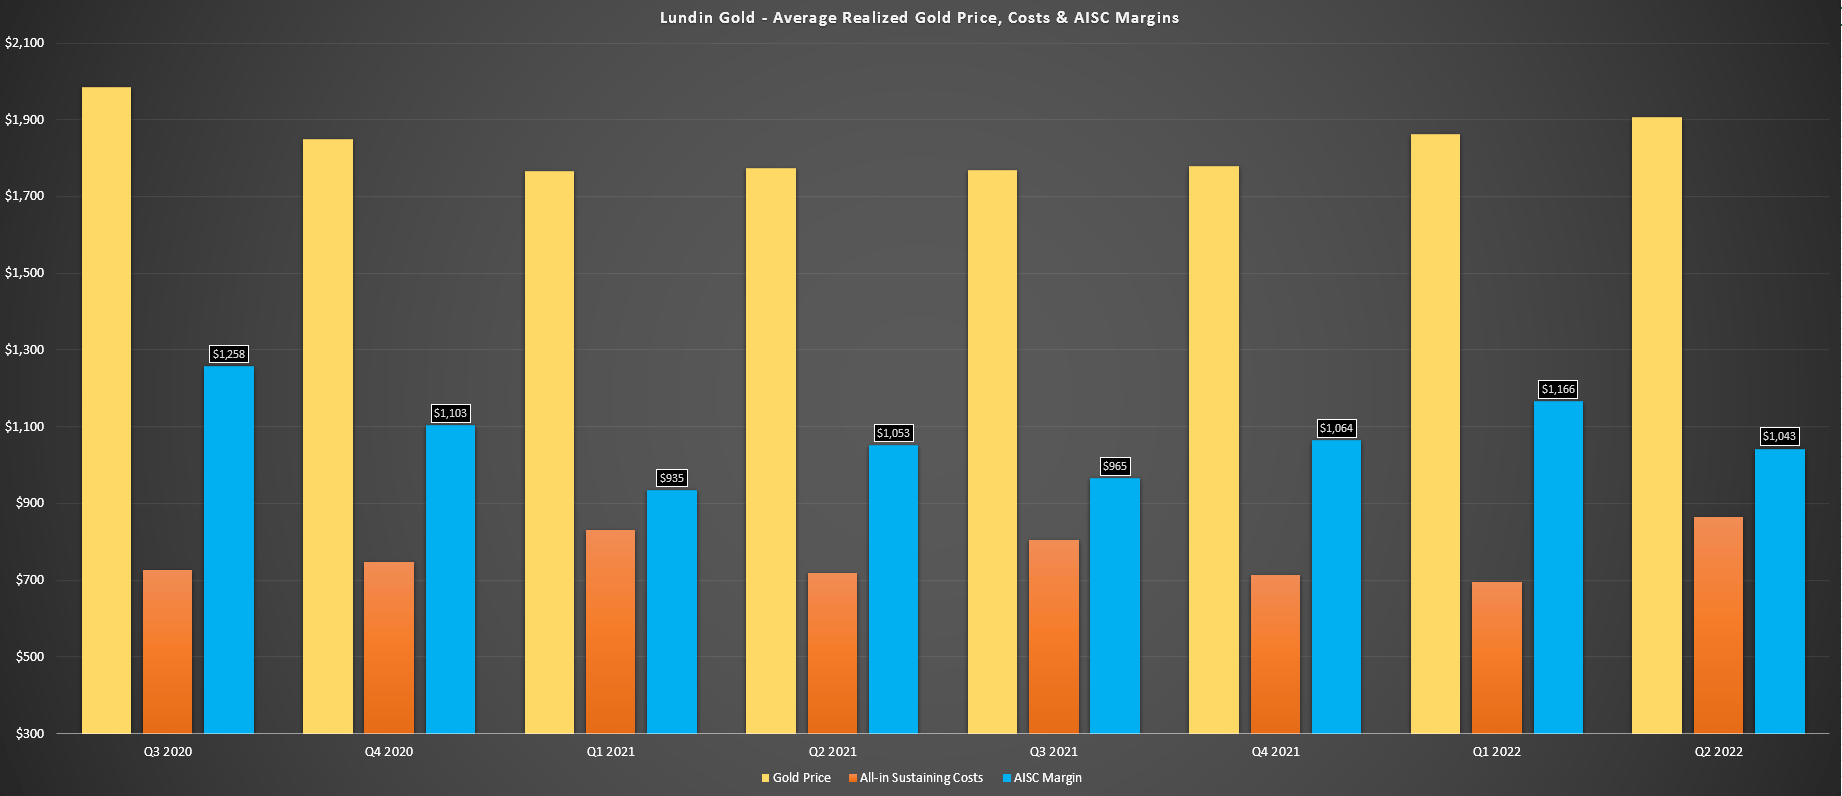
Despite this minor headwind that impacted costs, Lundin Gold is confident in its back half performance, and cost performance was better than expected. This resulted in the company revising cost guidance to $845/oz at the mid-point, a significant improvement from the previous mid-point of $895/oz. From a margin standpoint, Lundin’s all-in-sustaining cost margins came in at $1,043/oz in Q2 2022, nearly double that of the industry average. Obviously, with the impact of a lower gold price, we could see some pressure on margins in Q4 2022, and the benefit of increased sales in Q3 could be mostly offset. That said, Lundin’s margins remain in excellent shape, with ~50% margins even at a $1,700/oz average gold price.
Recent Developments
While early days to speculate, the most recent development is Lundin’s planned exploration of regional targets, with the company budgeting $14 million for drilling at Barbasco Norte, Puma, and Quebrada La Negra. This drilling is being done in addition to drilling at other high-priority targets in the Suarez Basin, which include Barbasco and Puente Princesa. To date, the company hasn’t been successful with any major intercepts reminiscent of early Aurelian-type drilling, but the best place to make a major discovery is in the vicinity of a major discovery, so I am cautiously optimistic.
Fruta Del Norte Regional Opportunity (Company Presentation)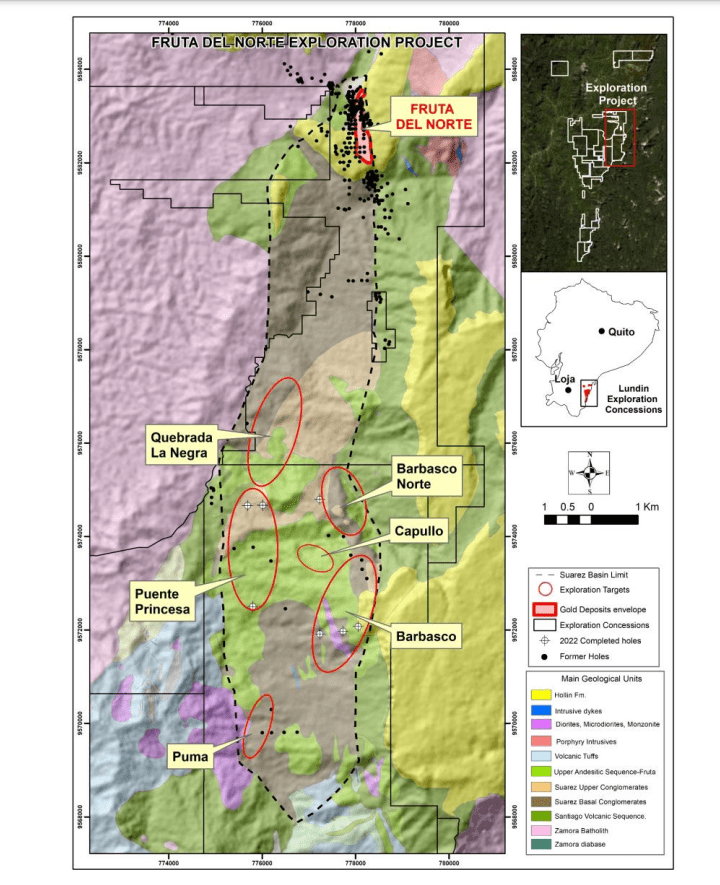
Fruta Del Norte’s exploration potential on this untested land package cannot be overstated, with multiple targets south of its ultra high-grade ~10.0 million-ounce project. However, the company is also working on near-mine exploration, with $4 million budgeted to potentially expand the mineral envelope. This increase in drilling that’s easily funded by the company’s growing cash position (~$300 million at the end of Q2) adds a nice bonus to the investment thesis and is certainly worth monitoring closely, given that any major discoveries could be a big deal, similar to the attention that Pretium (PVG) got when it uncovered Golden Marmot earlier this year.
Valuation
Based on ~235 million fully-diluted shares and a share price of US$7.30, Lundin trades at a market cap of ~$1.72 billion, making it one of the highest valued single-asset producers globally. Given that the company has brought arguably the most exciting gold discovery of the past 15 years into production and reported near-flawless operating metrics to date, a premium valuation makes sense. However, given the decline we’ve seen in the sector, Lundin has now found itself trading at a relatively large premium to its peer group and even those with multiple assets in Tier-1 jurisdictions.
If we compare Lundin’s market cap to an estimated net asset value of ~$2.24 billion, which includes $350 million assigned to exploration upside, Lundin is trading at 0.78x P/NAV. This represents a premium compared to names like Alamos Gold (AGI) at 0.71x and is only slightly behind Yamana Gold (AUY) at 0.79x, a diversified multi-million-ounce producer with several operations, two phenomenal development projects in its pipeline (Wasamac, MARA interest) and 50% ownership of a top-2 mine in Canada: Canadian Malartic.
Lundin Gold Operations (Company Presentation)
Obviously, Lundin Gold is the lower cost of these companies currently by a wide margin, which is a key differentiator. Still, Alamos Gold should catch up over the next few years as Island Phase 3 pulls costs below $600/oz at its flagship operation, so its costs aren’t that dissimilar. This premium valuation relative to peers doesn’t mean that Lundin Gold can’t go higher, and based on a P/NAV multiple of 1.10, I see a fair value of US$10.50. Still, from a relative standpoint, I see more attractive bets sector-wide and don’t see nearly as much upside to fair value for Lundin Gold, with many producers boasting 70% plus upside after their violent corrections.
Lundin Gold – Daily Chart (TC2000.com)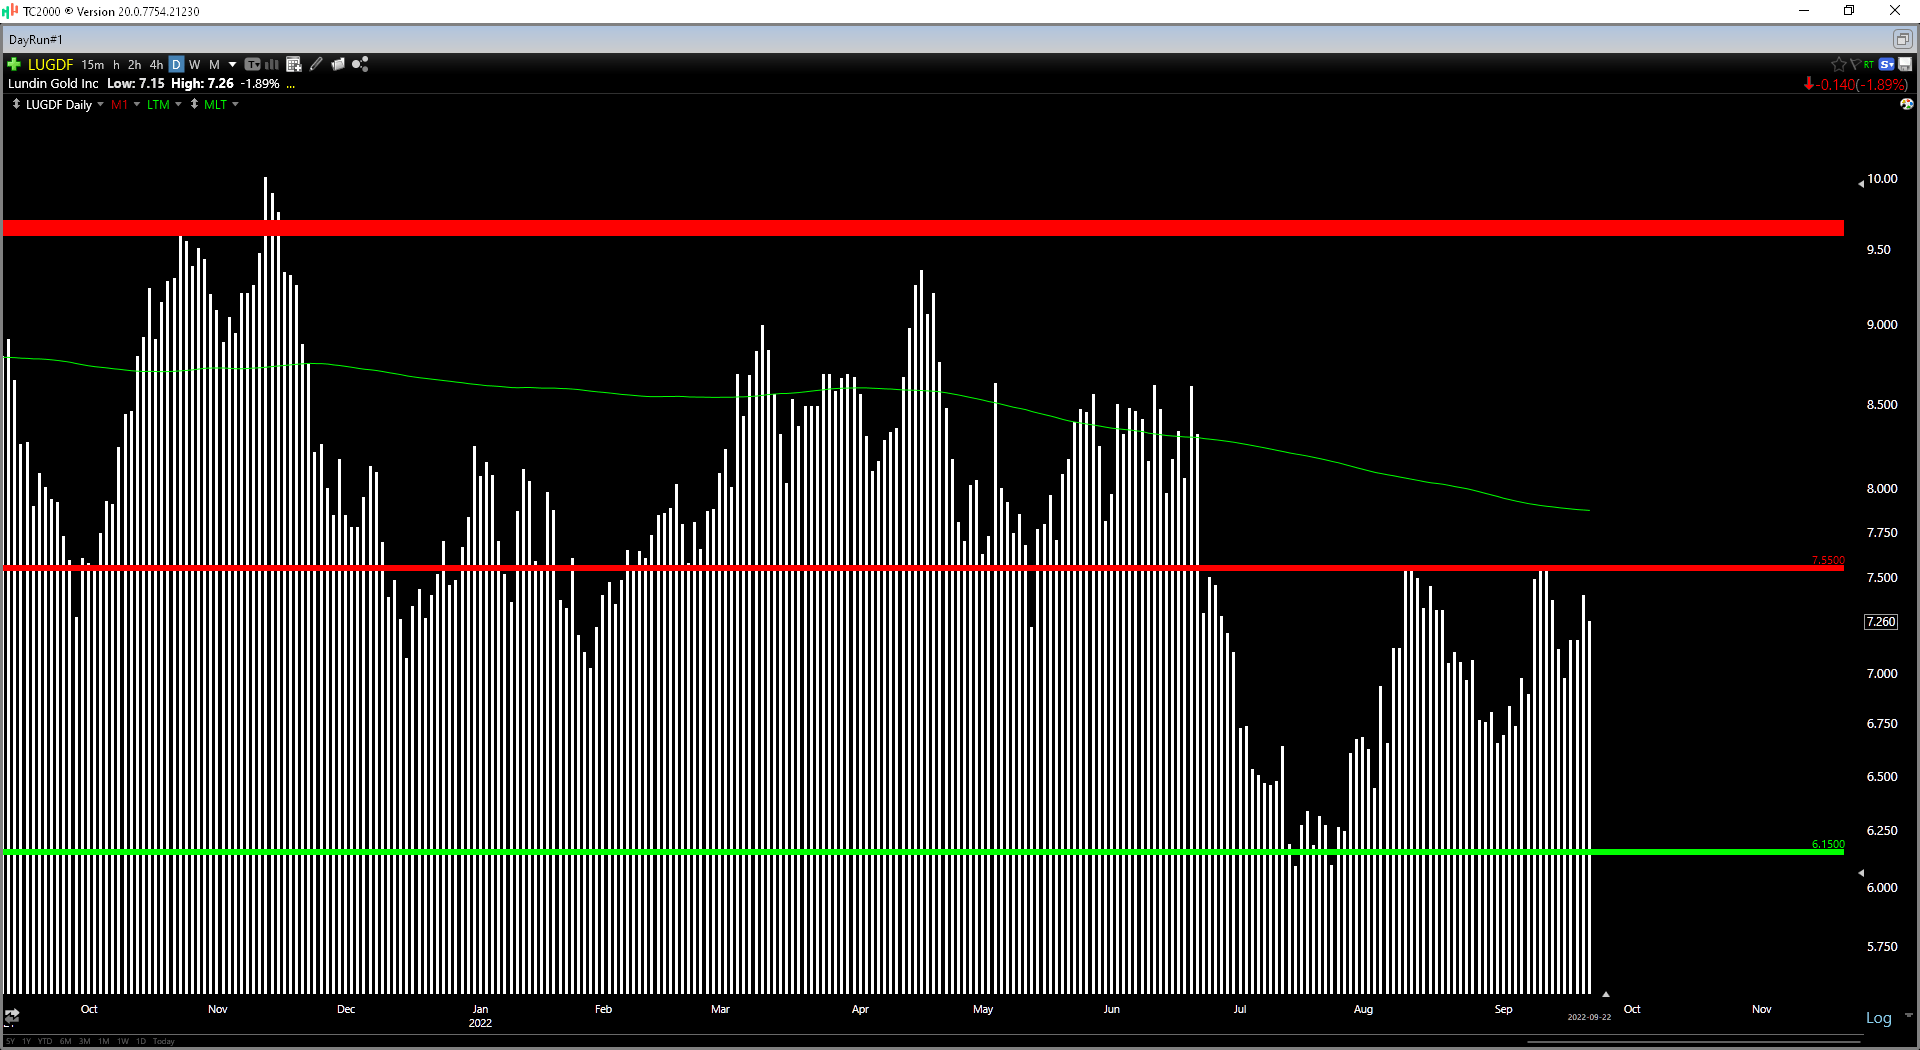
Looking at the technical picture, this outlook also suggests that Lundin Gold is a little riskier than its peers, with the stock trading in the upper portion of its support/resistance range of US$6.15 to US$7.55. Generally, I prefer a minimum of a 5.0 to 1.0 reward/risk ratio to justify entering new positions, and Lundin has $0.30 in potential upside until it hits resistance and $1.15 in potential downside, translating to a reward/risk ratio of 0.26 to 1.0. This doesn’t mean that the stock should be sold. It merely means that if I were looking to put new money to work in the gold sector, I think there are better setups currently.
Summary
Lundin Gold has had an incredible year, is sitting on tons of cash that could allow the company to shed its single-asset producer status later this decade, and it’s enjoying some of the best margins sector-wide. Just as importantly, the company is spending aggressively on regional exploration, and any hint of a mini Fruta elsewhere on the property could lead to a significant re-rating. However, with more diversified producers trading at more attractive valuations with very bright futures, I remain focused elsewhere for now. To summarize, while I see Lundin Gold as a solid buy-the-dip candidate, the ideal buy point looks to be at US$6.25 or lower, within 2% of support.
Be the first to comment