

xefstock/E+ via Getty Images
Introduction
As I write this, Lowe’s (NYSE:LOW) stock is about -23% off its highs, and the valuation appears to be cheap using most fundamental metrics. I know that using my standard metrics, it looks like a very good value. However, I think there is reason to believe that Lowe’s is one of the most dangerous stocks in the S&P 500 right now. In this article, I will explain why I came to that conclusion. But before I do that, I’ll share my standard valuation process for Lowe’s. This way we can see both the positive and the negative potential the stock has in front of it.
I always like to start my articles by reviewing my past coverage of the stock I’m writing about. Since I create my own valuation methods and strategies, often readers are not as familiar with them as they are with other approaches. I’ve found that sharing how my methods have performed in the past can help lend some credibility to those methods. I’ve covered Lowe’s stock twice in the past. The first was a “Sell” article published on July 15th, 2019, titled “Lowe’s: A 10-Year, Full-Cycle Analysis“, and in that article I pointed out that Lowe’s stock was overvalued and that if we had a recession within 3 years, that Lowe’s price would likely drop enough for investors who sold to rotate back into the stock at a much lower price (as low as -50% off its highs).
As fate would have it, less than a year later, that’s exactly what happened. On March 18th, of 2020, my second Lowe’s article “Here’s The Price To Consider Buying Lowe’s” was published, and in that article, I suggested that any former Lowe’s shareholders who read my first article and decided to sell, could at that point rotate their money back into Lowe’s.
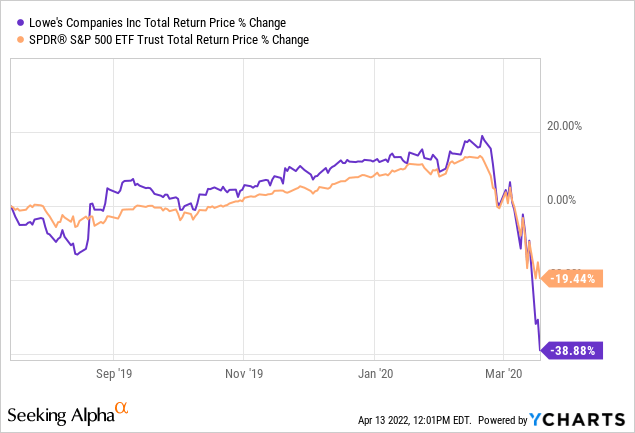
Above are the returns an investor would have gotten from holding onto Lowe’s stock in between my sell article and my “rotate-back-in” article compared to the S&P 500.
Below are the returns since I suggested investors could rotate back into Lowe’s:
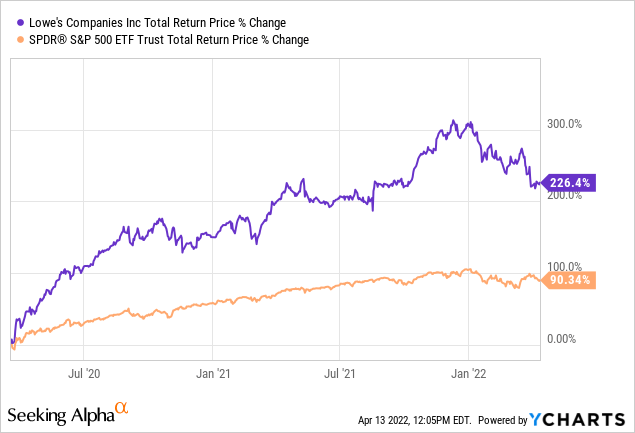
Unfortunately for myself, even though I usually buy stocks when they flash “Buy” using my valuation method, I decided to hold off buying Lowe’s in order to see what sort of other opportunities the March 2020 crash would offer up. The reason I did this was that Lowe’s was pretty slow to recover from the Great Recession, and if I had a choice, I wanted to buy the stocks of businesses I thought would recover faster. And indeed, I bought about 30 different stocks in March of 2020, but I underestimated the effect massive stimulus, both from the Fed and the federal government would have on Lowe’s, and I made a big mistake not buying in March of 2020 as well, even though I think my reasoning was sound given what we knew during the middle of the March crash before policymakers came to the rescue. Nevertheless, I missed out on a very good return over this time period.
Next, let’s analyze Lowe’s so we can see why it looks so attractive to investors right now. I’ll start with my standard “Full-Cycle Analysis”, which is a similar method I used in my previous Lowe’s articles.
How Cyclical Is Lowe’s Business?
As part of the analysis, I calculate what I consider to be the two main drivers of future total returns: Market Sentiment returns and Business returns. I then combine those expected returns together in the form of a 10-year CAGR expectation and use that to value the stock.
Before I begin this analysis, I always check the business’s long-term earnings patterns in order to ensure that the business is a proper fit for this sort of analysis. If the historical earnings 1) don’t have a long enough history 2) are erratic in nature, or 3) are too cyclical, then I either avoid analyzing the stock altogether or I use a different type of analysis that is more appropriate.
FAST Graphs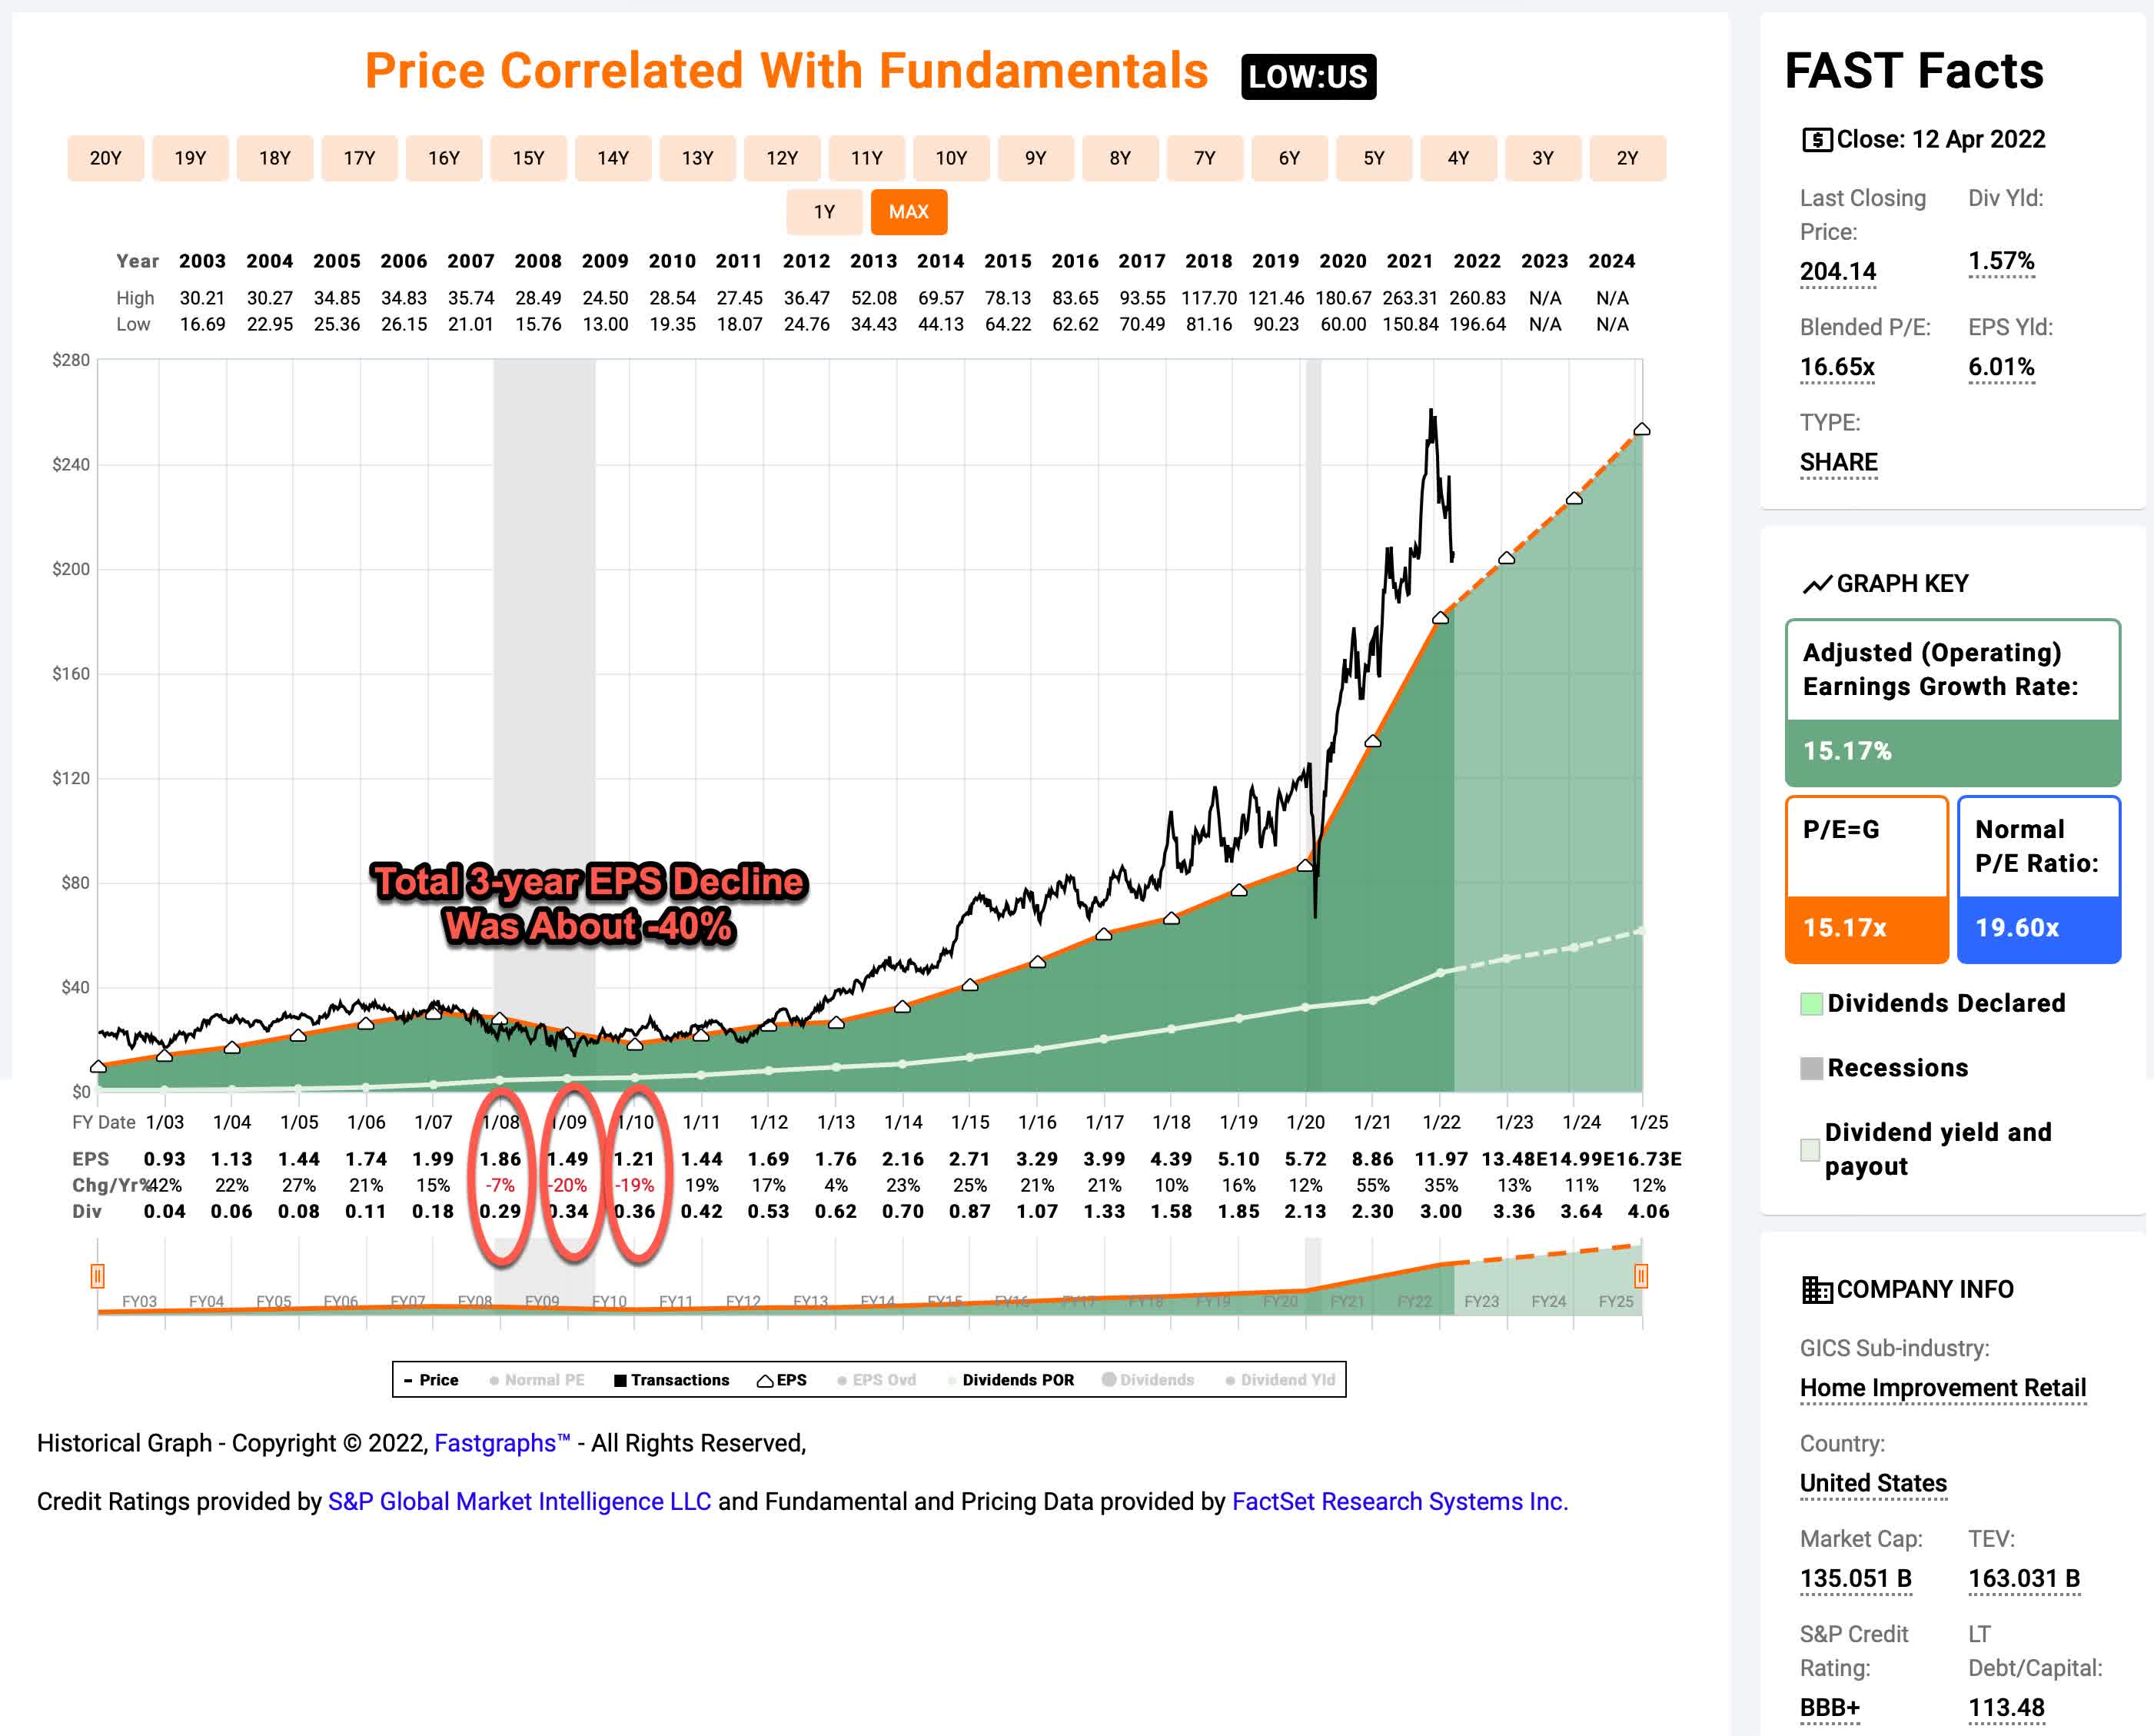
Lowe’s has a full 20-year earnings history on the FAST Graph, so there is plenty of data to work with. Over this time, it has had only three years where EPS declined. They were all during the Great Recession in 2008, 2009, and 2010. The cumulative decline over these three years was roughly -40%. My approximate threshold for categorizing a business’s earnings as “cyclical” is that it tends to experience earnings drawdowns of -50% or more during downcycles. Lowe’s is shallower than that, so I would not categorize this business as “deeply cyclical”. For that reason, it is okay to use earnings and earnings growth, along with other traditional metrics, as a guide for valuing the stock. (Which is what I will do in this article.) However, it’s worth noting that a -40% earnings drawdown is still higher than average and this is what I would describe as a moderate-to-deeply cyclical business. That means it’s wise to be careful when we are late in the economic cycle (as we likely are right now).
Because its earnings history is not too cyclical and earnings have shown solid growth, Lowe’s meets all of the basic requirements for the Full-Cycle Analysis I’m about to share.
Market Sentiment Return Expectations
In order to estimate what sort of returns we might expect over the next 10 years, let’s begin by examining what return we could expect 10 years from now if the P/E multiple were to revert to its mean from the previous economic cycle. Since we have had a recent recession (albeit an unusual one), I’m starting this cycle in fiscal year 2015 and running it through 2023’s estimates.
FAST Graphs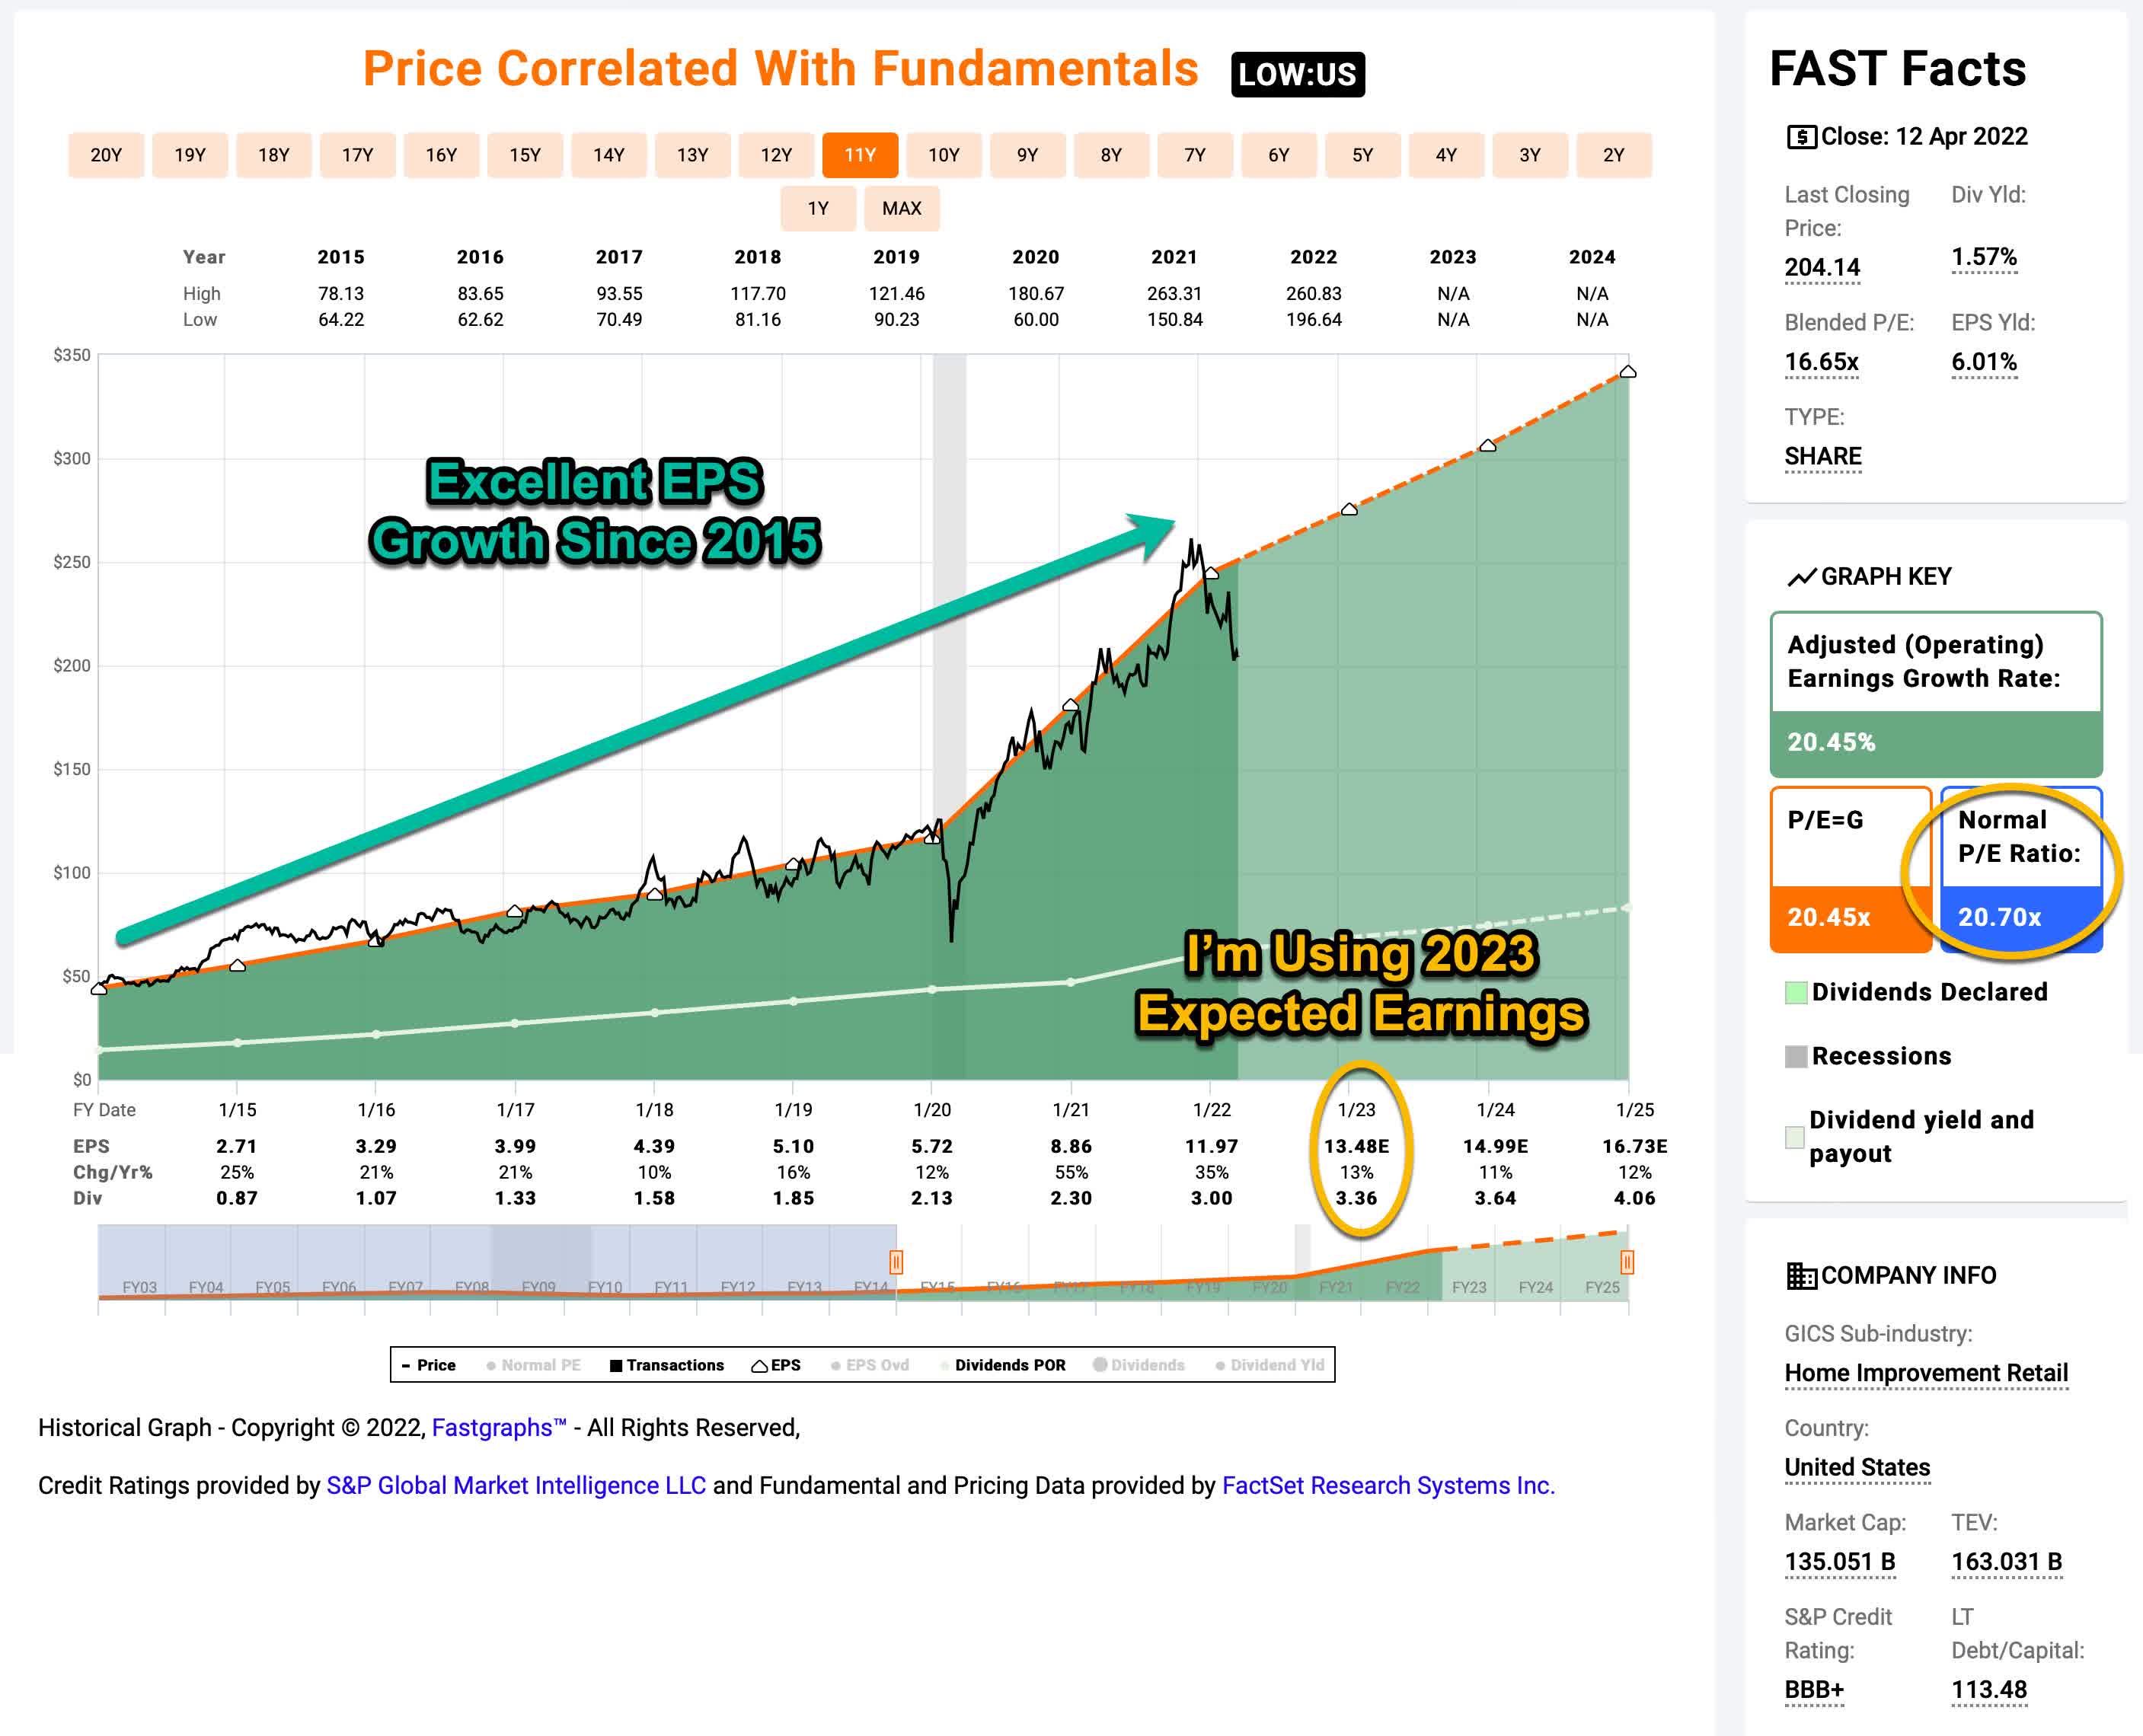
Lowe’s average P/E from 2015 to the present has been about 20.70 (the blue bar circled in gold on the FAST Graph). Using 2023’s forward earnings estimates of $13.48 (also circled in gold), Lowe’s has a current P/E of 14.93. If that 14.93 P/E were to revert to the average P/E of 20.70 over the course of the next 10 years and everything else was held the same, Lowe’s price would rise and it would produce a 10-Year CAGR of +3.32%. That’s the annual return we can expect from sentiment mean reversion if it takes ten years to revert. If it takes less time to revert, the return would be higher.
Business Earnings Expectations
We previously examined what would happen if market sentiment reverted to the mean. This is entirely determined by the mood of the market and is quite often disconnected, or only loosely connected, to the performance of the actual business. In this section, we will examine the actual earnings of the business. The goal here is simple: We want to know how much money we would earn (expressed in the form of a CAGR %) over the course of 10 years if we bought the business at today’s prices and kept all of the earnings for ourselves.
There are two main components of this: the first is the earnings yield and the second is the rate at which the earnings can be expected to grow. Let’s start with the earnings yield (which is an inverted P/E ratio, so, the Earnings/Price ratio). The current earnings yield is about +6.70%. The way I like to think about this is, if I bought the company’s whole business right now for $100, I would earn $6.70 per year on my investment if earnings remained the same for the next 10 years.
The next step is to estimate the company’s earnings growth during this time period. I do that by figuring out at what rate earnings grew during the last cycle and applying that rate to the next 10 years. This involves calculating the EPS growth rate since 2015, taking into account each year’s EPS growth or decline, and then backing out any share buybacks that occurred over that time period (because reducing shares will increase the EPS due to fewer shares).
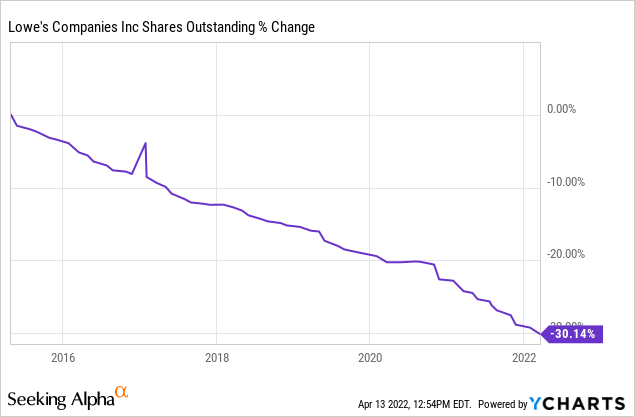
Over the past 8 or 9 years, Lowe’s has bought back nearly 1/3 of the company via share repurchases. These repurchases helped create that smooth EPS graph we saw in the FAST Graphs above and it also inflates the EPS growth over time. I will back these share repurchases out for my earnings growth estimate. After I do that, I get an earnings growth estimate of +17.68% over this time period. Importantly, this doesn’t include a “normal” recession decline because the 2020 recession was so unusual. So even though my earnings growth estimate is lower than the +20.45% from FAST Graphs, I still think my estimate is very optimistic and the odds that Lowe’s can grow real earnings that fast over the next ten years is extremely low. Nevertheless, that’s what I’ll use in the first part of the analysis because I want to show why Lowe’s is so alluring to investors right now who are using similar types of recent metrics to value it.
Next, I’ll apply that growth rate to current earnings, looking forward 10 years in order to get a final 10-year CAGR estimate. The way I think about this is, if I bought Lowe’s whole business for $100, it would pay me back $6.70 plus +17.68% growth the first year, and that amount would grow at +17.68% per year for 10 years after that. I want to know how much money I would have in total at the end of 10 years on my $100 investment, which I calculate to be about $282.48 (including the original $100). When I plug that growth into a CAGR calculator, that translates to a +10.94% 10-year CAGR estimate for the expected business earnings returns.
10-Year, Full-Cycle CAGR Estimate
Potential future returns can come from two main places: market sentiment returns or business earnings returns. If we assume that market sentiment reverts to the mean from the last cycle over the next 10 years for Lowe’s, it will produce a +3.32% CAGR. If the earnings yield and growth are similar to the last cycle, the company should produce somewhere around a +10.94% 10-year CAGR. If we put the two together, we get an expected 10-year, full-cycle CAGR of +14.26% at today’s price.
My Buy/Sell/Hold range for this category of stocks is: above a 12% CAGR is a Buy, below a 4% expected CAGR is a Sell, and in between 4% and 12% is a Hold. That makes Lowe’s a “Buy” at today’s price using my basic analysis. And it’s this sort of signal many other investors are seeing today as well. It is, in my view, what makes Lowe’s such a dangerous stock for retail investors right now and potentially one of the most seductive value traps in the S&P 500.
Why Lowe’s Is Probably A Value Trap
FAST Graphs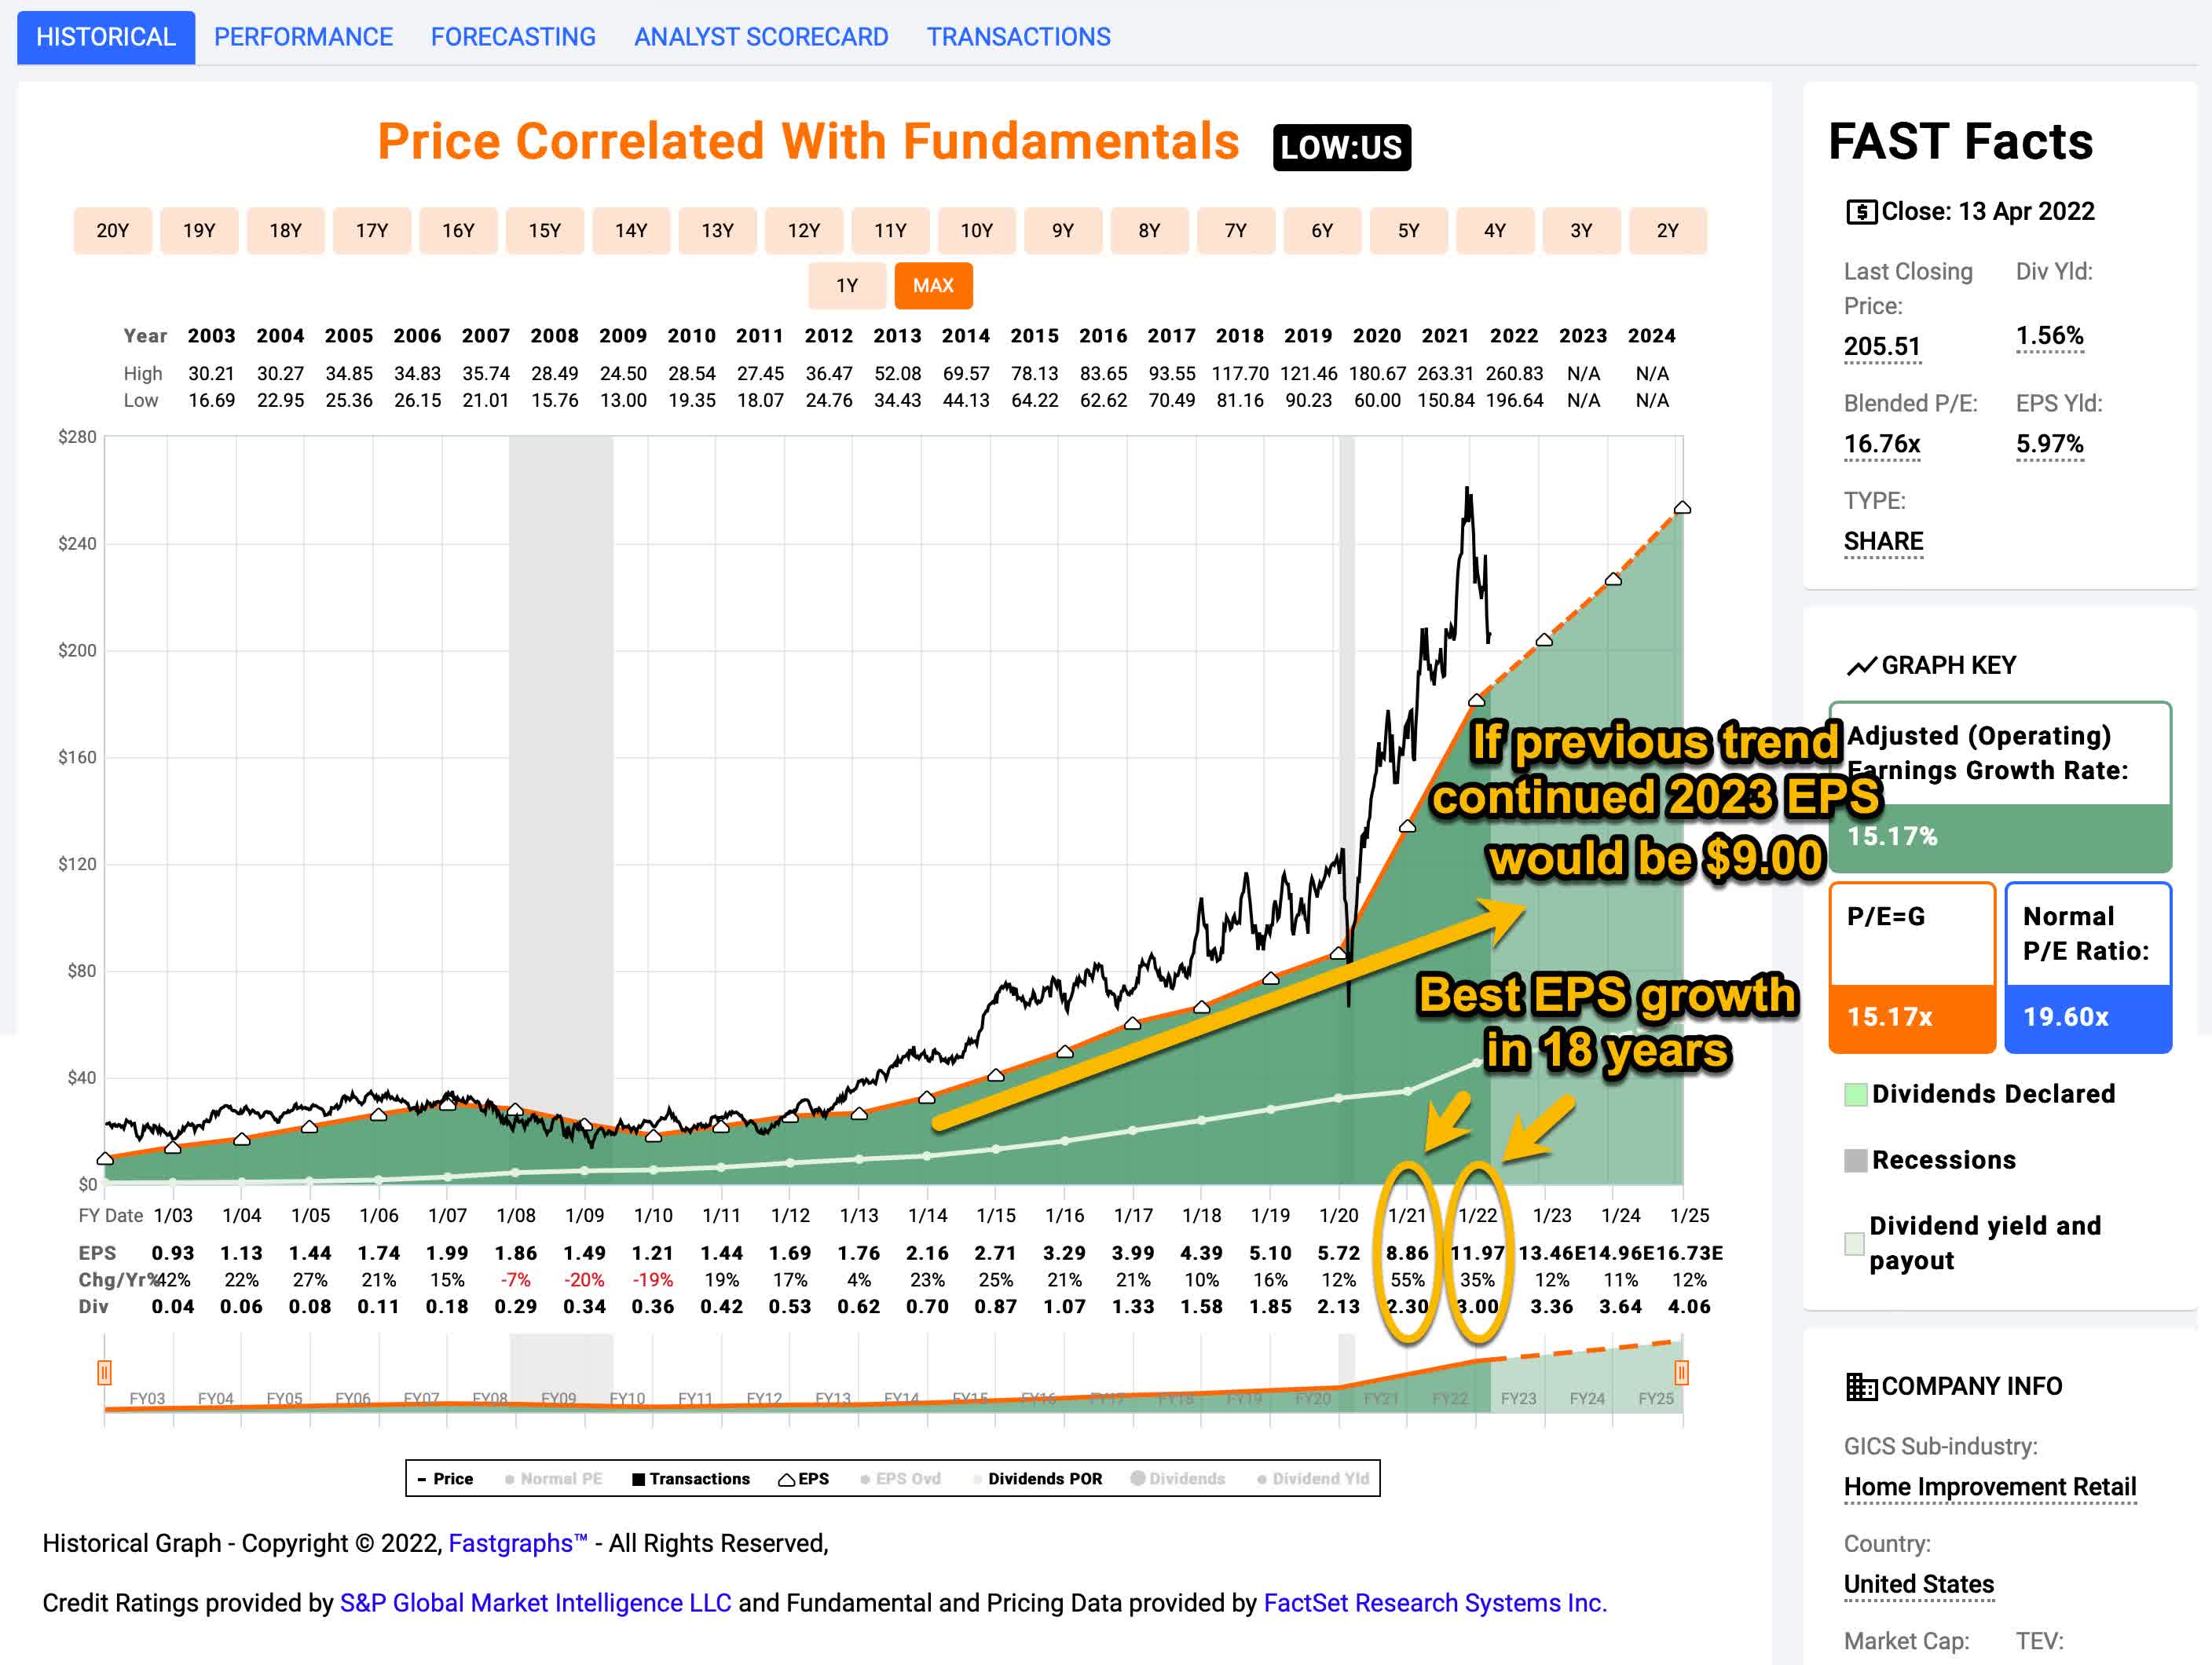
Lowe’s, along with many other stocks, experienced a very unusual recession in 2020. I’ve labeled this pattern as a “Boom/Bust” situation. (I’ve previously written about a similar pattern regarding both Apple and Alphabet you can read here.) Basically what happened was that because of massive stimulus from the government and interventions from the Federal Reserve (along with atypical responses from consumers, like moving out of cities and into suburbs) there were some businesses that normally would have experienced EPS declines during a recession that, instead, experienced a “Boom”. In Lowe’s case, we had a situation where during a quick and mild recession we might have expected EPS to decline, say, -25%, instead, EPS grew +55% in 2021 and +35% in 2022. This is exactly the opposite of what would have happened without government stimulus during a typical economic downcycle. That’s all fine and great news for Lowe’s. The problem is that now many investors 1) have priced the stock for this sort of growth going forward, 2) are not pricing in any sort of real recession when it comes to growth expectations over the longer term, and 3) are not pricing in the fact that, even without a recession, because the stimulus money has essentially ended and most of it will be spent by the end of this year, Lowe’s EPS has a very high probability of turning significantly negative in the calendar year 2023, if not sooner.
In fact, if we simply extrapolated out Lowe’s EPS growth trend leading up to 2020 out to 2023 that would imply about $9.00 per share in 2023. Because there is still lots of cash sloshing around, it might take until fiscal year 2024 for it to show up in Lowe’s bottom line, but I think the $14.96 per share analysts now think Lowe’s will earn in fiscal 2024 will be closer to $11.00 per share. That’s if we don’t have a recession. If we do have a recession, which has a reasonably high likelihood of occurring if the Fed and the government continue their current policy trends, then the calendar year 2023 (fiscal 2024 for Lowe’s) EPS is more likely to be $8 to $9 per share. Any one of these scenarios is likely to sink the stock…a lot. From where it’s at today, even well off its high prices, if the stock price simply retraced to its pre-pandemic highs, investors would be looking at a -35% to -40% drawdown. And if Lowe’s were to overshoot to the downside, it could fall farther than that.
So, basically what we have here is a boom/bust situation that, much like if Lowe’s was a deep cyclical stock, means it is not very useful to use traditional metrics like earnings and earnings growth to value the stock. The reason for this is that earnings are likely to fall, which creates a higher P/E ratio, all other things being equal. That means instead of a stock with fast-growing earnings trading at 14-15 P/E, in the relatively near future, what we have is a stock with falling earnings growth trading at a 22 or 23 P/E. And that is not typically a recipe for a higher stock price.
Usually what I do when it comes to deeply cyclical stocks is to use their past price cycles as a guide for a good entry point to buy the stock. However, because this is such an unusual situation for Lowe’s, there really is no historical corollary to use. That makes it very difficult to know when to buy the stock using my two main evaluation techniques.
Fortunately, Lowe’s has a long history of paying steadily rising dividends, and I think dividend trends could be a good way to value the stock. (Interestingly, I think the dividend trend also lends evidence to by boom/bust thesis, as well.)
Lowe’s Dividend History
Because Lowe’s is currently going through an unusual earnings trend, earnings are not useful to use for valuation. And because Lowe’s typically isn’t a very deep cycle stock, historical price cyclicality doesn’t necessarily work very well as a guide either. That leaves us with using dividend trends as a potential way to value the stock, so let’s take a look at those.
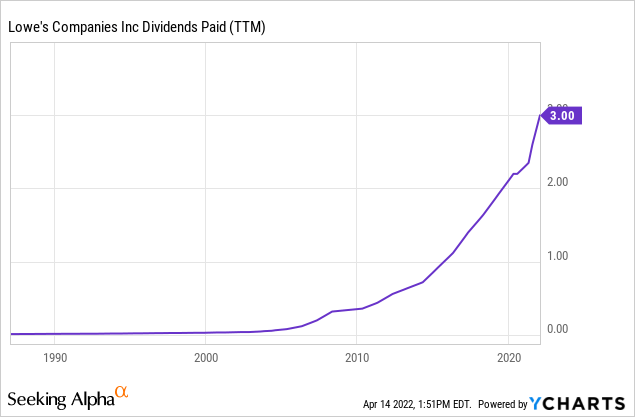
When Lowe’s was in its growth stage as a public company from the mid-1980s through about 2002, it paid what was essentially a token dividend. Starting in about 2002 however, Lowe’s began to steadily raise its dividend each year. Because most managements strongly prefer not to cut their dividend payouts, managements tend to be more conservative when it comes to what they set their dividend payments at and how much they raise them by. For this reason, we can get a clearer insight into how sustainable management thinks the recent earnings growth will be. Remember, that in fiscal year 2021 EPS rose +55%, and in 2022 EPS rose +35%. If management thought that there would not be a corresponding reduction of EPS at some point in the future, then we would expect that they would also raise the dividend payout by +55% and +35%, right?
FAST Graphs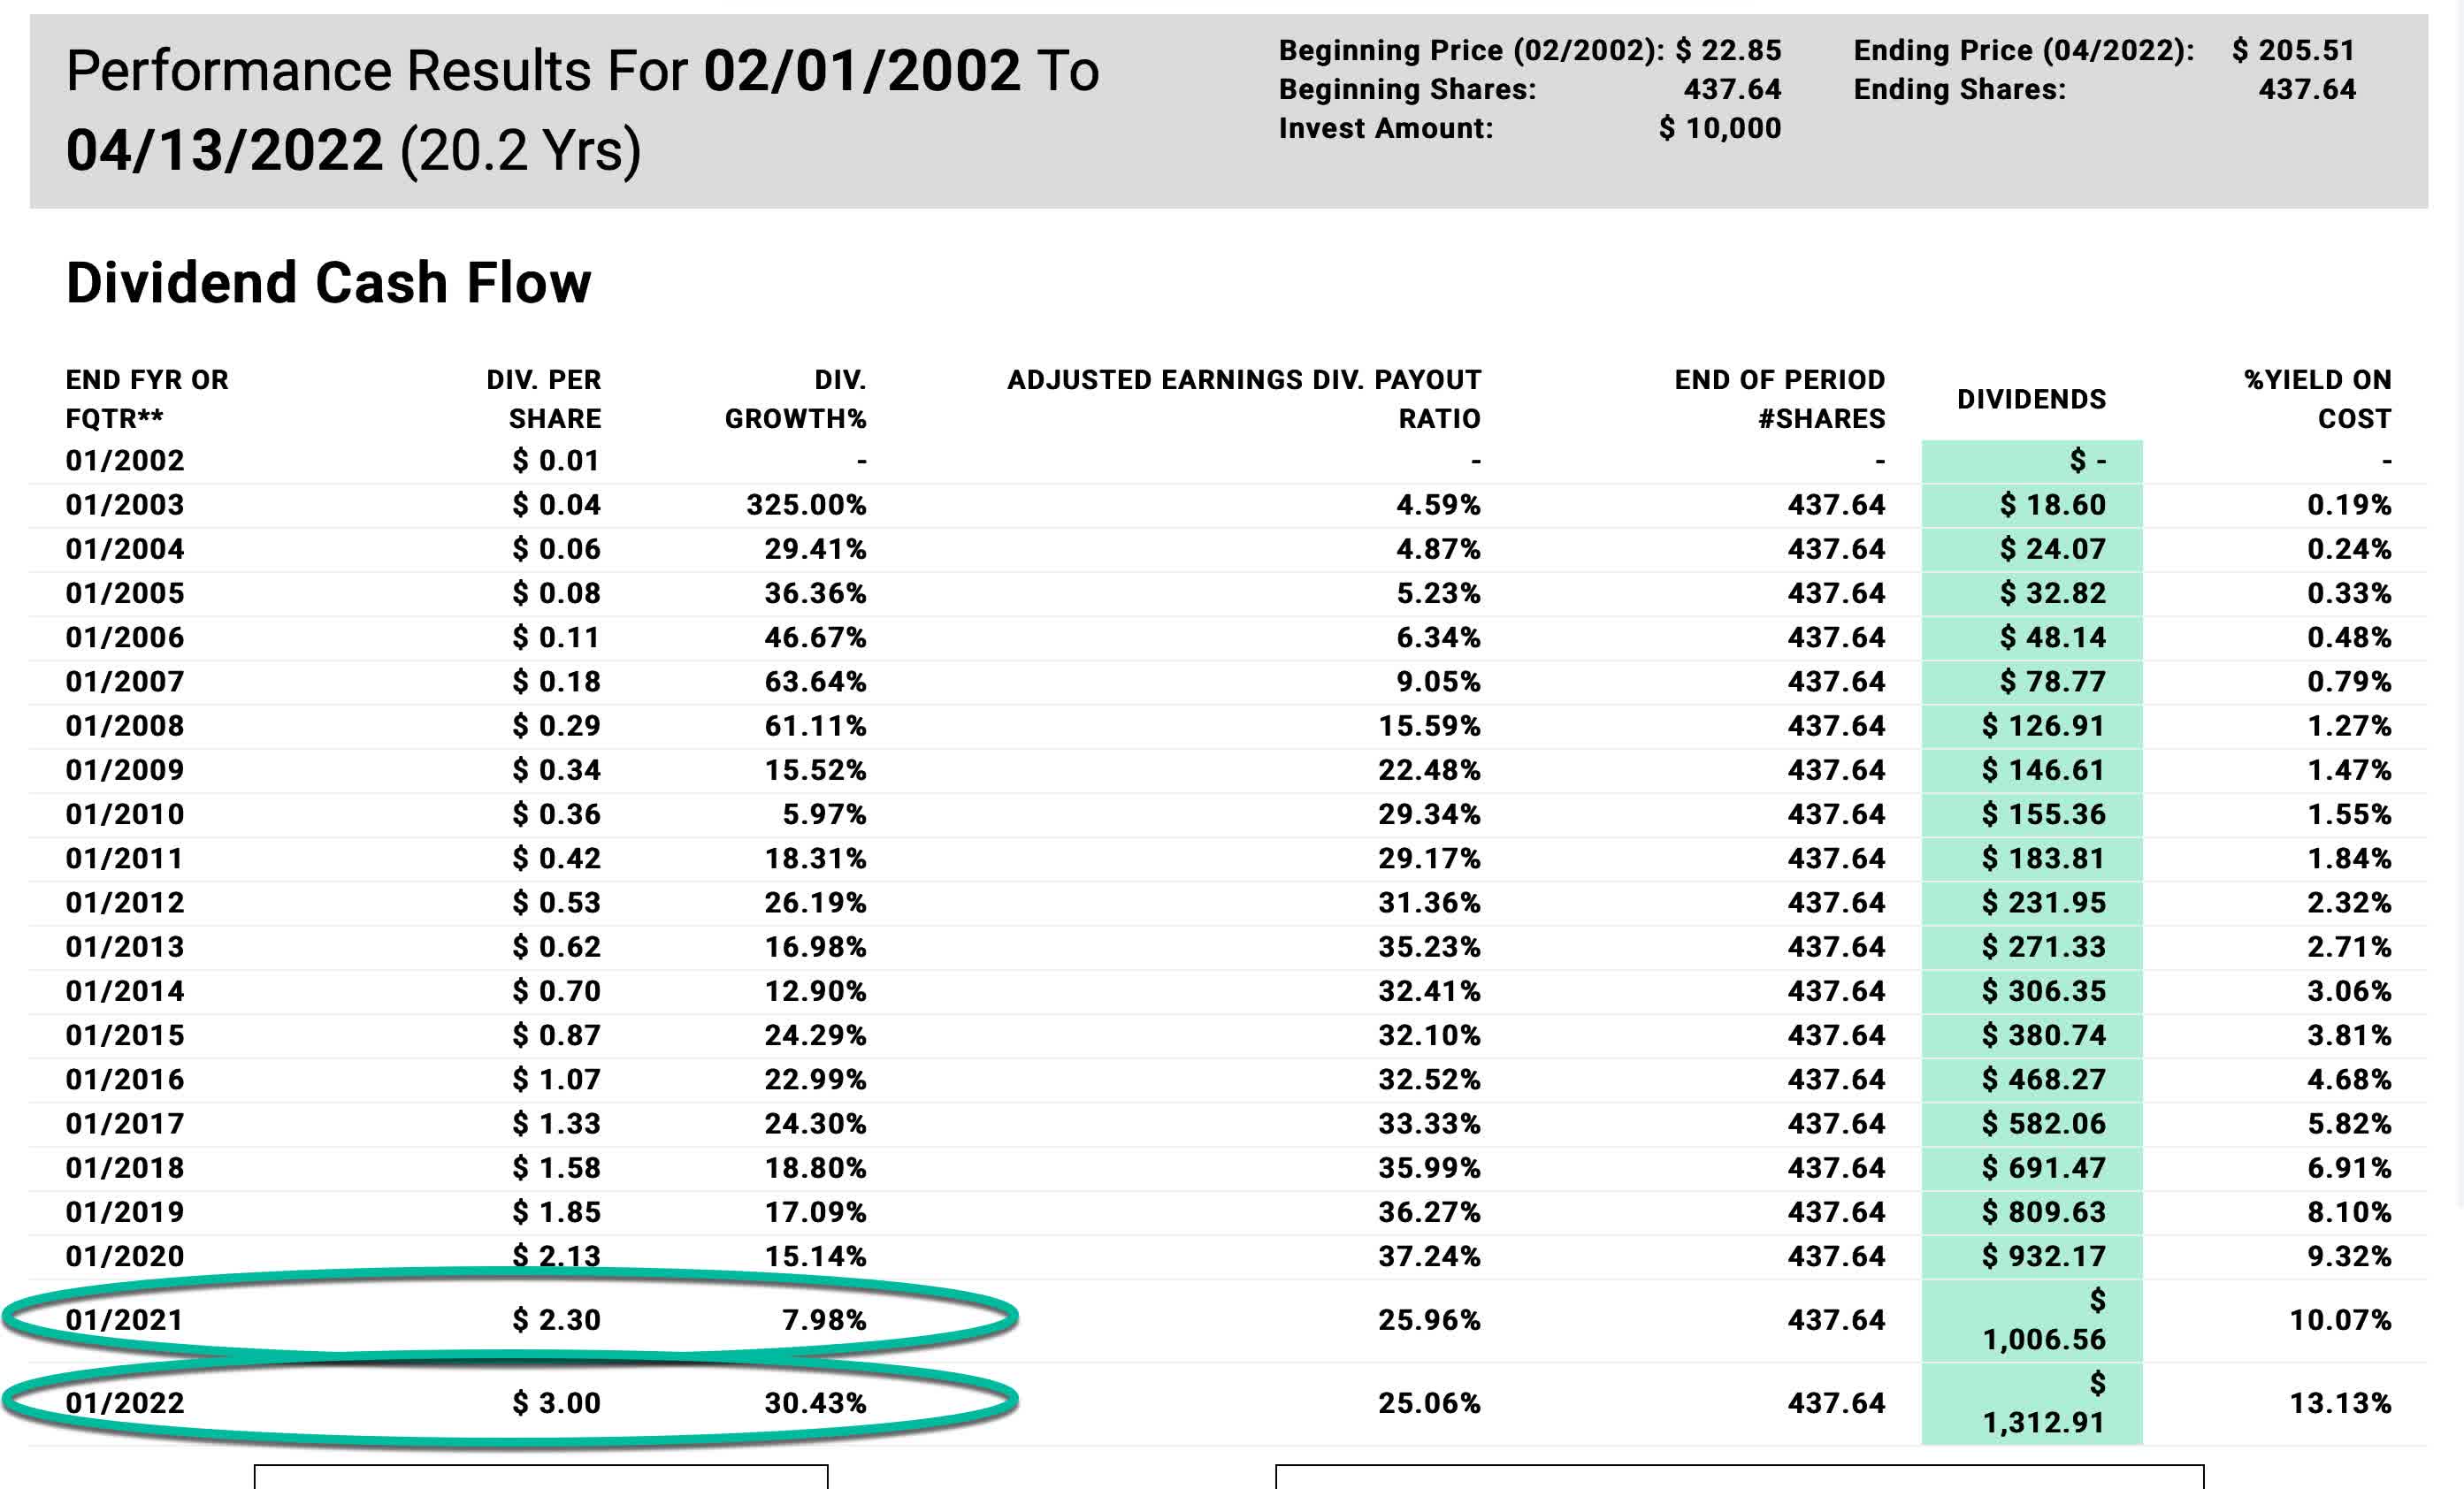
In fact, Lowe’s only raised their dividend by +7.98% in 2021 and +30.43% in 2022. When we combine these raises together, the dividend growth is right on trend with the high teens dividend growth rate Lowe’s had leading up to the pandemic. So, Lowe’s had a massive increase in earnings, but they did not pass any of that extra earnings on to their shareholders via dividends. In fact, their dividend policy is still in line for a company that is expecting $9.00 a share or so of EPS in the future. I think the reason they are being conservative is that they think, just as I do, that current earnings levels are unsustainable. That’s the bad news for Lowe’s investors. The good news for us is that it means the dividend trend can probably be used to value the stock with some degree of success.
Time Until Payback Analysis
Below is my standard explanation of my reason for using time until payback analysis:
When it comes to the vast majority of individual stocks, risk increases with time. This situation is different for major stock indexes, where the longer one holds a major index like the S&P 500, the more likely it is their investment will succeed and produce positive returns. Many investors do not understand this very important distinction. The reason risk increases with time for individual stocks is because it becomes more difficult to predict the future the farther out in time we go. For example, analysts will probably be much closer to predicting Lowe’s earnings next quarter than they will be predicting it in the same quarter 10 years from now. And I have zero confidence an analyst can predict what earnings will be 20 years from now. Whereas, when it comes to the S&P 500, an analyst might be able to get pretty close to predicting long-term earnings because the earnings average out over time to a somewhat predictable level. This fundamental fact when it comes to individual stocks is rarely, if ever, taken into account with traditional analysis like a DCF or dividend discount model, or most other models of dividend valuation. But it should be.
What I set out to do with the form of analysis I will share in this article is to integrate the time-risk into the analysis. And the way I have done that is to frame the valuation question in terms of how long it is likely to take an investor to earn an amount equal to their investment in a stock back, strictly from dividends and dividend growth over time. In other words, if you invest $100 into a stock, what I want to know is how long it will take to earn $100 back only from the dividends. I call this measurement “Dividend Time Until Payback”.
Whether a dividend stock is a good value or not is then based on how far out an investor thinks they can forecast into the future and what they expect to earn in dividends. The time-risk will be subjective for each investor and might vary from stock to stock. But, my view is that for most reasonably high-quality stocks like those in the S&P 500 index, I can probably do a good job forecasting out 10 years into the future, so if I can earn my money back in that amount of time, then it’s likely to be a good dividend investment including time-risk into the equation. On the high end, other than maybe Berkshire Hathaway (BRK.A) (BRK.B), I don’t feel confident predicting the future of any individual stock 20 years into the future or more. So, any dividend stock that looks to take more time than that to pay me back an amount equal to my investment is too risky for me because the risk of disruption, competition, or changing consumer demand over the course of 20 years is too high. And in between 10 and 20 years is a range of payback periods where an investor might be able to make the case of making small adjustments for individual circumstances of each business depending on their predictability. But I think it’s fair to say any dividend stock that takes over 15 years to pay back an amount equal to its investment probably isn’t a “buy”, but perhaps, depending on other factors (like prevailing interest rates, inflation expectations, stability of the industry, etc.), individual cases can be made for those stocks that fall in the 11-14 years range.
Putting all this together, I think it’s fair to create a valuation range using dividend time until payback where 10 years or under is a “Buy”, 11-14 years is a fairly valued “Hold”, 15-19 years is a “Hold”, but overvalued, and 20 years and over is a “Sell” if there are better alternatives that can be found in the market.
In order to estimate how long it would take to earn our investment amount back via dividends, we first need to estimate what the starting dividend yield is, and then also estimate what the dividend growth rate is likely to be. Since most good companies’ dividends often rise year over year, I pull forward dividends expected for the current year rather than use the trailing twelve-month dividends.
If we assume Lowe’s pays out $3.36 in dividends this year, then Lowe’s current dividend yield is about 1.67%.
Next, we need to estimate how fast this dividend is likely to grow over time. This requires a little more judgment. Since I am using very long-term projections in most cases, I never want to assume that dividend growth, over the very long term, will exceed earnings growth (because dividends come from earnings). That said, there are situations where if a payout ratio is relatively low, dividend growth can potentially exceed earnings growth for some period of time. So, what I do, is if the payout ratio is under 50%, and dividends are growing faster than earnings, then I will blend the two growth rates together and use that as our dividend growth rate estimate. But if the payout ratio is above 50%, I will cap dividend growth rate expectations at whatever the earnings growth rate expectation is.
As I noted earlier in the article, my earnings growth expectation is +17.68%. According to FAST Graphs, the dividend growth CAGR over this time period is +16.73%. The payout ratio is only +25.06%. In this case, earnings growth has been a little higher than dividend growth and the payout ratio is under +50%, so I will blend the earnings and dividend growth to use as our forward dividend growth estimate. When I do that I get a dividend growth estimate of +17.21%.
Ultimately, what I am interested in estimating is how long it would take to earn $100 on a theoretical investment of $100. We can do this by taking the current dividend yield of 1.67% and applying that to $100, which would pay us out $1.67 per year if the dividend never grew. But, we expect the dividend to grow at about +17.21% each year, so we need to take that into account as well. I assume that this money is collected by the investor and not reinvested in the stock and I go ahead and pull the first year’s dividend growth forward. So, at the end of the first year, I assume we would get paid $1.96 on our $100 investment. This process continues for however long it takes to collect $100 worth of dividends and when it crosses that threshold, it will be our “Dividend Time Until Payback” as measured in years. Using this method, it will take about 15 years to earn our money back via only dividends with Lowe’s stock.
This places Lowe’s right on the line of being overvalued, just over where I would consider the “fair-value” range for the stock using the dividend method. Here is where the categories work out in terms of Lowe’s prices: above $188 per share is overvalued, but perhaps not overvalued enough to sell. Above $450, the stock would be a clear “sell” even for long-term holders. Between $71 and $188 per share would be the “fair value” range. And under $71 Lowe’s stock would become a “buy” even for value investors like myself.
If we assume that Lowe’s could still fall about -35% from here during a downturn, that would produce a price of about $131 per share, which also happens to be close to the mid-point of fair value and I think that price also has a fairly high probability of actually occurring during a downturn. The $71 per share would require an overshoot to the downside, but I think investors would be rewarded if they aimed for that price. I like to aim for the very cheap prices, but for most investors, taking 1/2 position around $131 and reserving another half if the price falls to $71 is a reasonable strategy.
Conclusion
In order for a stock to be a “value trap”, it needs to 1) look very attractive to investors, and 2) have a high likelihood of falling deeper than one might expect given the current valuation metrics. I think Lowe’s meets both of those standards because of unusual “boom/bust” dynamics caused by government stimulus and unique pandemic activities. It looks attractive on the surface, but management’s dividend policy (along with some common sense) tells us not to trust the current earnings trends, and not to extrapolate those out far into the future. I think it’s reasonable to think Lowe’s stock could still fall another -35% to -40% from here if we have a bear market. So, even though Lowe’s is getting close to the high end of fair value, it likely isn’t “cheap” at today’s price and has further to fall at some point over the next 1-3 years.
Be the first to comment