

twohumans
We are all aware that the Fed’s primary objectives are price stability through inflation targeting over the medium term (2%), and the unemployment rate. Even while the labor market is one of the most lagging markets in the world, it remains extremely robust, allowing the Fed to concentrate on bringing medium and short-term inflation expectations back on track with the target of 2%. As it was extremely bearish for the stock market and still is, as we emphasized for (SPY) in our previous analysis, it is now bullish for bonds and heading for a large reversal in the next few months. While the bond market has priced in an additional portion of tightening, the stock market has not.
According to Jerome Powell at Jackson Hole:
That brings me to the third lesson, which is that we must keep at it until the job is done. History shows that the employment costs of bringing down inflation are likely to increase with delay, as high inflation becomes more entrenched in wage and price setting.
Currently, the strongest portion of rate hikes is already included in Fed Funds Futures, and thus in bonds, there is room for sideways or reversal. I will explain it in more detail. It’s extremely likely the fed will fulfill the condition that rates > inflation to calm it down, as they did every time in the previous tightening cycles.
FFER > CPI (YoY) in almost every hiking cycle (FRED)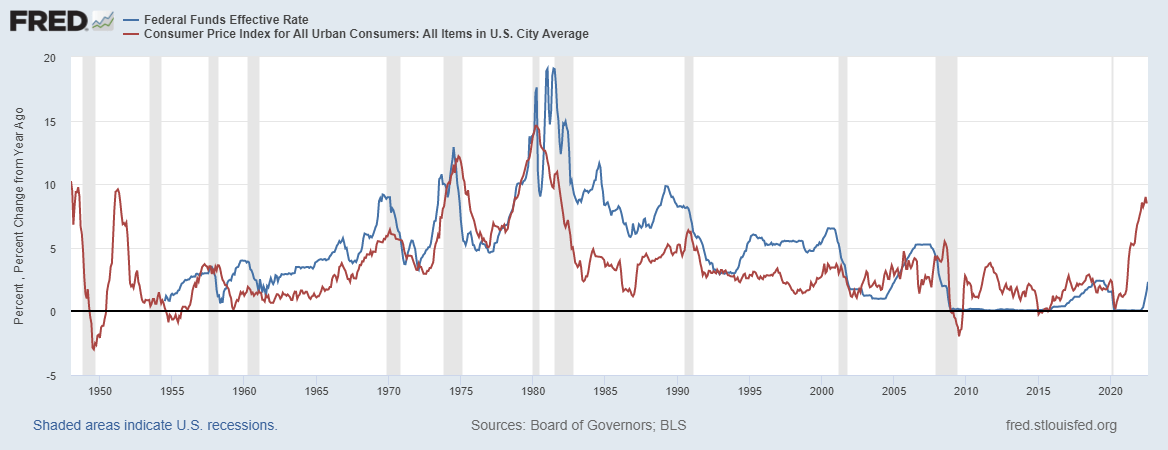
Fed will raise rates until the job is done
To understand how many bps in rates the market is currently pricing in, we need to look at the Fed Funds Futures till the end of 2022 and 2023. The market is currently expecting rates to be at 4.05% at the end of 2022 and 3.86% at the end of 2023. The spread between them slightly widened after the August inflation print. The Fed delivered to the market participants exactly what it wanted. And the bond market takes it very seriously.
Market expectations (Dec 2022 and 2023) (Author’s calculation via Tradingview)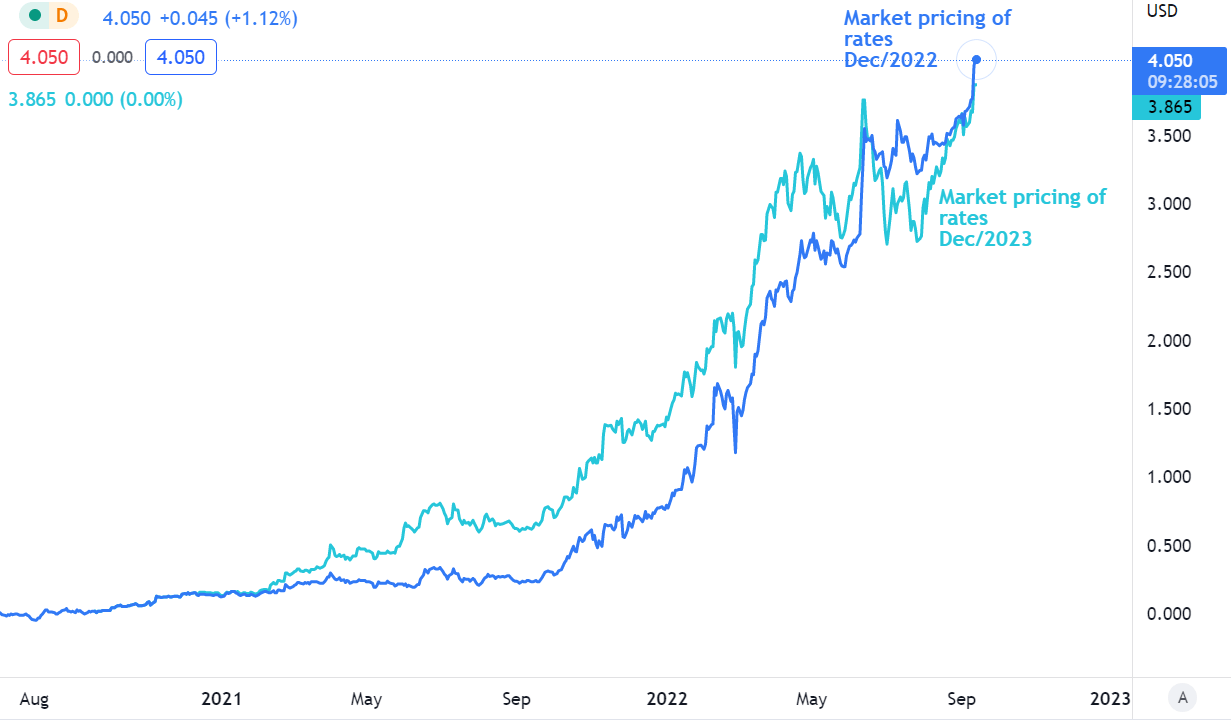
However, the market anticipates that rate hikes will continue at almost 4.4% till April 2023. Thus, from April to December 2023, investors expect a portion of rate cuts of approximately 50 bps. Consequently, if mid-term yields further increased, the market would anticipate an even more substantial portion of the tightening process. It could be delivered if demand-driven inflation did not ease. That is just the case, as we saw in the latest inflation print, which significantly beat estimates upwards, heading to a strong MoM Core CPI of 0.6%. The market immediately priced in additional rate hikes (25 bps till the end of 2022) and the odds of a 100 bps rate hike increased to 35%. There is no better time to load up on some bonds as the market has already priced in further rate hikes, so you can buy bonds at more attractive prices.
I have developed three potential core inflation scenarios. The first scenario (blue) assumes a 0.25% (August’s 0.6% MoM growth already included) monthly increase in core inflation until July. The optimistic scenario (orange) is based on a 0.10% increase in MoM core inflation. Such a scenario is possible when the economy undergoes a period of tightness and demand declines dramatically. My baseline scenario is predicated on a degressive posture of MoM core inflation, with monetary tightening having minimal impact in the first several months (due to the lag in the economy).
However, in the fourth quarter of 2022 and the first quarter of 2023, the impact of the tightening cycle might be fairly significant, resulting in potentially negative monthly contributions. I believe that this is the most probable scenario. Moreover, I would not be surprised if the Fed achieved its target even sooner. This scenario is very much underestimated by the general public and the market. EFR (Effective Fed Funds Rate) was valid in the dataset until August; since then, FFR has been utilized on market expectations (futures).
Some may be wondering why core inflation is falling so quickly. First of all, YoY calculations are influenced by the base effect, so inflation (YoY) would fall even if CPI rose by zero percent. However, the purpose of this chart is to conclude when the Fed’s job will be done. It varies for each scenario. Nevertheless, I firmly believe, the Fed will achieve its objective. The right question should not be whether the Fed can suppress inflation, but mainly when. Logically, the most aggressive reduction of MoM core inflation would lead to the early fulfilment of the “key secret”: rates > inflation. The Fed’s pivot was postponed to the next one-two months after the latest inflation print. In the orange scenario, the conditions (rates above inflation) would be met in March; in my own model, it could be in February; and with the blue scenario, it could be in April. Bear in mind that it is just a model, but it can help us navigate our expectations. Anything can happen in the following months to change such scenarios.
Fed pivot and Core CPI (YoY) (Author´s calculations)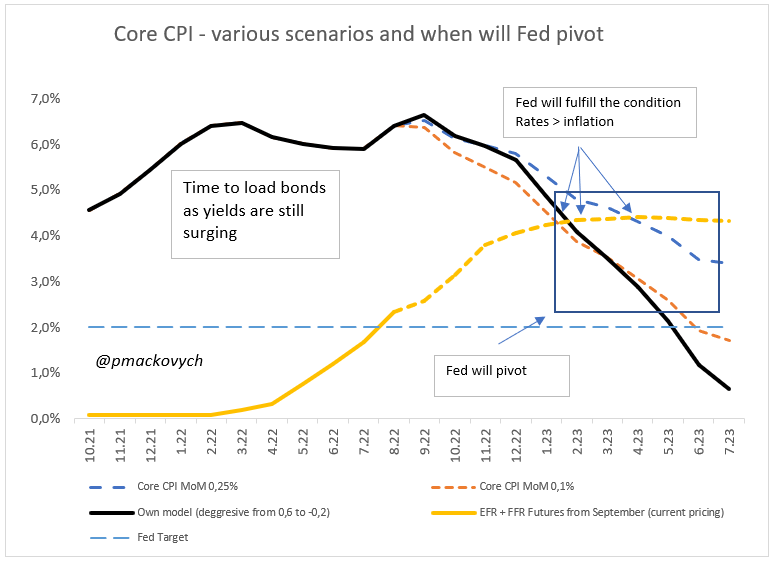
Nevertheless, based on this approach, it is still a great time to load up on bonds, ideally with maturities ranging from 7–15 years. Also, (TLT) can be a good choice, as I pointed out in the bullish analysis in June, but currently it can be a better fit for (AGG).
Average maturity of AGG (iShares)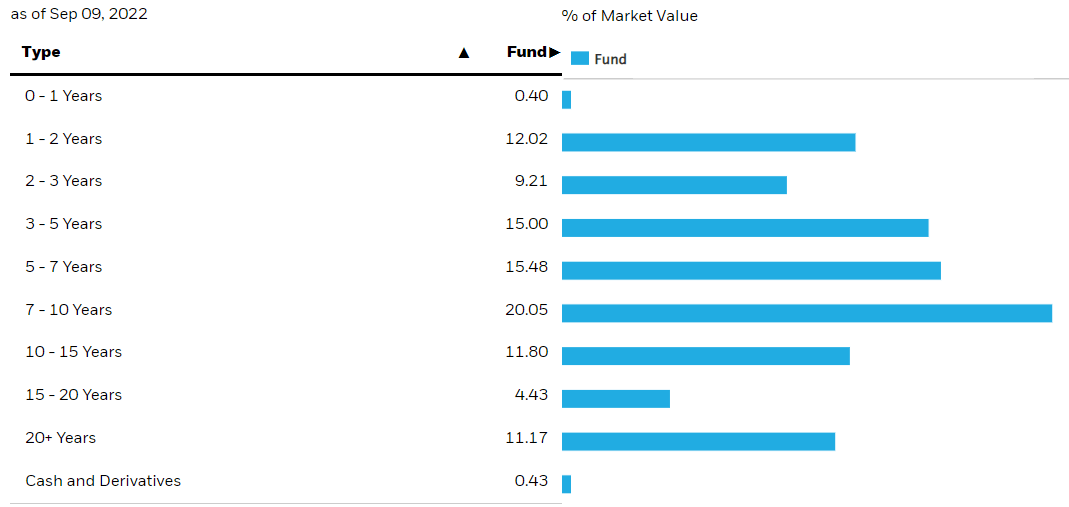
Fed’s pivot will reveal absolute opportunity
You don’t want to be late to the party. In my view, the best scenario is to allocate funds to some bonds during this time, when yields are still surging or moving sideways. According to my analysis, when everything proceeds as planned, even in the blue scenario (conservative), the Fed should stop hiking when rates will be higher than inflation and the market will tend to price in further rate cuts. In my view, the bond market as well as FFR (measured by market expectations) are already very hawkish. Yes, it could be even worse if inflation prints from the following months are ugly, but still, it won’t change the logic (dramatically) behind the thesis.
In the following great chart from @MichaelKantro, the author reveals the moves of the 10Y bonds before and after the last 6 Fed Pivots. However, while I slightly agree that a pivot was and is a pure signal to be long in bonds, the fact nowadays is that in the previous 5 cycles, there was no policy of forward guidance. Maybe in the last cycle. As we revealed in the previous chart with our scenarios, even with a conservative one, the Fed pivot will come once the job is done. It’s just a matter of time when. The market will price in the pivot even faster and before the Fed. It will depend on inflation expectations and other macroeconomic data.
10Y yield before and after last 6 Fed pivots (@MichaelKantro)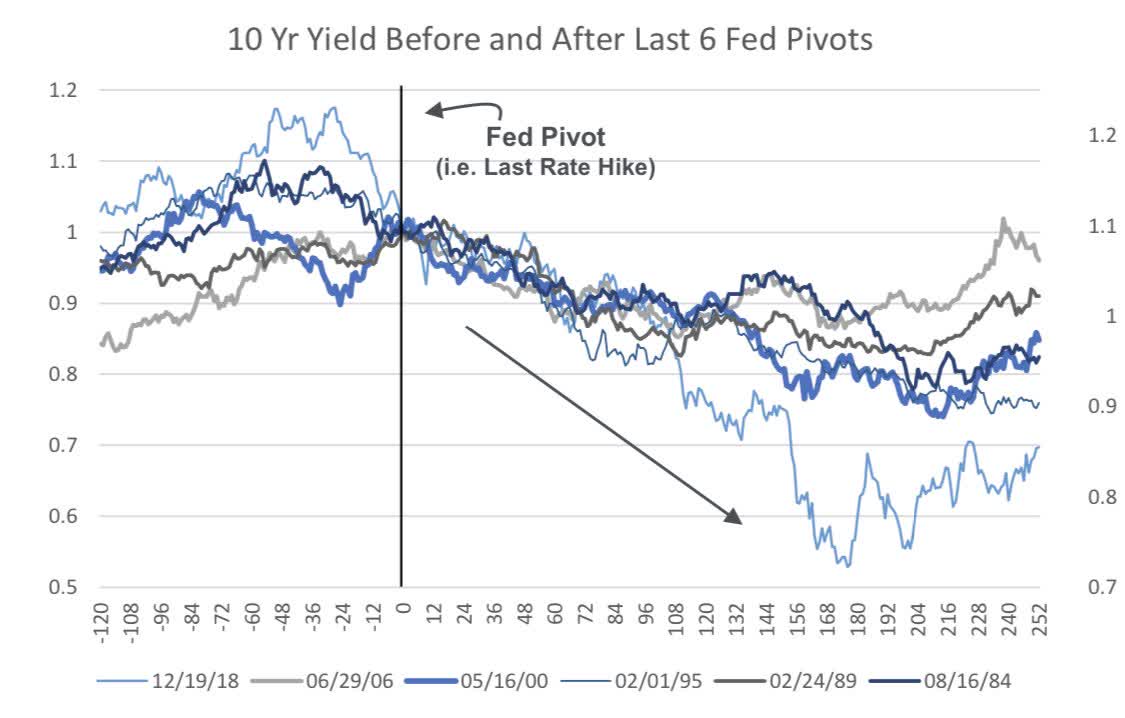
We currently don’t know if the Fed will cause the recession or not. But it is clear that big shocks caused by aggressive tightening make the odds of a recession higher.
Irrational or not, inflation will go down sooner or later, just because of the base effect we mentioned before. However, if a recession or light economic slowdown continues, it will most likely bring inflation down even quicker.
Summary and risks
The main risk to this thesis is that inflation becomes rampant in the long-term cycle and thus cannot be easily stopped. However, it is partially mitigated by the expectations of further rate hikes, and if inflation spikes higher, the Fed will act and raise rates even more to calm it down. This investment thesis is built on a mid-to long-term narrative, not a weekly one. It is good to “load up” on some bonds as yields are still high. The big pro of this thesis is that the market is currently pricing quite a solid tightening process. Thus, the decline is likely limited, in my opinion.
The significant risk is that if inflation becomes structural and hard to control, then it would take months for the Fed to calm it (with a lagging effect). The main narrative of the inflation slowdown is caused by the base effect, and its postponement could cause another bearish rally in the stock and bond markets. However, one of the key reasons why August’s CPI print became so surprising was hidden in the main item of the CPI basket—shelter. It is the main contributor, which rose 0.7% MoM. To be objective, if we subtract this item from Core CPI and CPI, the following results are:
MoM Change in CPI compared to „less shelter“ item (Investro)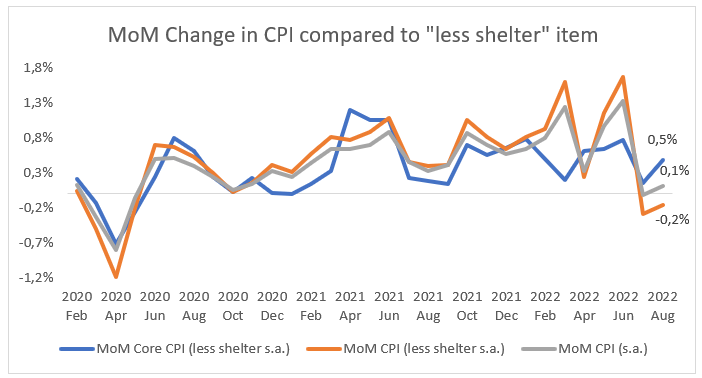
When we use a conservative or my baseline scenario, they both imply a solid rise in core CPI that is temporary due to the base effect, and at the end of the day, it will cause a slowdown in YoY print. Yes, the Fed cannot pivot right now, and we are not even talking about that. Like almost every time in the history of tightening cycles, the Fed will probably hike rates over the YoY rate of inflation, and then wait for some time (1-3 months) to convince itself that inflation will be down. With the combination of such inputs (monetary tightening, commodity prices down, demand weakening, and base effect) , I’m convinced that inflation will go down.
Such a situation would be so bullish because, even with a conservative case based on a strong rise in core CPI MoM (0.25% in the conservative model), the base effect could cause inflation to go below the interest rate. After that, it will be important to look at the medium-term inflation expectations, such as the 5y5y forward inflation expectation. In my opinion, then there would be a great opportunity for the Fed to pivot. Until then, I’m firmly convinced that the current situation is very bullish and that every investor has enough time to build a medium-term position. Waiting for the Fed to officially pivot in 1Q23 to load up on bonds is not the best strategy, as you won’t get such premium yields as today or in the next few weeks. For me, the strongest argument is that the market has already priced in many additional rate hikes, which are above the neutral rate (I analyzed it here).
Currently, I estimate that we have approximately 2-4 months until the Fed reverses course or unveils a forward guidance strategy that is somewhat less hawkish. With a substantial amount of tightening now priced into bonds, I believe there is only a little room for a further decline and an increase in medium-term rates.
Be the first to comment