

bjdlzx
(Editor’s Note: CL1:COM is a crude oil futures contract. Investors without access to the futures market may consider bearish crude ETFS. NOTE that leveraged ETFs are expected to suffer from price erosion over time.)
For some time now, I have believed the oil market to be broken, where data is ignored and outdated core beliefs of the market rule. I first took action on this belief on March 15, 2022, when I initiated a short position in WTI crude (CL1:COM) using WisdomTree WTI Oil 3x Short Daily ETP in USD (ticker:3OIS) through a margin product. I have since sized up my position on 13 separate occasions. I don’t usually disclose my position in such detail, but I believe such a controversial issue must be read with disclosures in mind.
Before diving in, I need to clarify that this article will focus on WTI crude prices, and any reference to oil price uses the price of crude.
For ease of reading, this article will be broken into seven separate points:
- Oil is trading at a premium based on historical data points
- U.S. supply is beginning to come online again
- Global recession risk is rising
- Increased oil demand for energy in the EU is likely only temporary
- The Iran deal is likely to close
- Russian oil is still flowing
- Conclusion and risks to thesis
Oil is trading at a premium based on historical data points
The price of oil is largely based on three factors, current/future supply, current stockpile, and current/future demand. However, when we look at global stockpiles, oil is currently priced at a significant premium.
A staple of oil price movements is the U.S. Energy Information Administration’s weekly This Week in Petroleum publication. The market always pays close attention to the U.S. stockpile numbers, which affect price movements. However, if we take a more comprehensive look at days of supply historically, we find that $70 and below per barrel is far more in line with the historical median based on current stockpiles. I used the median of the four crude oil futures contracts included in the weekly report for price.
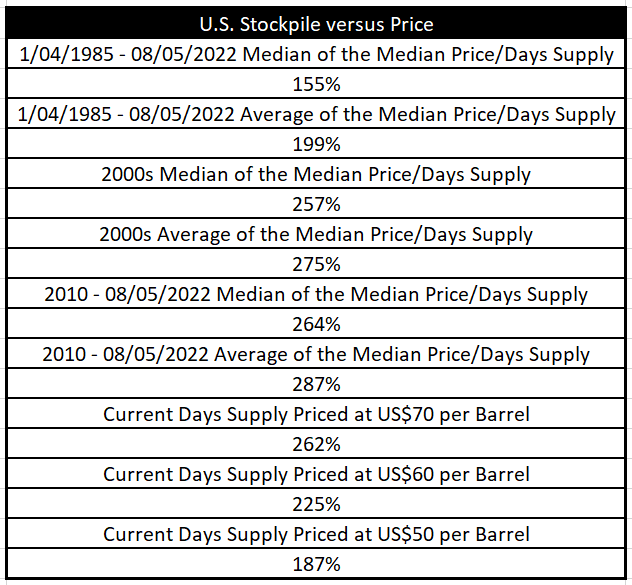
Created by Russell Katz (1.) (Data collected from U.S. EIA)
But it’s not just oil stockpiles versus price that is historically high. If we look between 1972 and 2021’s annual global oil (not just WTI crude) production and consumption, a similar story emerges. Why 1972? It is as far back as YCharts data has recorded.
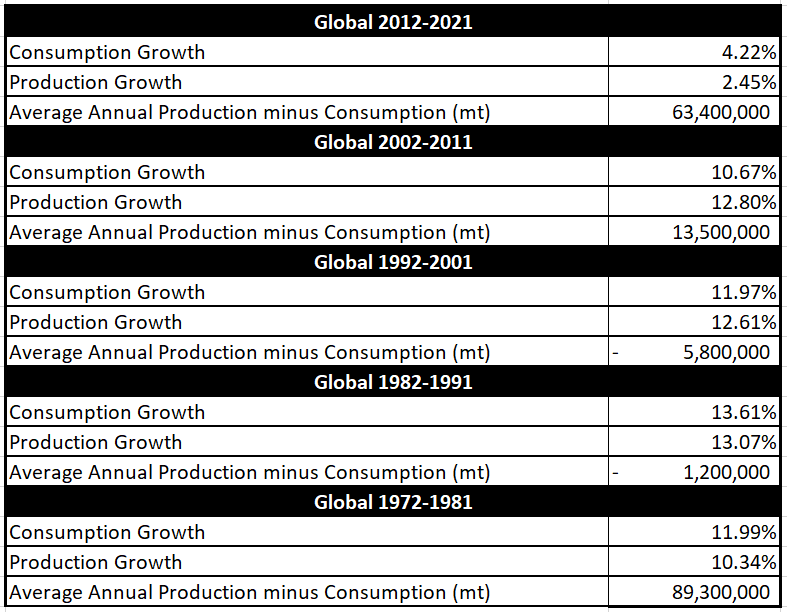
Created by Russell Katz (2.) (Data collected from Ycharts, U.S. EIA, datacommons and worldometers)
Despite consumption growing at almost twice the rate of production over the last ten years, the period between 2012 and 2021 experienced the largest average annual surplus (mt) since 1972 through 1981.
Additionally, 2012 through 2021 saw the lowest ten-year growth in oil consumption (4.22%) in this entire data set. Sure, COVID-19 hit, but 2021 saw a 5.65% increase in consumption, and even if we use the period between 2012 and 2019, 8.71% growth is still almost a full 2% less than the second lowest period in the data. Remember, the U.S. EIA’s August 9, 2022, Short-Term Energy Outlook report estimated consumption won’t reach pre-pandemic levels until approximately Q1 2023 and that stockpiles will continue to build until the end of 2022.
Based on historical data, oil seems to be trading at a premium, but clearly without much of a fundamental basis. Let’s continue digging, and by the end, you will see why I believe oil should actually be trading at a discount.
U.S. supply is beginning to come online again
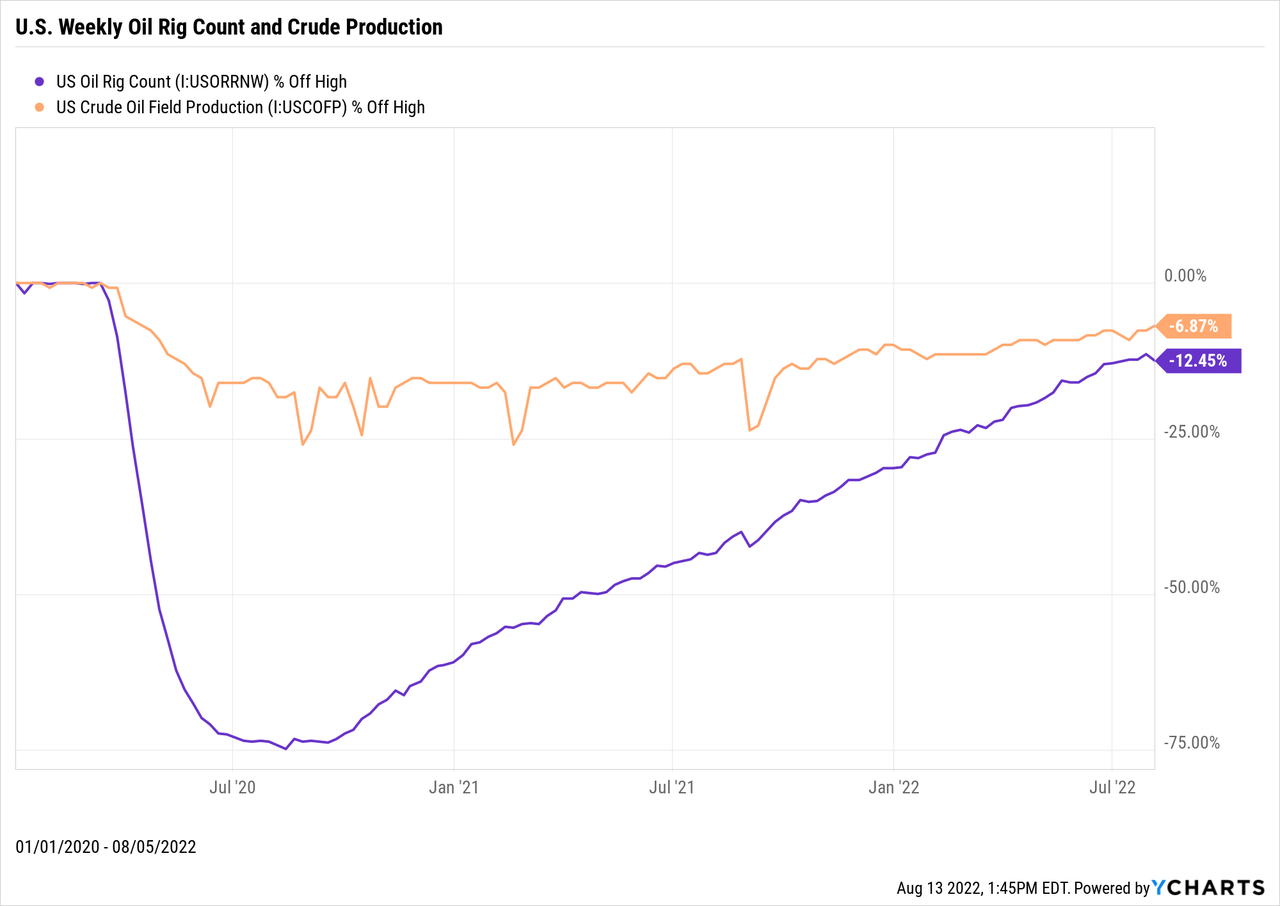
According to the U.S. EIA, weekly U.S. field production of crude oil reached an all-time high of 13.1m barrels per day the week of March 13, 2020. When COVID-19 hit, and oil demand plummeted, U.S. production plummeted. While global oil production has been steadily recovering from its pre-COVID-19 highs, U.S. production has more or less just started to recover.
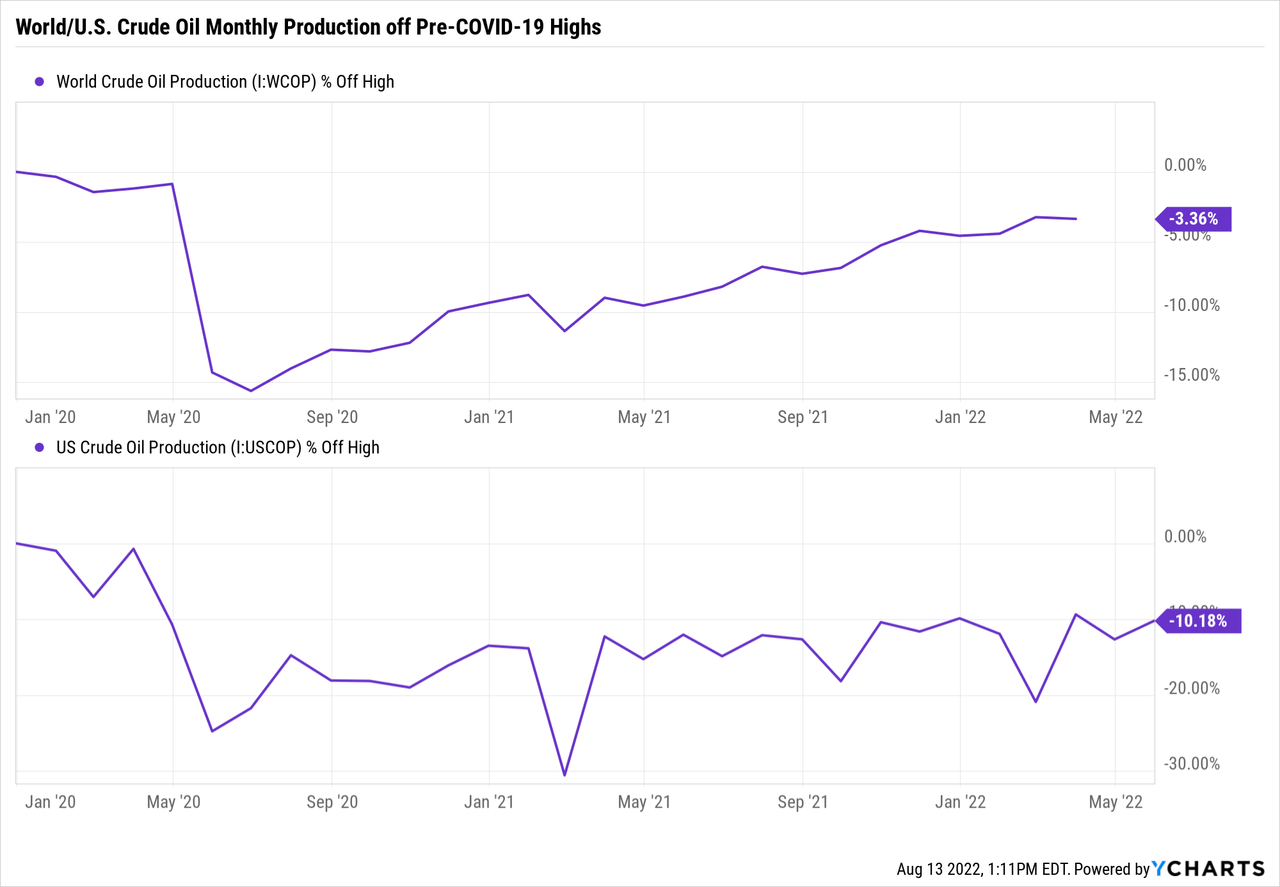
Still, oil production in the U.S. has recovered much more than the above chart suggests. You see, it is not a simple matter of flipping a switch, and there is a hesitancy among U.S. drillers to turn back on the tap. But 2022 has seen a significant uptick in the number of rigs coming back online, and U.S. oil driller CAPEX spending indicates this trend will continue.
Further proof of this is supplied by a U.S. EIA August 9, 2022 report, which forecasts the U.S. will average 11.9m barrels of crude oil per day in 2022, and 12.7m in 2023. While this might sound like the forecast assumes a decline in U.S. crude production for the remainder of 2022, remember we are talking about average daily annual output. For example, the week of March 13, 2020, that I mentioned above (13.1m), but the current record for U.S. average daily crude oil production on an annual basis is only 12.3m (2019).
Global recession risk is rising
As the saying goes, only two things are certain in life: death and taxes. So while not a certainty, the risk of a global recession is rising, but don’t take my word for it; let’s briefly examine what the experts have to say.
Starting in the UK, in the first week of August 2022, the Bank of England (BOE) issued a rather dire outlook for the UK economy, forecasting a recession will begin between Q4 2022 and early 2023 after inflation peaks at 13.3%. The BoE forecasts it will last for at least a full five quarters, with GDP declining over 2% from its peak.
As of the European Central Bank’s (ECB) most recent press conference (July 21, 2022), its base case has the EU economy growing 2.7% in 2022 and 1.5% in 2023. However, the EU did note:
Risks to the forecast for economic activity and inflation are heavily dependent on the evolution of the war and in particular its implications for gas supply to Europe. New increases of gas prices could further drive up inflation and stifle growth.
Unfortunately for the EU, since its summer forecast was released in early July, gas futures have rallied rather significantly:

Screenshot taken 08-14-2022 (ICE Endex)
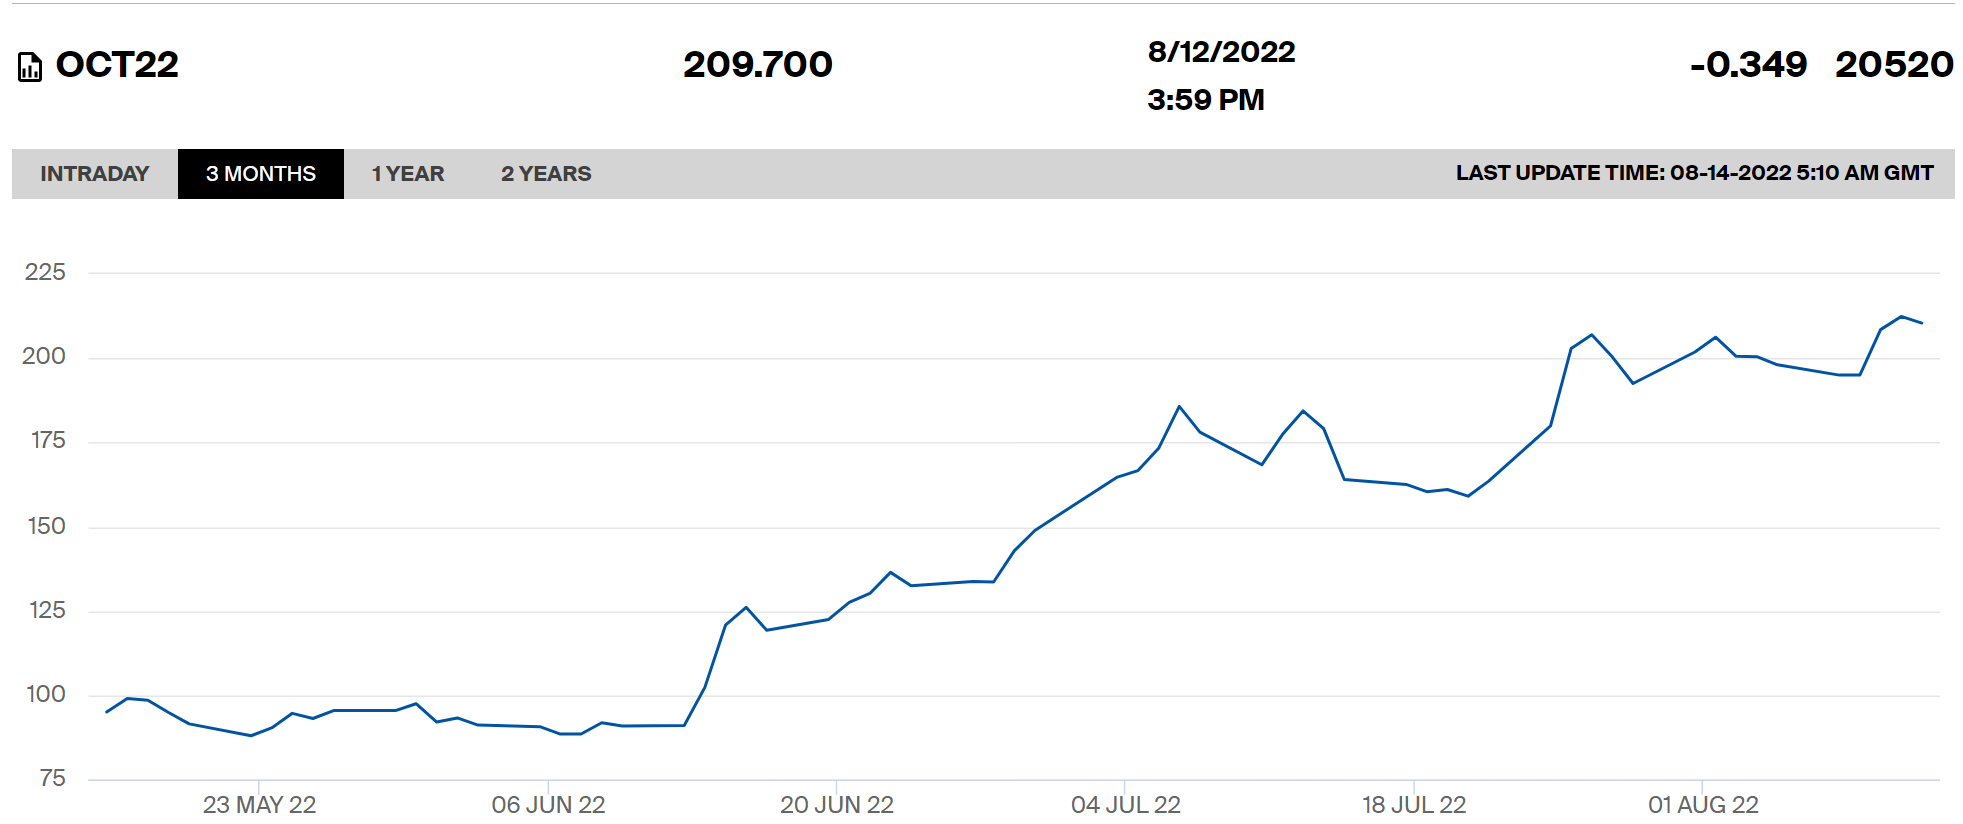
Screenshot taken 08-14-2022 (ICE Endex)
As we will go into greater detail later, gas prices are expected to continue to rally, and the EU is concerned that Russia will shut off or limit gas delivery over the coming winter. So while the EU’s base case is minimal growth in 2023, one of the key risks was rising gas prices, which have continued to rally. Additionally, as reported by the Financial Times on July 22, 2022 (after the EU forecast), the EU’s business activity has fallen for the first time since February 2021 (COVID-19 lockdowns). According to S&P Global’s flash eurozone composite purchasing managers’ index, output and new orders fell. Combine this with the composite PMI (services and manufacturing activity) dropping below 50 to a 17-month low of 49.4, far below economists’ estimates of 51, and the summer base case is starting to look a little optimistic.
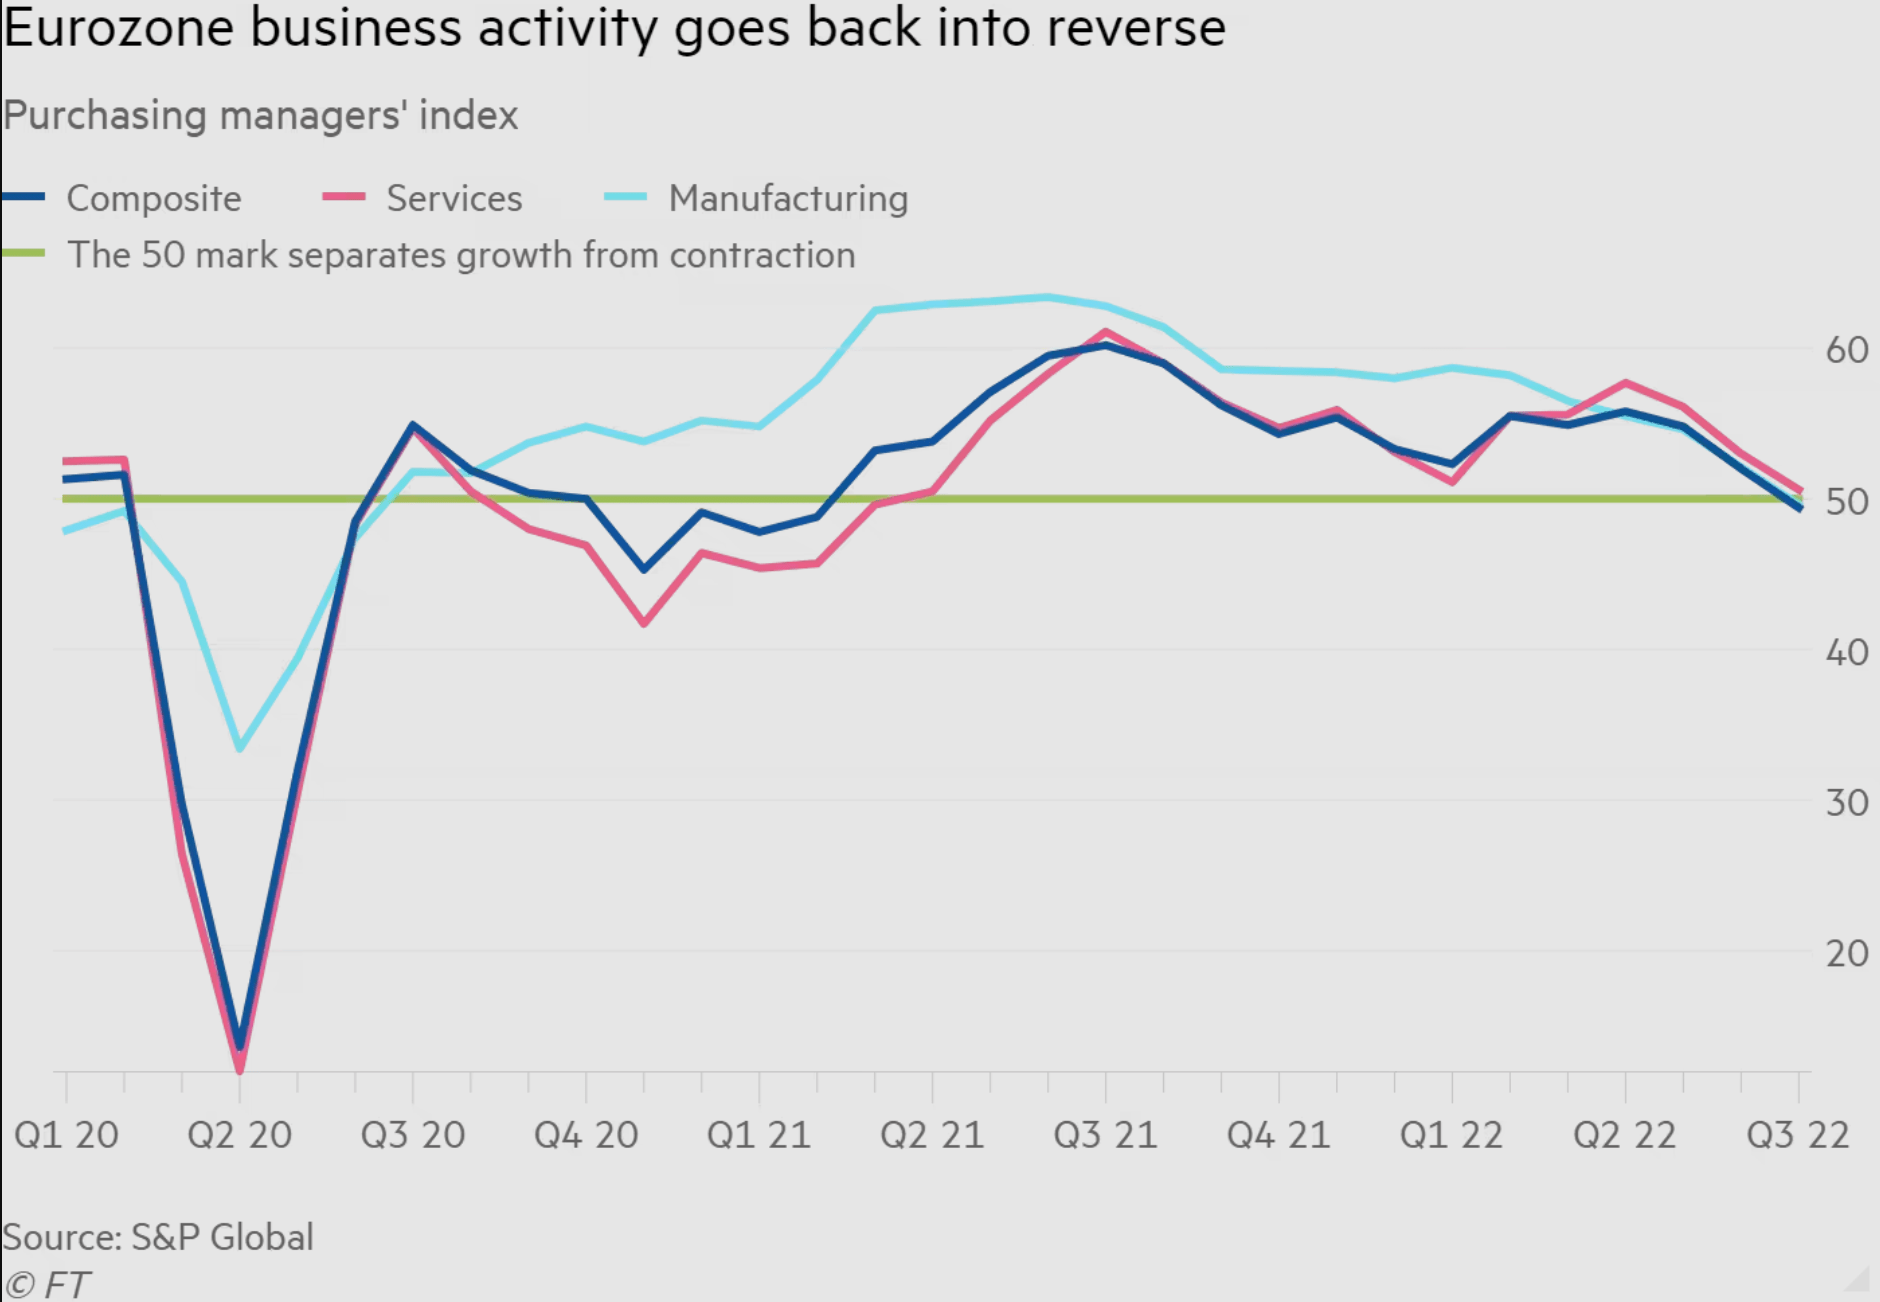
Screenshot from article linked above (Financial Times)
In the U.S., the outlook is far from clear, but economists polled by Bloomberg placed the median probability of a recession over the next 12 months at 47.5% in July 2022. While this might sound good initially, keep in mind that this number was only 30% in June 2022. The constant contradictory statements made by Federal Reserve Chair Jerome Powell make the situation far cloudier than it needs to be. It seems the two most prominent risks facing the U.S. economy are inflationary pressure and rising interest rates. The wage growth seen in the U.S. (10.25% in June 2022 YoY) is heavily based on new hires, and I believe we will start to see demands from existing employees for raises surpassing those advertised. If you stuck with a company through the tribulations of COVID-19, would you be okay earning the same as somebody who joined the company a month ago?
Additionally, most economist’s belief that a recession won’t hit the U.S. is based on the Federal Reserve either ceasing to raise rates or lowering them in 2023. Based on previous comments from Chair Jerome Powell, I believe this is far from a certainty.
It is important to note that this is just a brief summary of the existing situation in the UK, EU, and U.S. Therefore, I believe it is best to conclude with a summary chart of Vanguard’s forecasts as of July 7, 2022, which includes a fantastic summary of the key drivers and risks of recession risk.
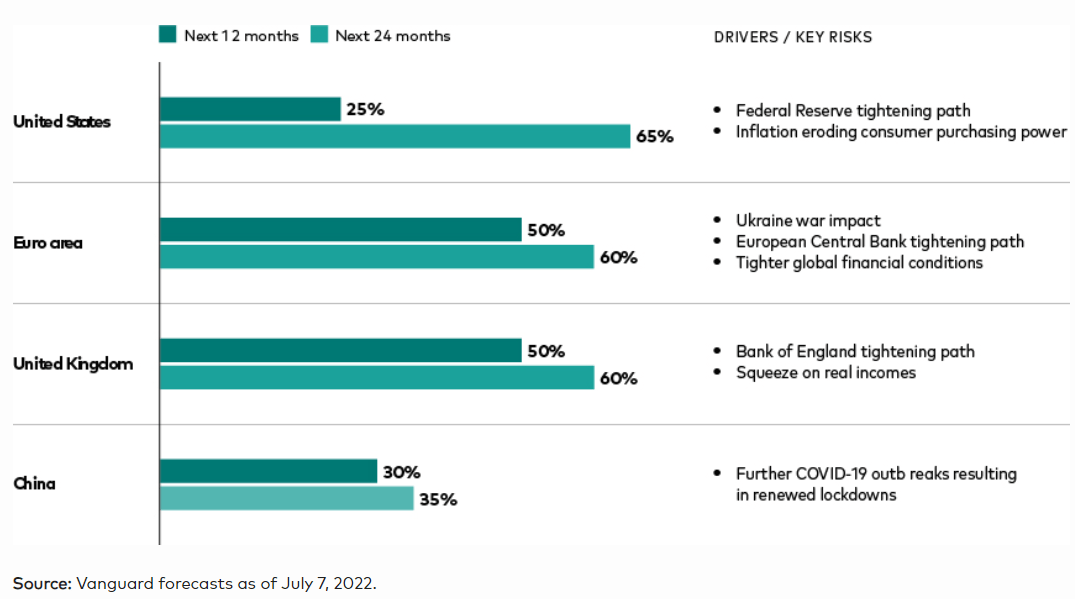
Probability of recession for select regions (Vanguard)
Increased oil demand for energy in the EU is likely only temporary
Earlier in August 2022, the IEA increased its demand forecast (380,000) for 2022 to 99.7m average barrels per day. The crux of this upwards forecast revision was the “exceptional demand” for heating and power generation through burning oil products in the European Union (EU).
The reason for the EU’s sudden switch to oil boils down entirely to the Russian invasion of Ukraine. Due to the continued tense relationship between the EU and Russia following the block’s backing of Ukraine, there is a serious concern among the member countries that Russia will tighten the taps on gas during the winter.
Truthfully, it’s anybody’s guess if this will occur, but it is important to note that Russia is undergoing an ever-increasing cash crunch that is becoming catastrophic. Selling gas to the EU is still a key source of income for the country. Still, it is a distinct possibility Russia will tighten the taps, and the demand increase will last for the winter.
However, there is a wildcard in play: the U.S. Over the last few years, the U.S. has been building up the infrastructure to export liquefied natural gas (LNG), which since the fracking revolution has been among the cheapest in the world. In the first four months of 2022, the EU took the place of Asia as the primary destination for U.S. LNG to the tune of 75% of all shipments. President Biden has vowed to increase exports. While it has not made a significant dent at this time, it’s possible it will over the next 12 months, reducing the IEA’s forecast of increased oil demand for heating and power.
The Iran deal is likely to close
One under-the-radar piece of news can upend the oil market. That story is the strong likelihood that Iranian oil production will be released back into the global economy. That’s 3.8m barrels per day within approximately two months and the potential for as much as 5.8m. For comparison, the IEA is currently forecasting demand to rise by 2.1m barrels of oil per day for 2022.
How? Well, first, we need to go over who’s running the negotiations, and I mean that in the literal sense. The organization in the middle is the EU, whose representatives have been running back and forth between the U.S. and Iranian delegations. Over the recent talks, two of the key stumbling blocks seem to have been solved: the Islamic Revolutionary Guard Corps (IRGC) and the International Atomic Energy Agency (IAEA) investigation.
The IRGC is one of Iran’s key political, military, and economic blocks, and in 2018 Former President Trump designated them a foreign terrorist organization. President Biden has made it clear that he agrees with this move and will stand firm in his resolve to keep the designation. A compromise has been reached through the negotiations, which reports (Politico, Aljazeera, Euractiv) indicate is likely amendable to all sides.
The other main sticking point in previous negotiations has been the IAEA investigation into several Iranian nuclear sites. Iran has long demanded the investigation be closed before they agree to any new deal. While there is no hard evidence of a compromise on this issue, most sources are reporting an understanding has been reached which resolves this.
True, there is no certainty a deal will be signed, but another one is closer than ever. Once again, another risk the oil market has chosen to ignore, although it is essential to note that a signed deal would likely take a few months to go into effect.
Russian oil is still flowing
One of the catalysts for oil’s first half of 2022 rally was the sanctions against Russia, one of the world’s largest producers. In March, the IEA went so far as to say that “three million barrels per day of Russian oil output is at risk as sanctions weigh and buyers shun the nation’s exports.” Despite the significant publicity this garnered at the time, to say the IEA was wrong would be an understatement. In July, the IEA was forced to admit that production was only 3% lower than before sanctions.
Why? Russia has been selling oil hand over fist to China and India after both countries developed new markets to allow for transactions outside of Western banking methods. The truth is this development is far from surprising, as multiple reports are circulating that Russia is offering discounts between 30% and $30 off oil’s spot price.
Conclusion
In conclusion, not only is there a lack of a fundamental basis for oil’s price right now when we look at both long-term prospects and more recent historical data, there are several considerable risks on both the supply and demand side. After all the evidence and analysis I have shown, I believe you will now be able to understand why my short-medium term base case for the price of oil is $70, and the best case (from a short perspective) is between $50 and $60. If you would like to dive deeper into my research, please find my excel documents below.
Be the first to comment