

chameleonseye/iStock via Getty Images
The King’s power over the currency, and the proliferation of debasement on the continent created the perfect opportunity for the king to profit from debasing the coinage. Thus Henry’s weakness manifested itself in what is often viewed as one of the largest debasements in history.
In concept a coin is a piece of gold or silver, the weight and fineness of which is guaranteed by the ruler by whose authority it was issued. Rulers, including Henry VIII, could and did cheat.
The debasement of the coins caused a lack of general acceptance of the new currency, and hoarding and illegal coinage of the old more pure substance. These factors combined to lower the quantity of coinage coming into the mint to be recoined. This in turn dictated a greater magnitude of debasement in order for the mint to reap the same profits from the recoinages. The result was the production of coins with increased proportions of alloy and decreased acceptance. The coins had such a high proportion of alloy in them near the end of this period, that they began to turn red from the amount of copper in them.
The Great Debasement of Henry VIII and Edward VI by Catherine Downey
Inflation is no enigma. Inflation touches every price across the economy and there simply is only one phenomenon which can cause that, the money creation process. It works like this. One unit of money is equal to one product. Add another unit of money and the price of the product must move to two units of money. The price is “inflated” due to the creation of one more unit of money, in this example it’s a 100% inflation rate.
I have previously explained how, from a larger economy perspective, money creation can be absorbed in an economy without causing inflation through the mechanism of economy wide productivity growth and innovation. It is, however, not a benign process as the value of that productivity growth and innovation is swept from the economy by the money creation and redistributed by the money creator in accordance with its mandate, which normally would be to first fund itself and hand the “profit” on money creation to the government. Rulers always monopolize money creation and will not tolerate any competing currencies. But what about crypto, you may ask, well, crypto currencies are not self-standing currencies, you buy them with dollars and you again sell them for dollars. All national currencies are effectively backed by the national economy while crypto currencies are just derivatives, hence tolerated.
No discussion on inflation can make any sense without understanding the origin and purpose of inflation. The origin of inflation is always money creation, and its purpose is always the profit of the ruler. It’s also always a process which ends in the eventual destruction of the currency. It matters not whether the money is coin, paper, or digital. The “mint” of monarchies became the central banks of today.
The Roman Empire destroyed a number of currencies. First the denarius.
The basic silver coin of the Roman Empire was the denarius. By decree of Caesar Augustus in 15 b.c.e, It was nearly pure silver, 95-98%, and had a fixed weight and value in relationship to the rest of the Roman monetary system. Over the next 270 years, the silver content of the denarius declined gradually and then precipitously to about 2%.
The decline and fall of the roman denarius by Alan W. Pense
Then came the antoninianii, both supposedly silver coins. The “silver” coin eventually became a silver-plated coin with such a thin layer of silver cover that it rubbed off soon after going into circulation.
Denarii and antoninianii contained less and less silver. The fact that citizens hardly saved contemporary coins anymore attests to their increasing unease. They only saved the old denarii with a high silver content.
Even the state mistrusted its own silver currency, which did not contain any silver anymore. The administration insisted on taxes and duties being paid in gold or in kind. Who would still want to burden themselves with all these redundant antoninianii? Only, those who received their payment from the state did not have another choice. They spent this unpopular money as quickly as possible. And thus the prices increased.
The Fall of the Roman denarius, Money Museum.
The most important money in the world is the US dollar and it has suffered two major inflationary events in recent times. In 2008 with the Global Economic Crisis, and in 2020 with the COVID pandemic but is also, just like the money of Henry VIII and the Roman denarius, inflated constantly irrespective of major inflationary events. Money inflation never goes away unless the money creation is reversed, which never happens. QT for instance does not reduce the inflation it just moves assets off the balance sheet of the Federal Reserve Bank (the “Fed”). Temporary reductions in money supply do not alter or reverse the long-term money creation process. The best we can hope for is that money creation would slow after periods of excessive indulgence.
Inflating currency in a modern economy is carefully planned and managed to control the emergence of price inflation or even hide it with direct price controls, market manipulations, and government bully tactics or subsidies, if required. We have observed all of these techniques in play recently with the bullying of particularly oil producers, windfall taxes, price caps, energy subsidies, even releases from the US Strategic Petroleum Reserve to manipulate oil prices. All meant to “manage” runaway inflation.
The profitability of inflation drops when inflation explodes and when inflation becomes too obvious. Profitability of inflation is highest when it percolates slowly into the economy as per the Fed’s mandate of limiting inflation to 2% per annum.
Inflation is never defeated and is always in ambush. Like I said, the best we can hope for is that it reverts to being a 2% burden rather than a 10% (or worse) burden. Are we there yet? Most likely not, for the best ambush position for inflation is in the “base effect“.
What is the “base effect”? Inflation can rise high and fast when the inflation base is low, say 2%. The inflation rate (of change) will diminish simply because the base against which it is measured has increased. Note that the inflation harm or monetary value has not diminished, the measured rate of change is the only difference which then creates the perfect camouflage for the next round of inflation in ambush. The inflation rate falls back due mostly to the base effect and the process reverses when the base reverts to a lower inflation rate. Inflation then returns for another cycle. There is no predetermined path for this process but it can be observed in the late 1960’s and 1970’s (see historic chart further down) which eventually ended in the inflation peak of early 1980 and interest rates of 20% or more across the globe because it was often thought that inflation was beaten when it had only been hiding in ambush.
Inflation only reverted back to the 2% level after a very prolonged period of high real interest rates (interest rates higher than the inflation rate). I’ll return to this theme of real interest rates historically but for now will turn to the more recent economic crises of 2008 and 2020.
The same inflation cycles phenomenon can be observed in the events leading up to the 2008 Global Economic Crisis.
Lessons from the 2008 Global Economic Crisis and events leading up to it.
The Greenspan Fed became very adept at channeling its money creation into asset inflation during the early 2000’s. It’s a very profitable inflation tactic for as long as the inflation is contained in assets and do not spill over into goods inflation, services inflation, or labor inflation. People generally loved the asset inflations even when they hated goods inflation. Using residential properties as an ATM to withdraw “capital appreciation” (asset inflation) for spending was a particularly nasty ill of the asset inflation policy and it blew up spectacularly, reversing capital appreciation to negative equity. All worked very well until 2004 when inflation started spilling into goods inflation while the asset inflations morphed (as can be expected) into unsustainable asset bubbles.
The advent of goods inflation is almost always heralded by crude oil prices as the harbinger of goods inflation. Create more and more dollars and one have to pay more and more dollars for oil.
Sarel Oberholster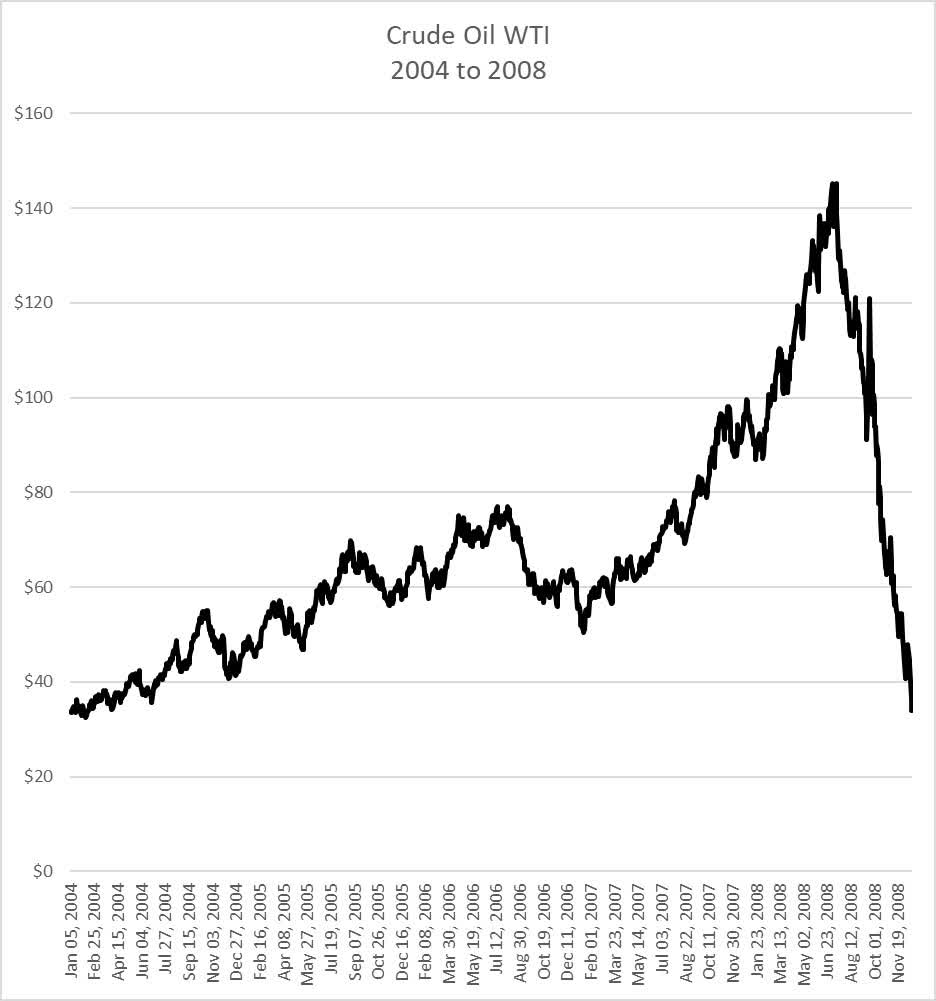
Data obtained from Investing.com
Crude oil WTI (West Texas Intermediate) enters 2004 at just above $30, inflates to just short of $80, drops back to around $50 and then explodes for a 2nd round up from $50 to peak just short of $150. It then crashed with everything else in 2008 back to end just above $30, about right back to the 2004 level.
Inflation (consumer price inflation or “CPI”) emerges in early 2004, push up to about 3.5% into early 2005 and drop back to 2.5% (base effect), push up in a 2nd cycle to almost 5% by late 2005 and drop again back to well within the 2% target rate by late 2006, just to push back up for a 3rd cycle to almost 6% by mid-2008. Inflation crashed with everything else back to nothing during the Global Economic Crisis.
Sarel Oberholster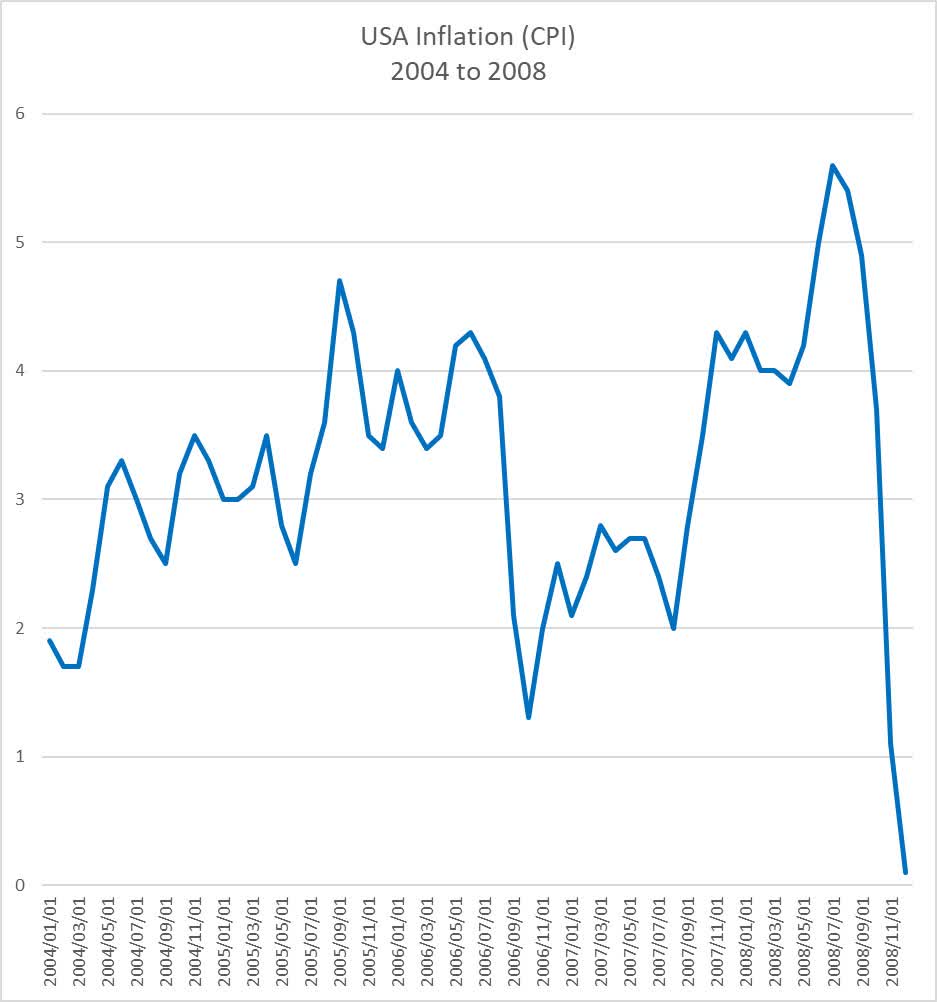
Data obtained from St Louis Fed Consumer Price Index: Total All Items for the United States.
Observe how the crude oil price did decline during the 2nd half of 2006 though not nearly as dramatically as did the inflation rate with the help of base effect. The crude oil price was a better predictor of inflation than the inflation rate.
The Fed responded with interest rate increases when inflation emerged and the guidance of a history of real interest rates to combat inflation was followed by the Greenspan Fed.
Sarel Oberholster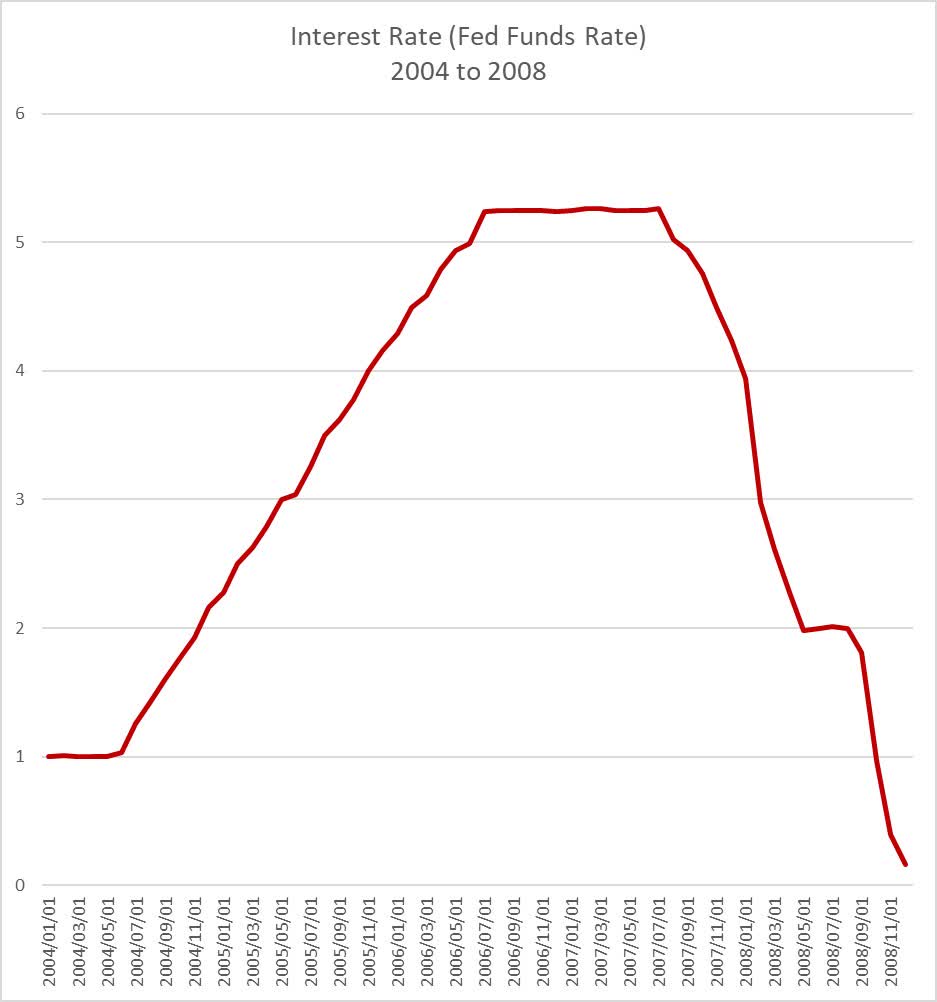
Data obtained from St Louis Fed Federal Funds Effective Rate
The Fed interest rate followed the inflation rate up as soon as inflation emerged, no transitory arguments, no delays, and moved it above the inflation rate to a real interest rate. That rate was kept in place until the development of the sub-prime crisis. It was simply the bubble in the real estate market bursting which released a wave of bad debts into the banking sector which in turn triggered a financial systemic event. Then the interest rates were cut to almost zero and bazooka class money creation and inflation were pumped into the markets. The rulers never lose in this game of boom-and-bust inflation but everybody else do. We will return often to this causality between inflation hiding in ambush, interest rate increases, bad debts and a financial markets systemic event.
We can now combine all three on one chart to see the relative relationships and timing between these mega macro-economic variables. Copper is playing an increasingly important role in the global economy and though I have not done an isolated chart on copper will add the copper price to the big picture chart. Rates read off the right-hand secondary axis and prices read off the left primary axis.
Sarel Oberholster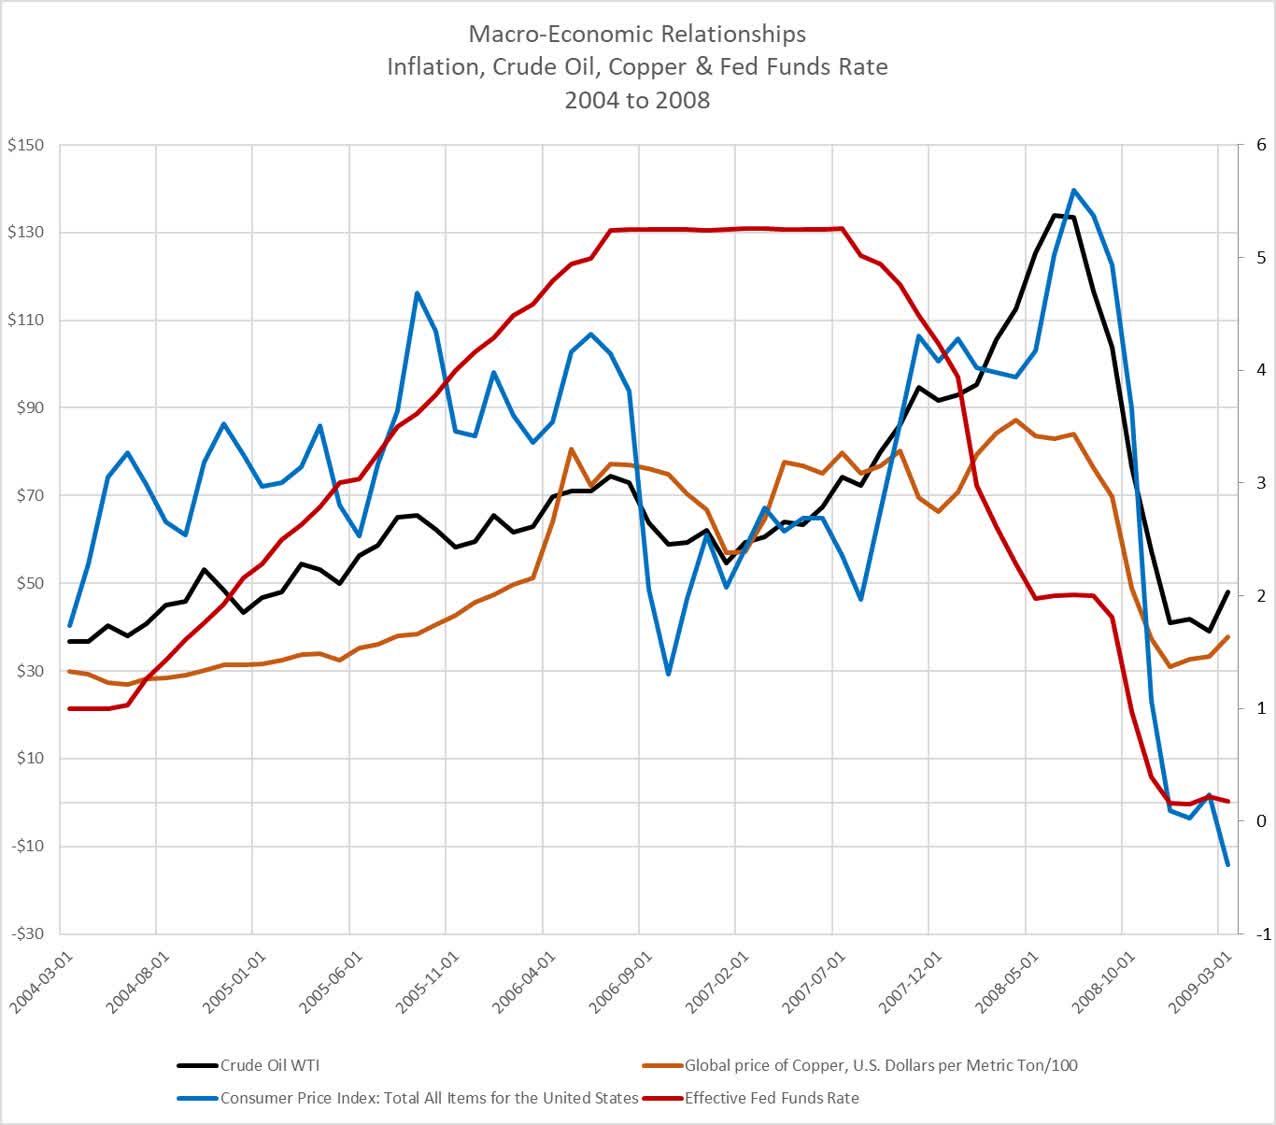
Data obtained, other than copper, as referenced above.
It is very important to place on record that interest rates were not reduced due to declining inflation or declining commodity prices or even declining share prices. Interest rates were reduced to avoid a looming systemic crisis when the residential property market switched from inflated capital appreciation to negative equity and popped the property bubble. A process, which started emerging in mid-2007, exposed mortgage securities which were under water. The bad debts, however, could not be repaired and on 15 September 2008, Lehman Brothers collapsed which triggered the systemic event.
The history of 2004 to 2008 is one of targeted creation of money channeled into asset inflations and particularly into residential property, which exploded into a systemic bad debt event.
Similarities in the 2020 COVID pandemic crisis and its aftermath.
The Fed’s playbook in response to the 2020 COVID pandemic was informed by the bazooka class inflation and money creation deployed in 2008, to introduce another major inflation within a relatively short period from the previous major inflationary event.
Crude oil markets collapsed with the advent of the COVID pandemic but by May 2020 had stabilized at around $30. The oil price increased from that $30 level in May 2020 to peak at around $125 in June 2022. Most of the advance in the oil price had taken place prior to the Ukrainian war. Pres Biden announced on 31 March 2022 that the USA will release 1mil barrels of oil from the Strategic Petroleum Reserve (“SPR”) for 6 months “to help cut gas prices and fight inflation across the country”. The oil price pulled back to around the $80 level by October 2022, bounced off the $70 levels, but has become sticky around that $80 level and has reverted to an upwards trend. The SPR withdrawals have ended and the SPR will now be replenished. The oil price moves from May 2020 to Jan 2023 looks very similar to the move from Jan 2004 to Feb 2006 which was just a down lull before the next up leg.
Sarel Oberholster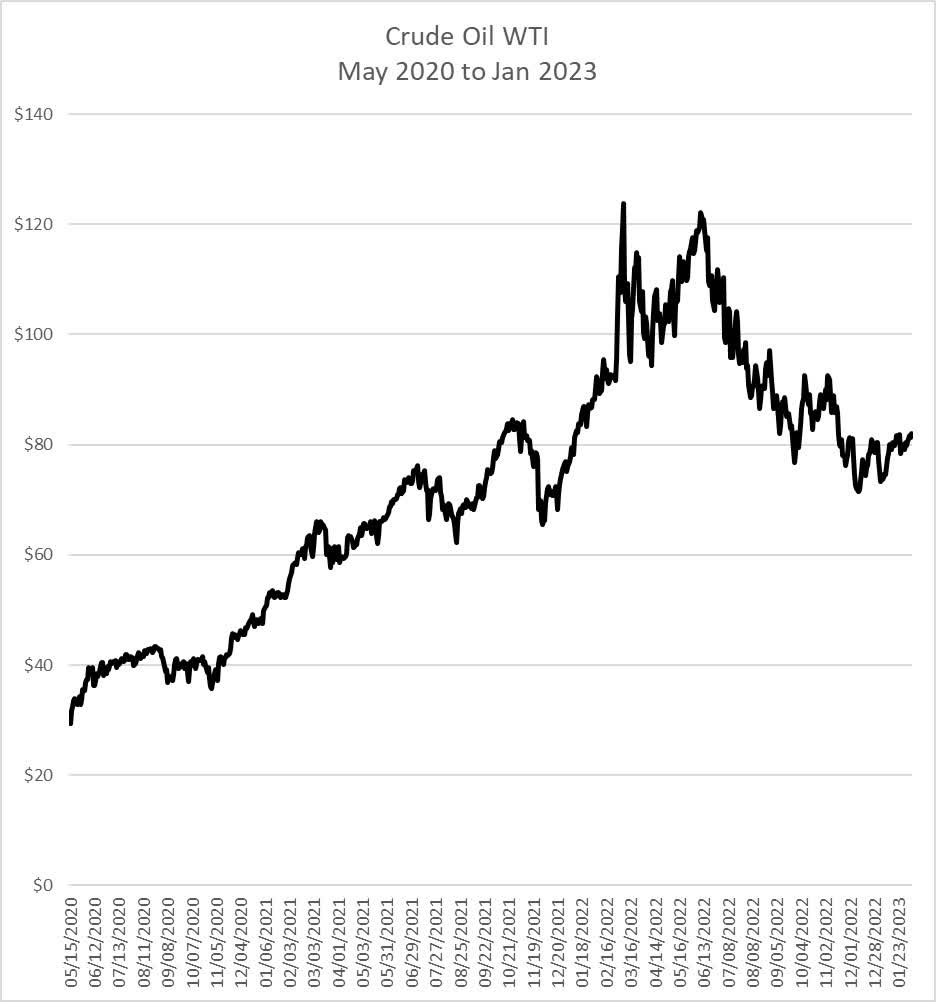
Data obtained from Investing.com.
Inflation emerged soon after May 2020 in very similar fashion to the oil price increases but accelerated well before further oil price increases with inflation leading the oil price increases, both peaking in June 2022. Inflation will now follow the 2006 example and decline significantly due to the base effect. It will hide in ambush to re-emerge in a similar manner if goods inflation as represented by oil and copper does not play along. Then there still is labor inflation which, due to a cost-of-living crisis and historically low unemployment, will probably start exerting upwards pressure on the inflation rate particularly as salary increases are usually effective from the beginning of the new year. Services inflation has not yet contributed to the drop in CPI which drop right now is almost entirely due to the decline in the oil price into December 2022.
Sarel Oberholster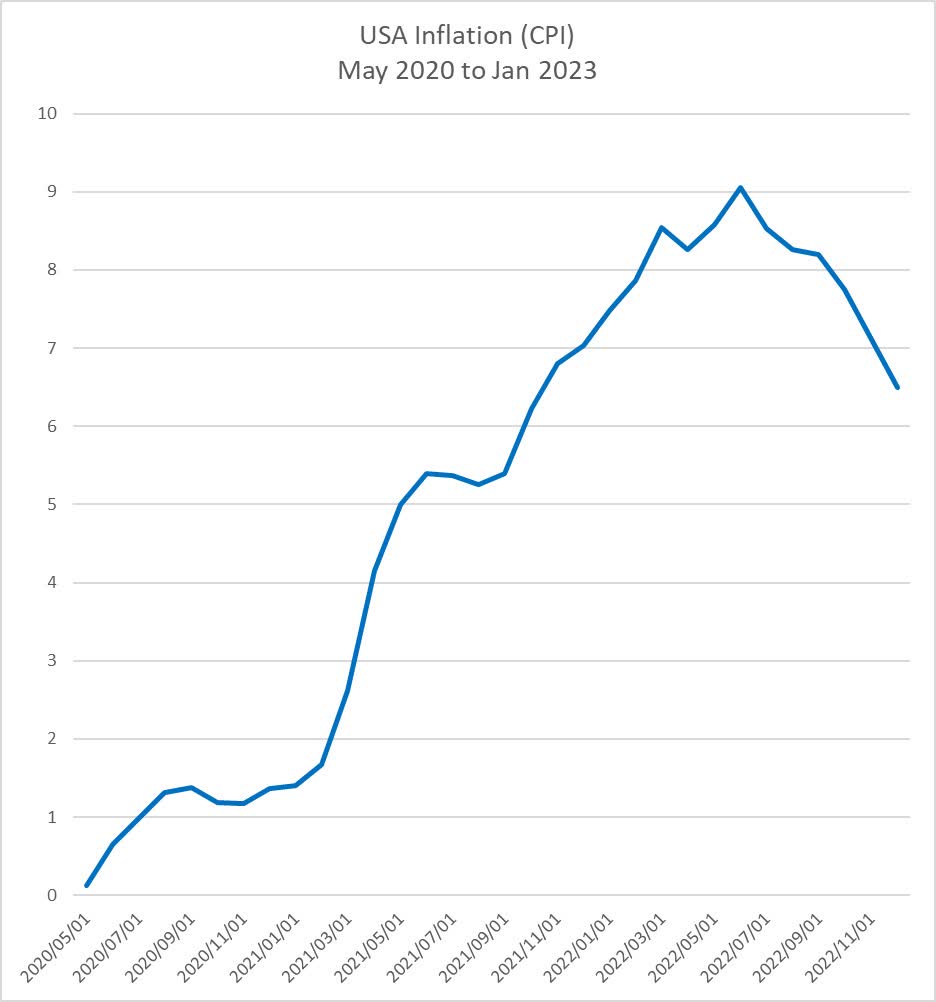
Data obtained from St Louis Fed Consumer Price Index: Total All Items for the United States.
We can complete the direct comparison with the interest rate chart.
Sarel Oberholster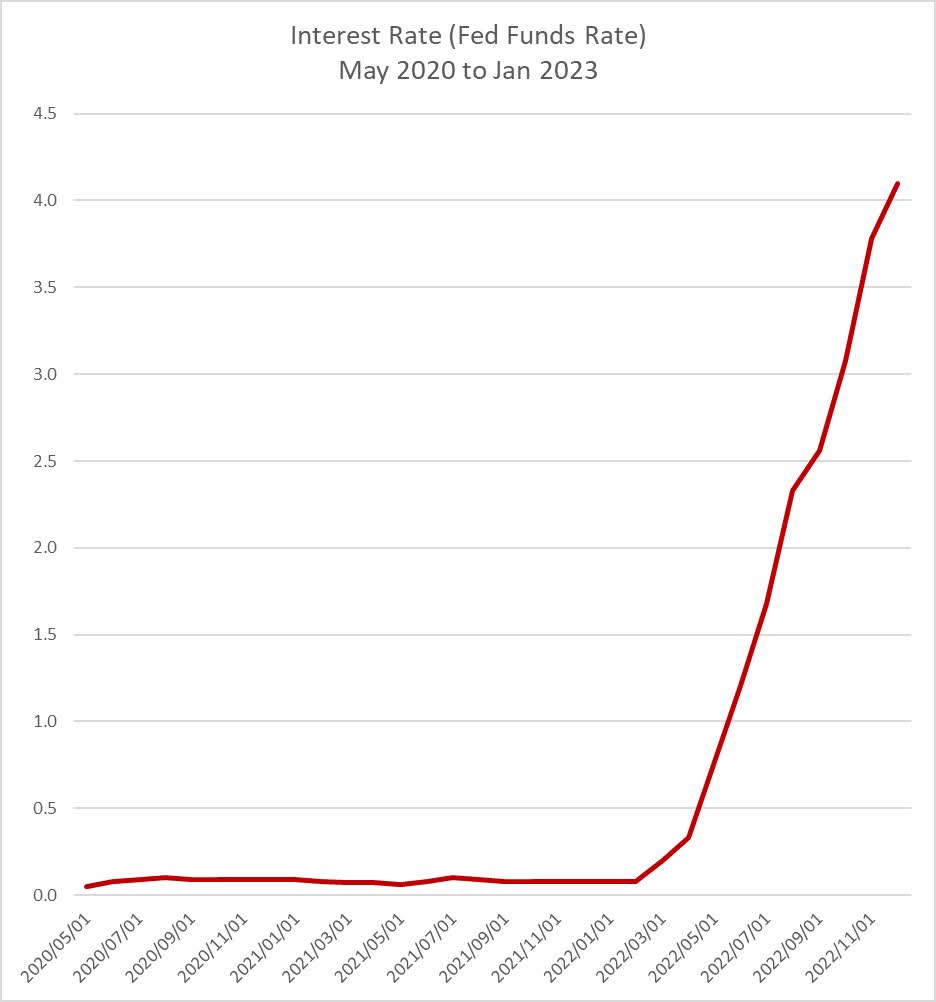
Data obtained from St Louis Fed Federal Funds Effective Rate
It is on interest rates that the big difference between 2008 and 2023 emerges. The very delayed reaction of the Fed in dealing with the inflation and the fact that interest rates are still not even close to being above inflation are definitive. The reality is that this level of interest rates is dovish and accommodative and certainly not neutral or restrictive.
This observation becomes even more prominent once we combine all the variables in charts from 2008 to Jan 2023 for comparison.
Sarel Oberholster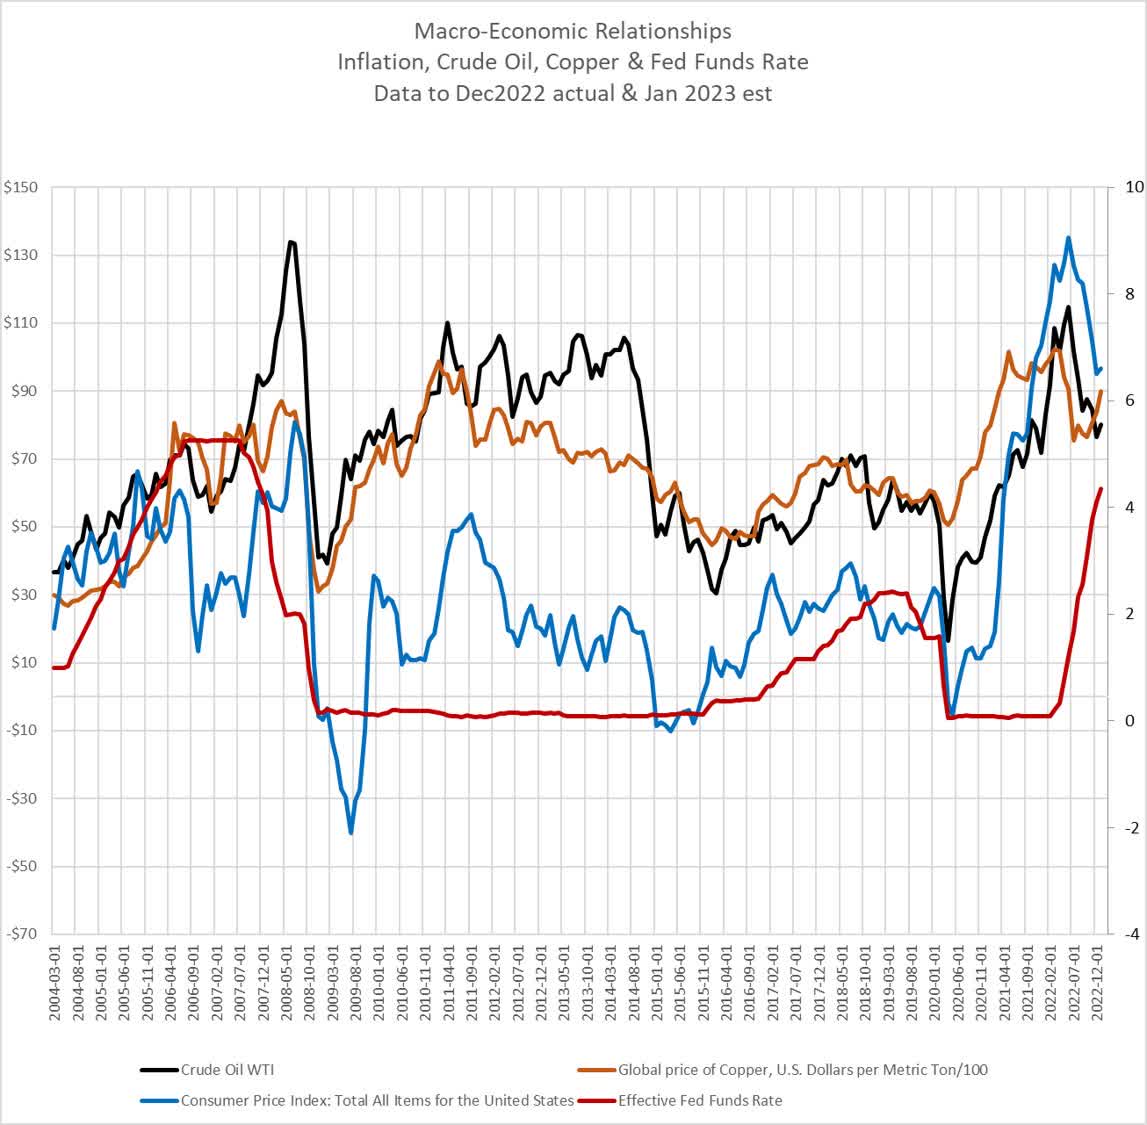
Data obtained, other than copper, as referenced above.
The very accommodative stance of monetary policy is transparently obvious from the combination of the macro-economic variables. It is also very obvious that inflation remains in ambush with a high risk of a next up cycle developing especially given the relatively mild and significantly delayed response of the Fed on interest rates. The inflation levels have already developed beyond where it is tenable to most households and a global cost-of-living crisis is well advanced. Room to maneuver on inflation is very limited and a second wave of inflation cannot be passed on to households inside an already existing cost-of-living crisis. Simplified, inflation confiscates disposable income from households, thus leaving them short on covering cost-of-living expenses.
The history of real interest rates taken back to 1954 is clear, this level of interest rate response from the Fed is most likely going to result in the reemergence of further cycles of inflation. It is also clear that the inflation problem is significantly greater than is generally realized.
Sarel Oberholster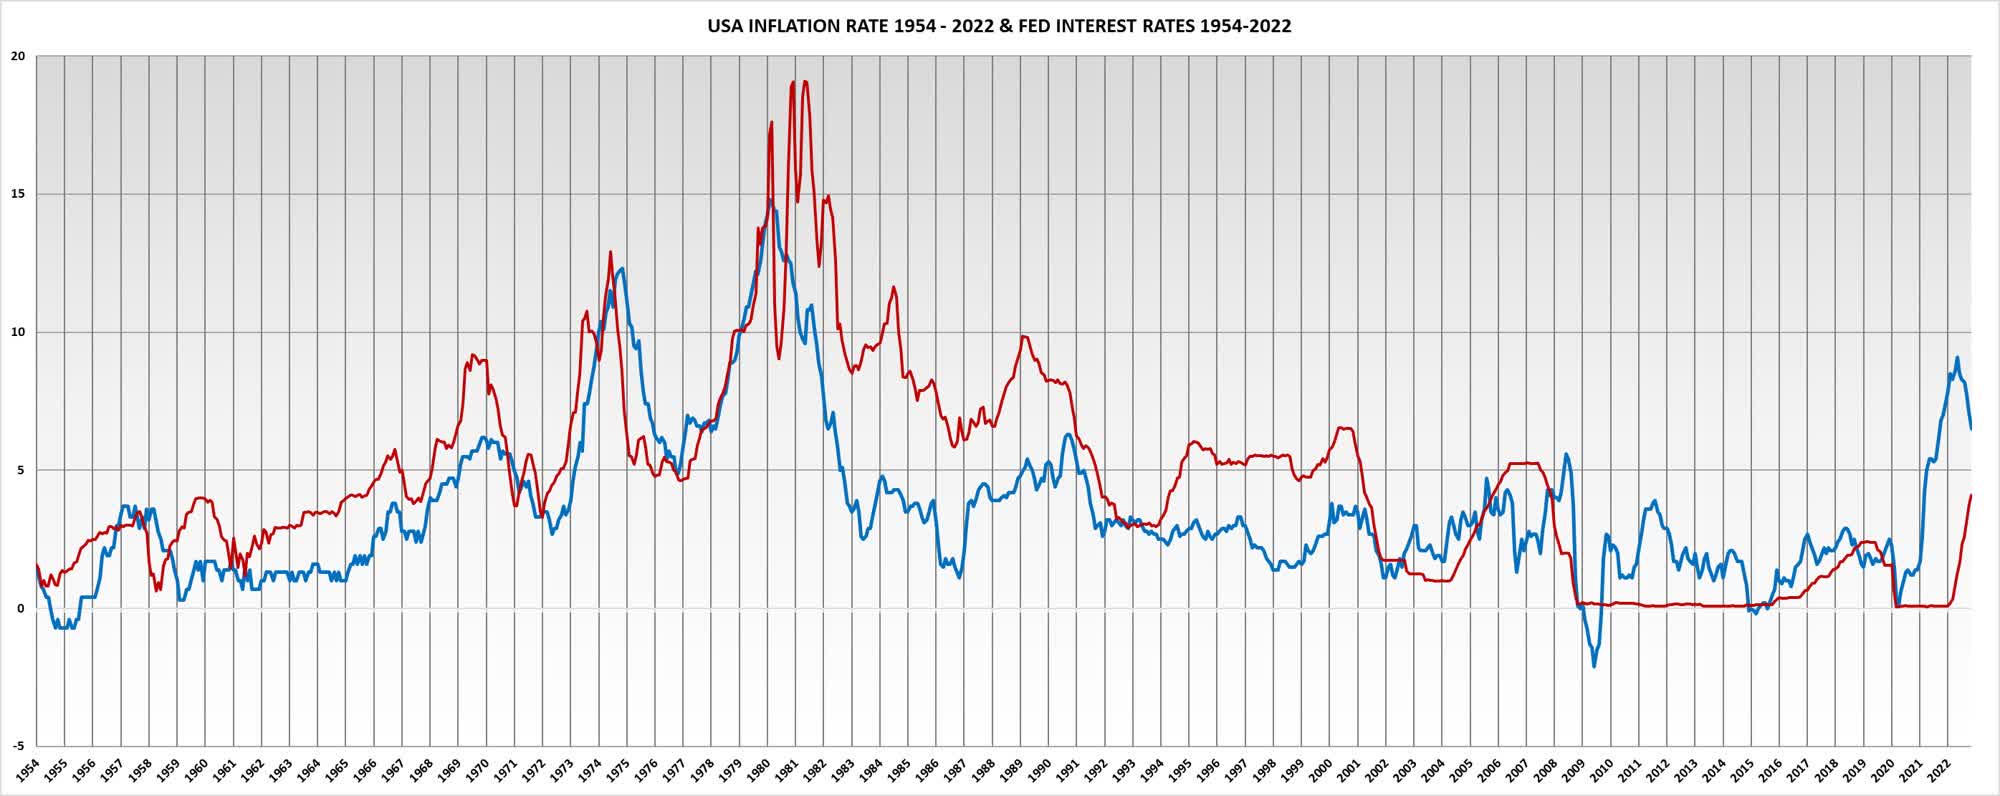
Data obtained from St Louis Fed Federal Funds Effective Rate and Consumer Price Index: Total All Items for the United States.
Inflation just kept coming back from the late 1950’s despite mild, sometimes even high, real interest rates, easily spiraling higher in each cycle until interest rates were pushed to a peak of 20% in June 1981. It was kept at high real interest rate levels for most of the next 20 years. Inflation is not a here-today-gone-tomorrow type of problem and addressing the current inflation problem has not even reached real interest rate levels. 20 years of mild real interest rates could not contain the inflation spiral into 1980 and it eventually took the determination of a Paul Volcker and very high real interest rates to tame that inflation.
It’s always the bad debts which crash the system
Systemic crises in financial markets can almost always be traced back to a bad debt crisis. A bad debt crisis can remain in a debt sickbay for years while interest rates are low and then crash the system as soon as interest rates increase sufficiently. We saw that happen in 2008 at an interest rate level of just over 5% crushing sub-prime mortgage securities, but even 3% was enough in 2019 to see the Fed back-off.
The bad debt event will usually emerge from the areas in the economy where the highest concentration of unaffordable debt had congregated during the period of low interest rates. I expect the systemic financial stress to probably show up in government debt. We saw how the Asian Debt Crisis, a relatively minor crisis, developed during the 1990’s and peaked in 1997. Central Bank money creation is used to finance government debt and the profit of money creation is gifted to governments annually. Both those sources of money for government have now been impeded or removed. Governments must now turn to savings to replace those two money creation sources of liquidity. Governments must borrow its money in the markets until such time as inflation is really defeated. How easily sovereign debt risks developed into a crisis in the past, but that story will have to stand over to my next article.
The developing inflation crisis of 2006 to 2008 was dramatically resolved through a systemic bad debt financial markets event which crashed everything including inflation. Inflation dropped from 5.6% in July 2008 to -2.1% by July 2009.
It follows that general market risk (SPY) remains high while opportunity for being short, long bonds (TBF) exists.
Conclusion
The purpose of this article was to evaluate the inflation risk in January 2023 by stepping back and taking a big picture view. Financial markets today are fully conditioned and calibrated to be reactive and the gospel of “the market looks through short-term events” is mostly no longer valid. Show me the results of any company lately which just marginally deviated from an expected result, and I’ll show you how reactive the market had become. So many takedowns of 20% to 30% of top tier companies in a single trading session. The markets are a chaotic mess of volatility, overreacting to every small real or imaginary event or narrative.
The macro-economic risks of an inflationary spiral as experienced into 1980 with interest rates as high as 20% is confronted head-on with a systemic bad debt risk event fueled by the very interest rate increases required to fight off an inflation spiral. Thrust those risks into the current reactive volatile market and contemplate what can go wrong (the law of improbability or Murphey’s law says: “Anything that can go wrong will go wrong.”)?
The information on inflationary trends is mostly not suitable for short term trading. The best use of the information is to comprehend and anticipate (in need) outcomes which the market would respond to reactively while remaining very aware of the potential systemic risk. Examples would be a continued increase in crude oil and commodity prices, inflation reverting to an upwards trend or increased occurrences and reports of bad debts, especially when those bad debts start to cluster in an economically significant category. Prepare risk management strategies in advance for potential negative events and stand ready to implement them fast if any of those events materialize. Be informed, be aware and above all remain vigilant for the market risks remain excessive.
Inflation is tenacious and the cumulative extreme money creations over the past 20 years are all still available to feed into the inflation spiral while the Fed’s response to inflation is very accommodating so far. Yet, the interest rate levels are already sufficiently elevated to trigger a systemic bad debt event. Potential for a chaotic resolution is high give the opposing risks of inflation and the need to combat inflation with high interest rates which may trigger that systemic bad debt event. Potential to be deceived by inflation base effects could leave one unprepared for sudden negative events.
In the absence of the gold standard, there is no way to protect savings from confiscation through inflation. There is no safe store of value.
Alan Greenspan, Chairman of the Federal Reserve Bank, August 11, 1987 – January 31, 2006.
Be the first to comment