

Andrew Burton
Introduction
I first purchased BlackRock (NYSE:BLK) stock in my marketplace service, The Cyclical Investor’s Club, fairly early on in the March 2020 pandemic crash, on 3/09/20, and I shared and explained my thinking behind that purchase publicly a few months later in my article “Stocks I Bought On The Dip: BlackRock“. Over the past nearly three years, the stock has performed well both on an absolute and relative basis.
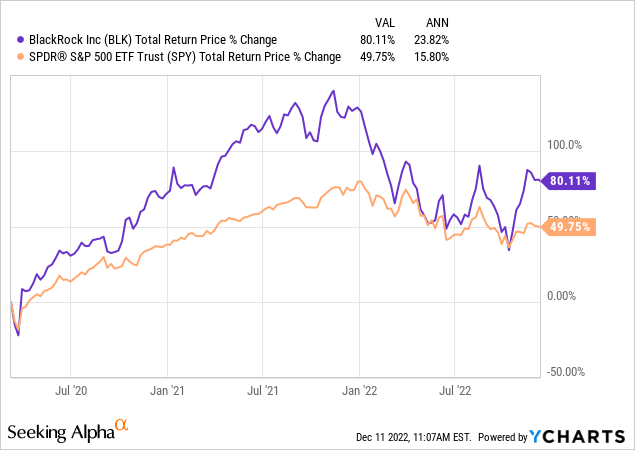
BlackRock returned about +80% for me while the S&P 500 only returned about +50% over the same time period. The annual returns on the investment were +23.82%. So, nothing to complain about in terms of performance.
The next relevant article that included BlackRock was written earlier this year on January 26th, 2022 titled “6 Financial Stocks I Recently Sold, And 2 I Will Hold For The Long Term” In that article, I highlighted the disproportionate downside that these eight financial stocks would likely experience in the coming year or two. I was very early compared to most market participants in getting defensive with stocks of this sort, and I decided to hang on to two of them in case I was wrong, or in case the market experienced a milder-than-expected downturn and these stocks bounced back quickly.
Below are the returns of these 8 financial stocks compared to the S&P 500 ETF (SPY) since the article was published.
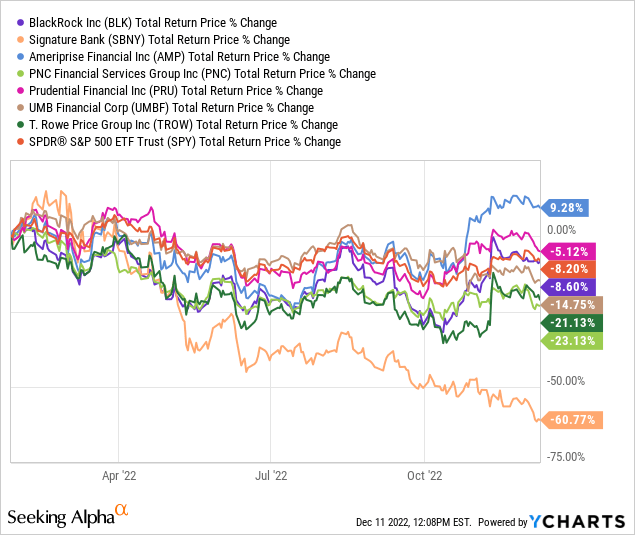
Seven out of eight of the stocks have produced negative returns. Six out of eight have underperformed the S&P 500. BlackRock and Signature Bank (SBNY) were the two I decided to hold onto despite knowing the risks. SBNY is down -60% mostly because of the business they do with the crypto industry, and it was the only crypto exposure I had (and it was mostly tangential at that). Believe it or not, my SBNY investment is still positive even after the big drop.
BlackRock, at its lowest point, was down more than -40% off its high price in 2022.
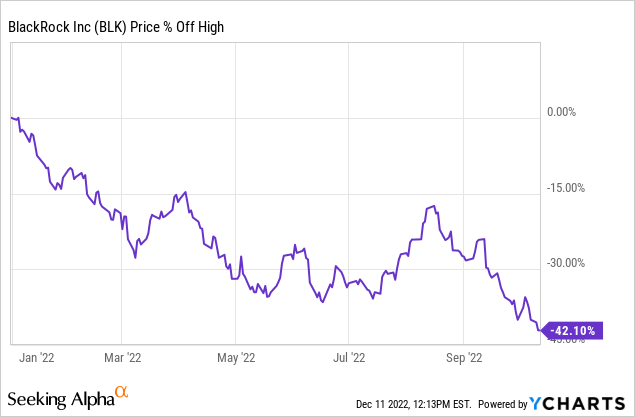
Right now, because of the recent rally, it is only down about -9% since my article was published.
The way I think about this is that my basic thesis that BlackRock stock contained excess and significant risk back in January was correct, and now the question is whether October of this year was likely to have marked the bottom for the stock.
I don’t think October was the bottom.
That means the most recent bounce the stock price has experienced might be a good opportunity to take profits in my position. A second chance, if you will, now that we have more clarity about the economy and monetary policy going into 2023.
But, I don’t want to base my decision purely on a hunch. If the valuation was cheap enough (as it is with Signature Bank right now) I would just keep holding the stock. So, I’m going to run BlackRock stock through my standard valuation process (which is the same valuation process I used to determine it was a buy in March 2020) and we’ll see what sort of potential returns I might be giving up if I sell.
My Valuation Method For BlackRock
The valuation method I use for BlackRock first checks to see how cyclical earnings have been historically. Once it is determined that earnings aren’t too cyclical, then I use a combination of earnings, earnings growth, and P/E mean reversion to estimate future returns based on previous earnings growth and sentiment patterns. I take those expectations and apply them 10 years into the future, and then convert the results into an expected CAGR percentage. If the expected return is really good, I will buy the stock, and if it’s really low, I will often sell the stock. In this article, I will take readers through each step of this process.
Importantly, once it is established that a business has a long history of relatively stable and predictable earnings growth, it doesn’t really matter to me what the business does. If it consistently makes more money over the course of each economic cycle, that’s what I care about the most.
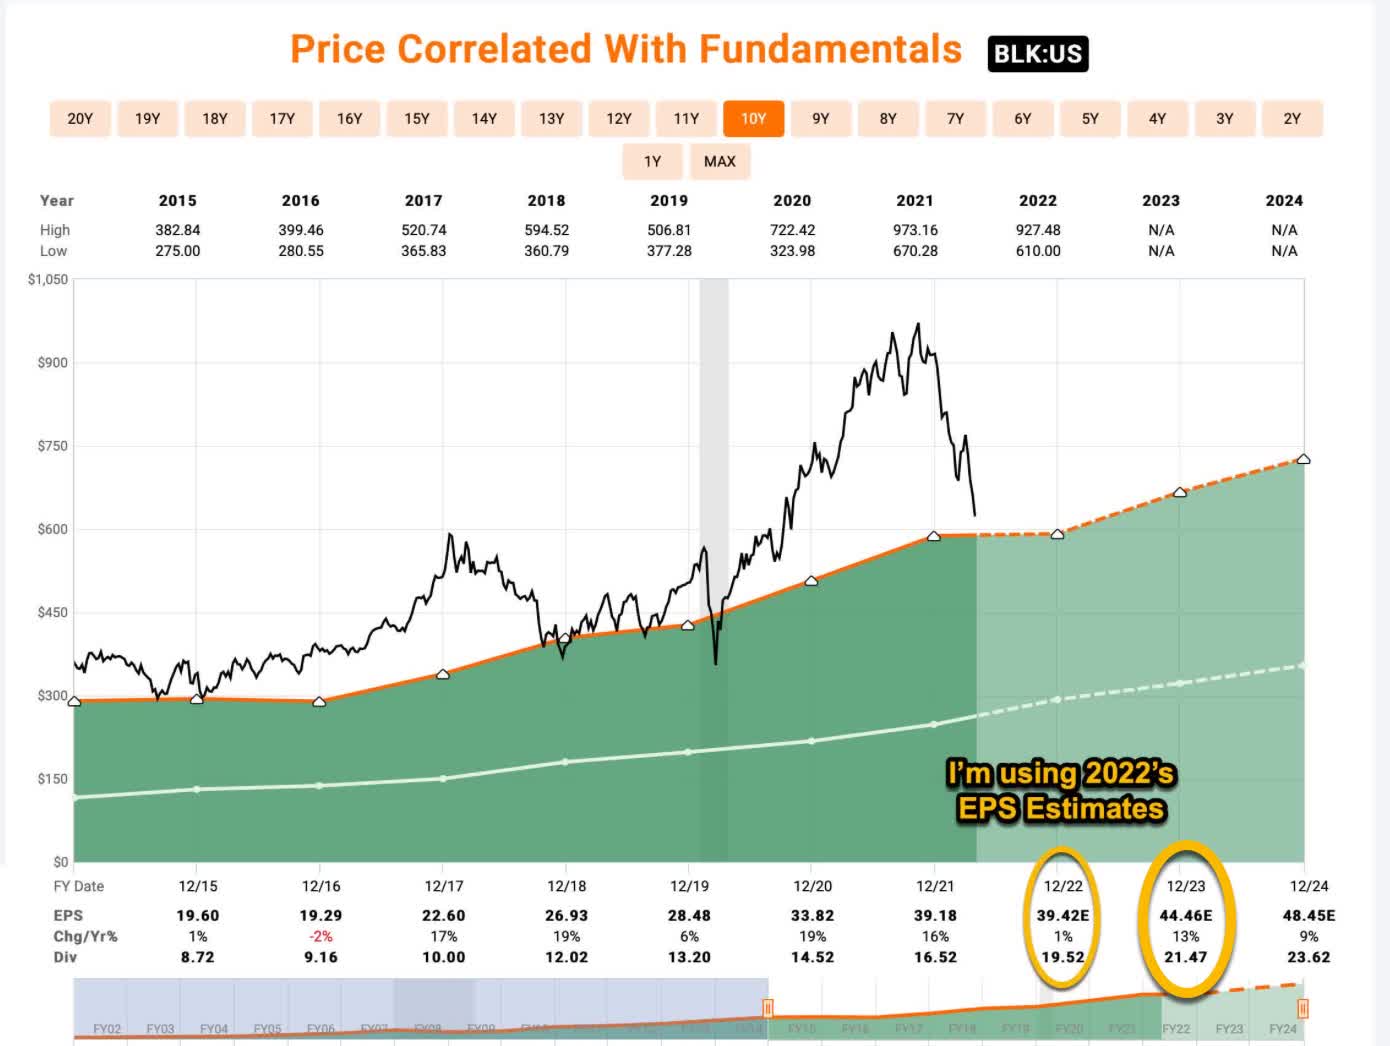
FAST Graphs
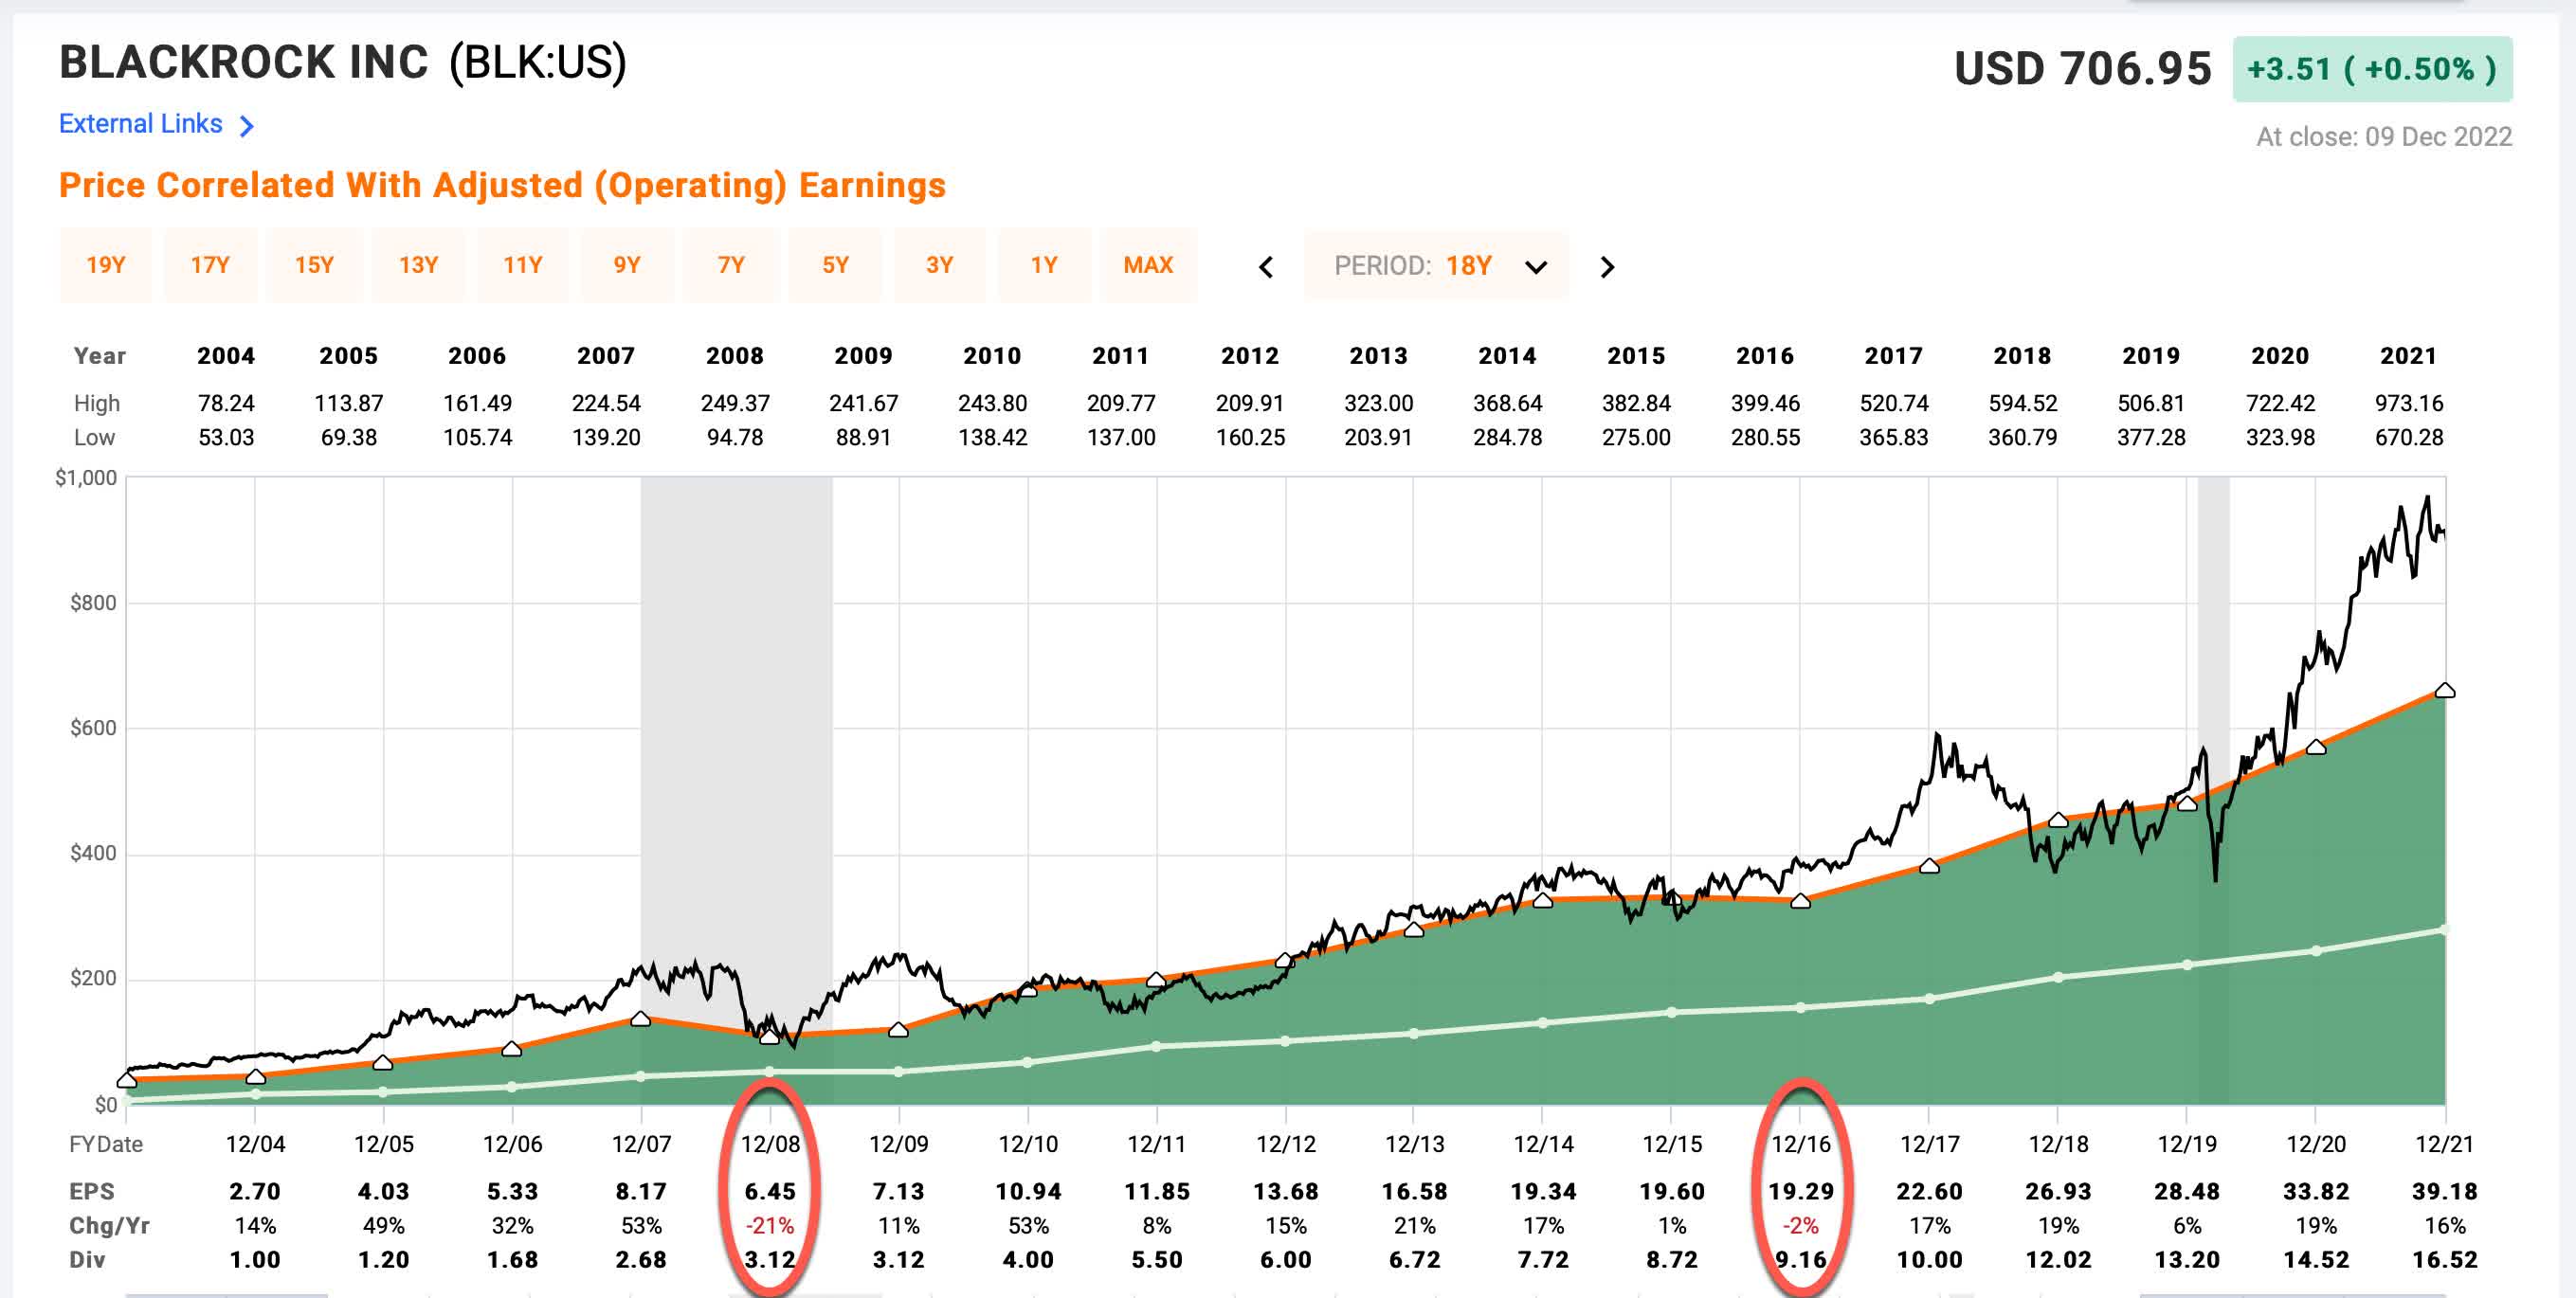
From 2004 to the end of 2021 BlackRock only experienced two years of negative EPS growth, one minor -2% year in 2016, and one moderate drawdown year in 2008 of -21%. Based on this, and the history of other peers of BlackRock, I would call their earnings moderately cyclical. For moderately cyclical businesses, it is reasonable to use earnings and earnings growth expectations to value the stock as long as one takes into account these potential down years, and that’s what I will do in this analysis.
BlackRock’s Market Sentiment Return Expectations
In order to estimate what sort of returns we might expect over the next 10 years, let’s begin by examining what return we could expect 10 years from now if the P/E multiple were to revert to its mean from the previous economic cycle. For this, I’m using a period that runs from 2015-2023. I chose this time frame because it is more recent than one that starts in 2007. Starting the time frame in 2007 has the benefit of including the 2008 recession, but BlackRock has grown significantly in market share since then so I think it makes sense to examine the most recent time frame we can. Starting in 2015 does include the flat growth years of 2015 and 2016, and it also includes expectations for 2023 which are expected to be negative along with 2022’s negative earnings growth year. So, I think this time frame is sufficiently conservative even though it doesn’t contain a major recession like 2008.
FAST Graphs
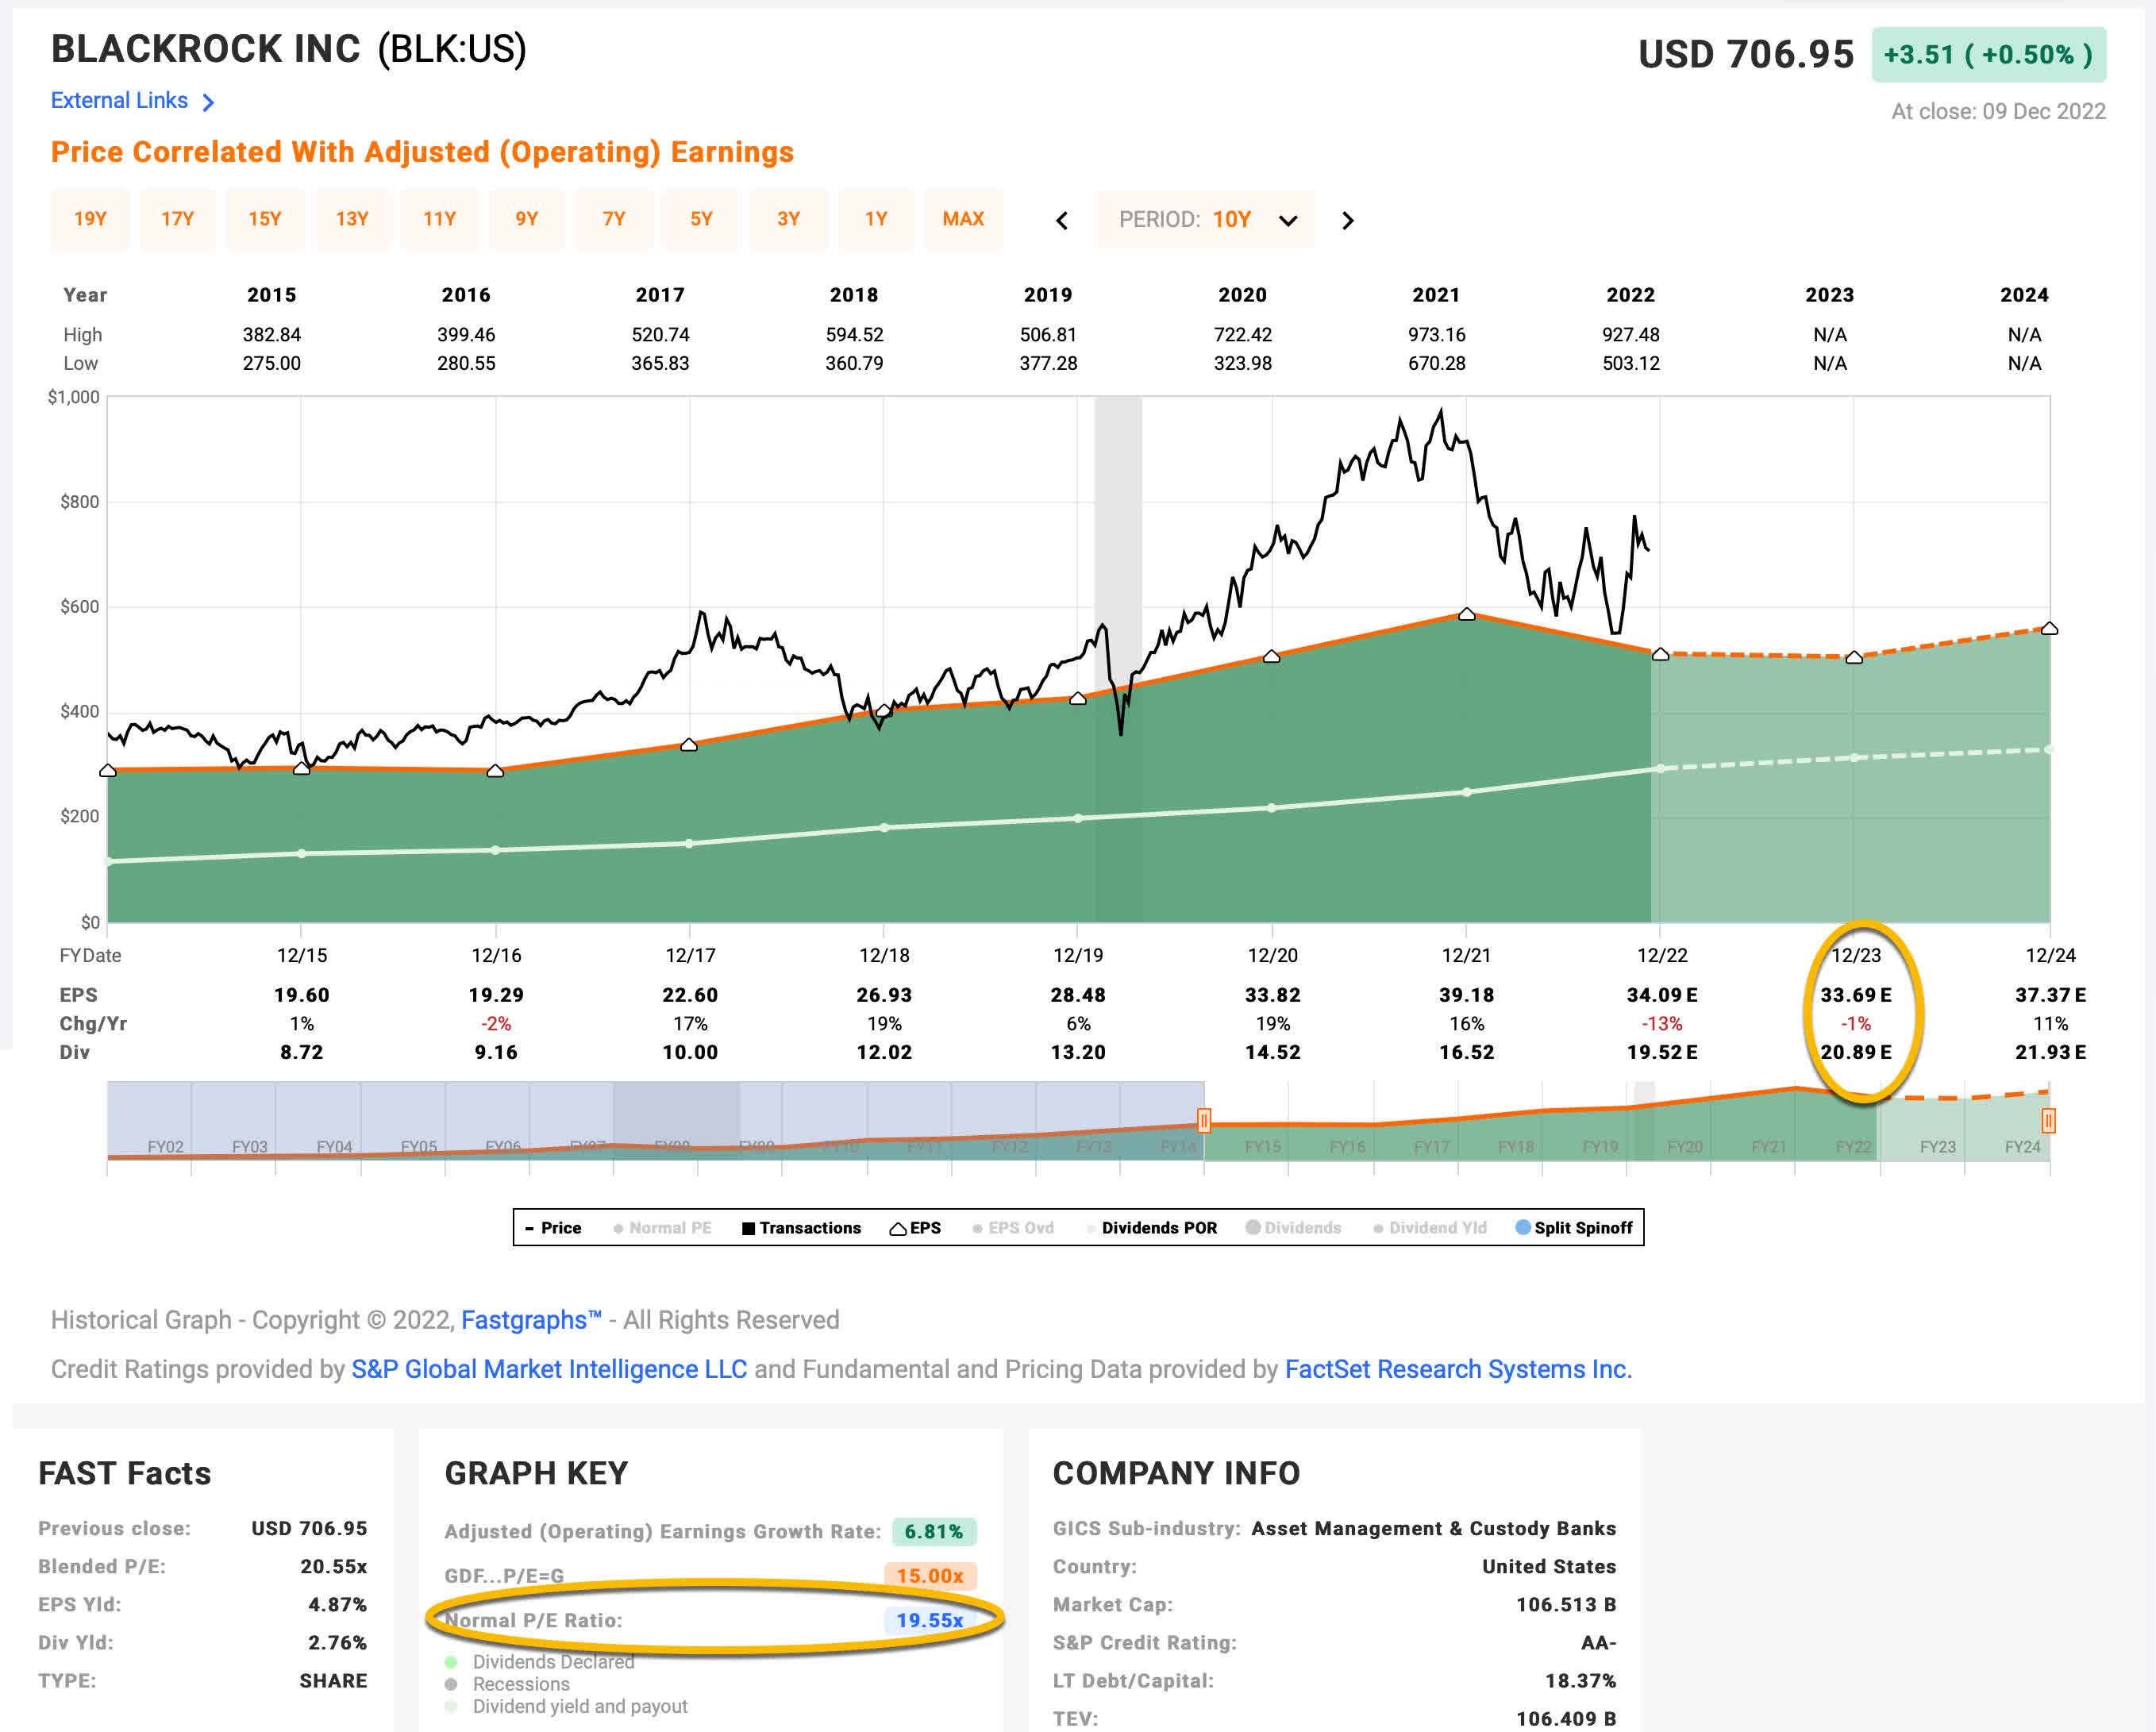
BlackRock’s average P/E from 2015 to the present has been about 19.55 (the blue number circled in gold near the bottom of the FAST Graph). Using 2023’s forward earnings estimates of $33.69, BlackRock has a current P/E of 20.98. If that 20.98 P/E were to revert to the average P/E of 19.55 over the course of the next 10 years and everything else was held the same, BlackRock’s price would fall and it would produce a 10-Year CAGR of -0.71%. That’s the annual return we can expect from sentiment mean reversion if it takes 10 years to revert. If it takes less time to revert, the annual return would be lower.
Business Earnings Expectations
We previously examined what would happen if market sentiment reverted to the mean. This is entirely determined by the mood of the market and is quite often disconnected, or only loosely connected, to the performance of the actual business. In this section, we will examine the actual earnings of the business. The goal here is simple: We want to know how much money we would earn (expressed in the form of a CAGR %) over the course of 10 years if we bought the business at today’s prices and kept all of the earnings for ourselves.
There are two main components of this: the first is the earnings yield and the second is the rate at which the earnings can be expected to grow. Let’s start with the earnings yield (which is an inverted P/E ratio, so the Earnings/Price ratio). The current earnings yield is about +4.77%. The way I like to think about this is, if I bought the company’s whole business right now for $100, I would earn $4.77 per year on my investment if earnings remained the same for the next 10 years.
The next step is to estimate the company’s earnings growth during this time period. I do that by figuring out at what rate earnings grew during the last cycle and applying that rate to the next 10 years. This involves calculating the historical EPS growth rate, taking into account each year’s EPS growth or decline, and then backing out any share buybacks that occurred over that time period (because reducing shares will increase the EPS due to fewer shares).
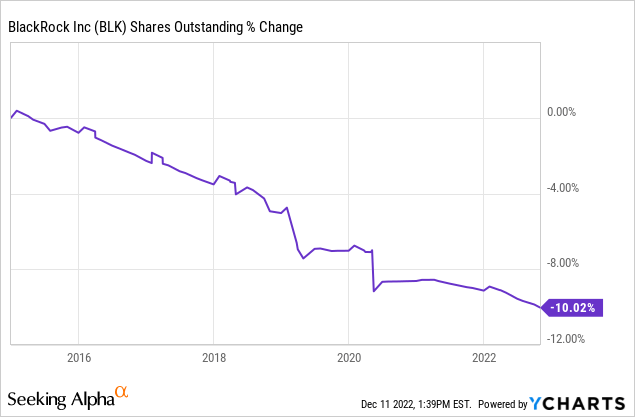
BlackRock has bought back about 10% of the shares outstanding since 2015. I will adjust for those buybacks with my earnings growth estimate and I’ll also account for that -2% decline in 2016, the -13% decline expected this year, and the -1% expected next year. After doing that, I calculate an annual earnings growth rate of about +5.07%. This is a little lower than the +6.81% growth rate FAST Graphs calculates because I am controlling for buybacks and extending my projections out through 2023.
Next, I’ll apply that growth rate to current earnings, looking forward 10 years in order to get a final 10-year CAGR estimate. The way I think about this is, if I bought BlackRock’s whole business for $100, it would pay me back $4.77 plus +5.07% growth the first year, and that amount would grow at +5.07% per year for 10 years after that. I want to know how much money I would have in total at the end of 10 years on my $100 investment, which I calculate to be about $163.19 (including the original $100). When I plug that growth into a CAGR calculator, that translates to a +5.02% 10-year CAGR estimate for the expected business earnings returns.
10-Year, Full-Cycle CAGR Estimate
Potential future returns can come from two main places: Market sentiment returns or business earnings returns. If we assume that market sentiment reverts to the mean from the last cycle over the next 10 years for BlackRock, it will produce a -0.71% CAGR. If the earnings yield and growth are similar to the last cycle, the company should produce somewhere around a +5.02% 10-year CAGR. If we put the two together, we get an expected 10-year, full-cycle CAGR of +4.31% at today’s price.
My Buy/Sell/Hold range for this category of stocks is: Above a 12% CAGR is a Buy, below a 4% expected CAGR is a Sell, and in between 4% and 12% is a Hold. This puts BlackRock’s 4.31% expectation right on the borderline of being a “Sell”. This is the point that some judgments need to be made.
Additional Considerations
Alright, to review, I bought Blackrock during the March 2020 crash, I then wrote an article in January 2022 where, despite highlighting Blackrock’s risks, I chose to hold onto it in case my bear market thesis was wrong. In May of this year I wrote a follow-up, “Here’s The Price To Consider Buying BlackRock Stock” in which I concluded BlackRock was a “Hold” at that time. (The stock has returned about 8% since then.) So, including this article, I will have written three BlackRock articles this year. I want to highlight the changes in analysts’ earnings expectations over the course of the last 11 months.
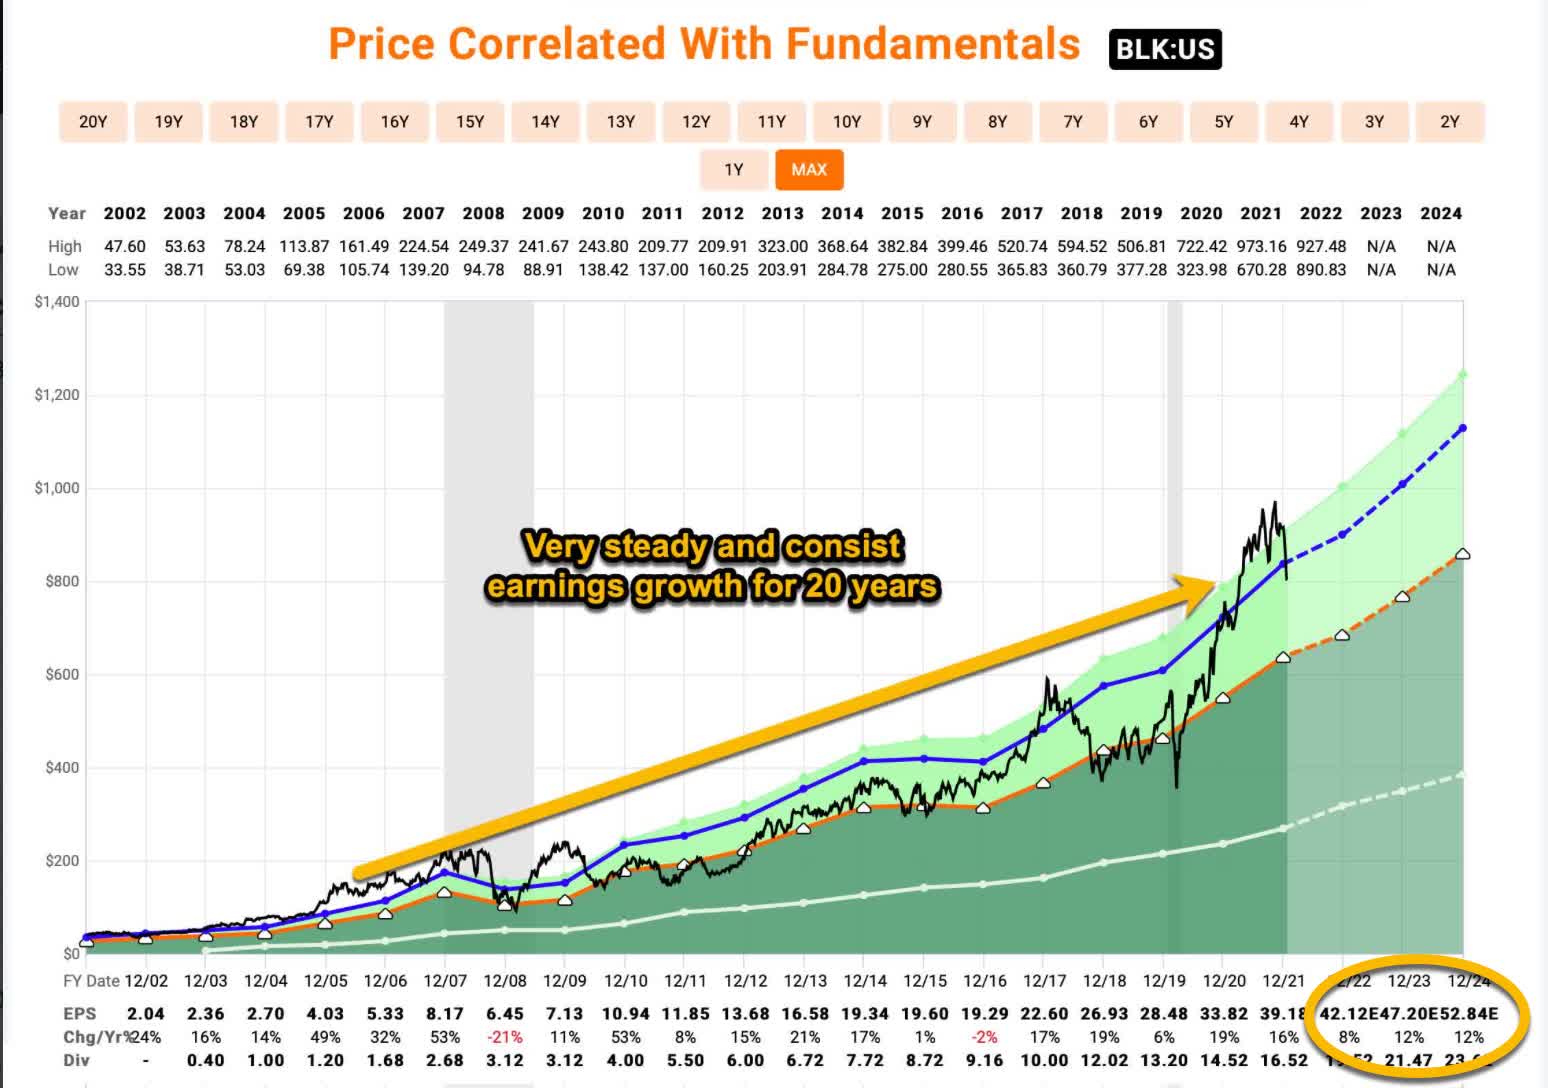
Below is a copy of a FAST Graph I shared on BLK in my January 2022 article. Notice 2022, 2023, and 2024 EPS expectations are in the bottom right-hand corner.
FAST Graphs
Eleven months ago, analysts expected $42.12 of EPS for 2022 and $47.20 for 2023.
Now let’s examine a FAST Graph I shared in my May 2022 article and what the expectations were then.
FAST Graphs
In five months’ time, analysts’ expectations fell from $42.12 to $39.42 for this year, and from $47.20 to $44.46 for 2023. And the stock price fell during those five months in a manner that was pretty much in line with the earnings expectations.
Now, as you can see in the second FAST Graph I posted in this article, analysts currently expect this years’ EPS to be $34.09, down from a $42.12 January expectation and a $39.42 May expectation. And analysts now expect 2023’s EPS to be $33.69 per share compared to a whopping $47.20 expectation in January and $44.46 expectation in May.
In this case, for investors, the 2023 estimate is probably the most relevant regarding where the stock price goes over the medium term. Analysts’ expectations for 2023 earnings have dropped almost -30% during the past 11 months. Here is how the stock has performed:
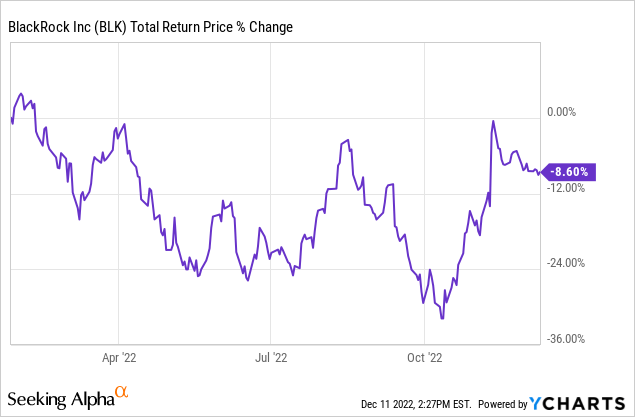
With earnings expected to drop -30% the stock price is only down -8.60% on a total return basis. (And it’s up 8% since my May article.) This is exactly the opposite of how BlackRock stock typically performs when earnings growth declines. In 2008, BlackRock’s earnings fell -21% that year. Here is how far the stock price fell off its highs:
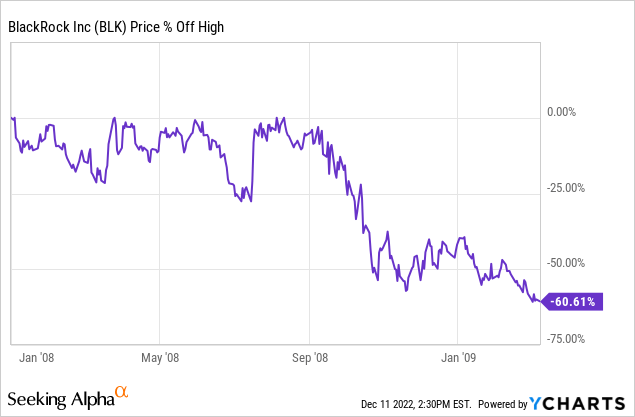
The stock price fell about 3x as far as earnings did. BlackRock had about the same P/E ratio going into the current downturn as it had going into 2008, so it wasn’t any cheaper this time around. If analysts are right about next year, there is a lot of downside risk for BlackRock stock.
Conclusion
I had originally planned to hold Blackrock through a potential downturn because I was very early in getting defensive with similar positions I held even though I knew BlackRock stock would be volatile. Now my negative market thesis is playing out as I expected, but in the past two months BlackRock stock has made an inexplicable rally, unless we avoid an economic downturn in 2023 (which I think is doubtful). The valuation for BlackRock is currently right at the borderline of being a clear “Sell”. When combined with BlackRock’s historical record of the stock price falling deeper than earnings do, I consider the recent market rally a gift, and an opportunity to take profits, which is what I have done.
I may, or may not, get the opportunity to buy this stock again. It might never fall to levels I find attractive. And that’s okay. There is always something that does. The stock has been good to me, but this is not the type of stock I want to own when the probabilities of a recession are as high as they are right now.
Be the first to comment