

andresr/E+ via Getty Images
Thesis
Recent market corrections have created several interesting buying opportunities. In particular, small-cap exchange-traded funds (“ETFs”) showed up on our radar because their current dividend yields have exceeded their multi-year average substantially. As you can see from the following chart, the iShares Russell 2000 ETF (NYSEARCA:IWM) currently yields 1.47%. This is about 24% above its 4-year average of 1.19%, signaling a large valuation discount. Note that even though the data is quoted here for IWM and so is the subsequent analysis, the same observations and conclusions can also be applied to other small-cap ETFs, too, such as the Vanguard Small Cap ETF (VB) or the iShares Core S&P Small-Cap ETF (IJR).
As a byproduct, covered-call ETFs derived using small-caps as underlying also have become attractive. As an example, the Global X Russell 2000 Covered Call ETF (NYSEARCA:RYLD) currently yields 15%, almost 50% above its 4-year average of 9.98%. These covered-call ETFs are probably more attractive in certain ways. For example, RYLD’s dividend yields are more attractive than IWM when benchmarked against the risk-free interest rates.
As such, this article provides a closer look at both funds and makes some suggestions for investors interested in the small-cap space. The key thesis is twofold.
- RYLD is a better choice for more conservative investors interested in current income. Its high yield provides generous current income, and its thick yield spread against risk-free interest rates provides an effective hedge against inflation and interest rate uncertainties.
- The picture for IWM is more mixed. On the one hand, its valuation is near the most attractive level in a decade both in terms of dividend yield and P/E multiples. However, on the other hand, its yield spread against risk-free rates is also near the thinnest level in a decade, signaling considerable short-term volatility risks. And therefore, I feel it is more suitable for investors with a longer time horizon who can wait out the near-term risks.
Source: Seeking Alpha data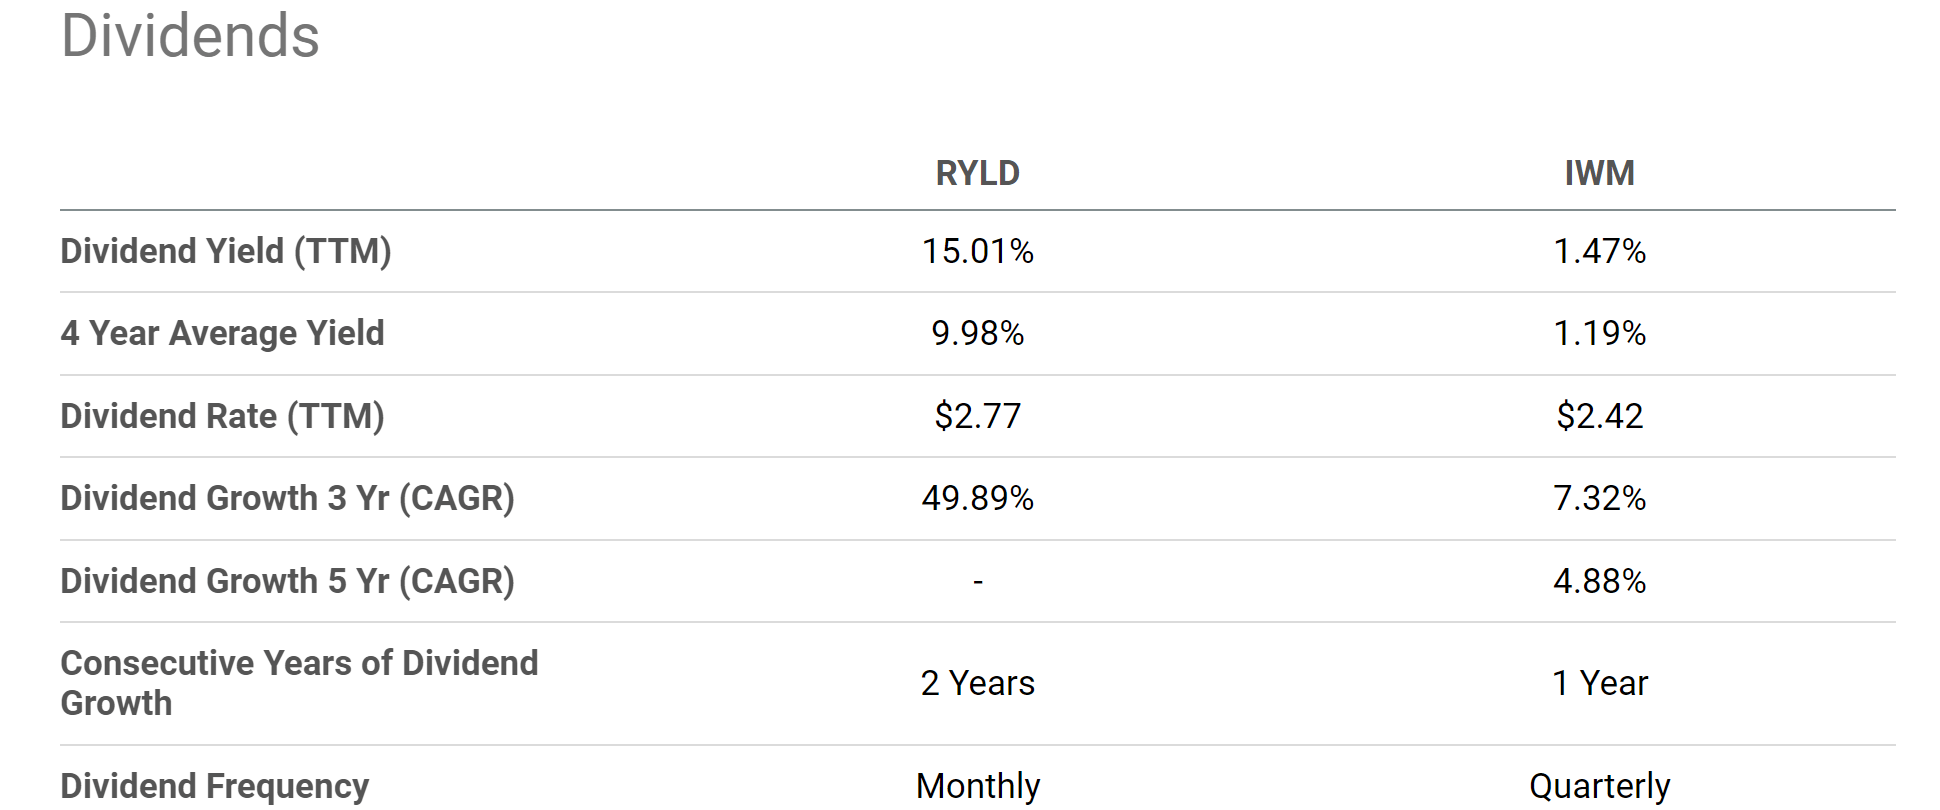
IWM and RYLD: basic information
For readers who are not familiar with these funds yet, the following chart shows an overview of their basic information. IWM is one of the most popular small-cap ETFs, with a $49.48 billion AUM (assets under management). In comparison, RYLD is a much smaller fund with an AUM of $1.27 billion. In terms of expenses, IWM charges a much lower expense ratio of 0.19% and RYLD charges a higher expense ratio of 0.6%.
More importantly, they follow different investment strategies. IWM is quite straightforward – it tracks the Russell 2000 ETF. More specifically, based on IWM’s fund description (slightly edited and the emphasis was added by me):
The iShares Russell 2000 ETF seeks to track the investment results of an index composed of small-capitalization U.S. equities. It provides exposure to 2000 small-cap domestic stocks in a single fund. It can be used to diversify a U.S. stock allocation and seek long-term growth in your portfolio.
Later, I will elaborate on why long-term growth is the key under the current conditions. The RYLD fund is a bit more complicated. According to its fund description (again, slightly edited and the emphasis was added by me):
RYLD writes call options on the Russell 2000 Index, saving investors the time and potential expense of doing so individually. RYLD seeks to generate income through covered call writing, which historically produces higher yields in periods of volatility. RYLD makes distributions on a monthly basis.
The emphasis here is that its strategy has “historically produces higher yields in periods of volatility.” And next, we will that that now is such a time.
Source: ETF.com
RYLD and volatility
The volatility index (“VIX”) has spiked substantially recently. For example, last week, the volatility hovered above 31.6 for several trading sessions, compared to about 26.5 during the same week last month. To provide a broader context, a volatility index of 31.6 is at the top 94% percentile of historical volatility. Such a volatility surge could be bad news for equity investors in general, but it can be good news for income investors using the call-writing strategy that RYLD employs. As detailed in my earlier articles:
Writing (or selling) calls is like selling anything else in that the amount of the premiums the sell can charge changes as the demand-supply dynamics change. When the market is in panic mode – like in Feb 2020 when COVID first broke out or in the last few weeks – the demand for calls is high, reflected in the so-call implied volatility and the VIX index. And in turn, such high volatility leads to higher premiums for call sellers (i.e., the RYLD fund in this case). That is the main reason why we see the spike in income distribution from similar covered-call funds in 2020. And for this reason, I would also expect a hike in income distribution in the coming months due to the recent VIX spike.
Source: Seeking Alpha data
RYLD yield spread
Besides providing a high yield, RYLD as provides a high yield spread (“YS”) relative to risk-free rates. This work will use the dividend yield spread against 10-year treasury rates as a valuation measure. Details of these concepts and approaches have been provided in our earlier article. In summary,
- The common PE or Price/cash flow multiples provide partial information or are simply not applicable like in the case of RYLD.
- Dividends provide a backdoor to quickly estimate the owners’ earnings. Dividends are the most reliable financial information and least open to interpretation.
- The dividend yield spread (“YS”) is based on a timeless intuition. No matter how times change, the risk-free rate serves as the gravity on all asset valuations and consequently, the spread ALWAYS provides a measurement of the risk premium investors are paying relative to risk-free rates.
With this background, the following chart shows the YS of RYLD relative to 10-year treasury rates. As seen, the spread peaked around 13% in early 2020 (when the COVID panic was at its peak). The spread then oscillated between a range of 11% to about 9.0% since then. Currently, with RYLD yielding 15% on a TTM basis and 10-year treasury rates near 3.7%, the YS is about 11.3%, close to the highest level since its inception.
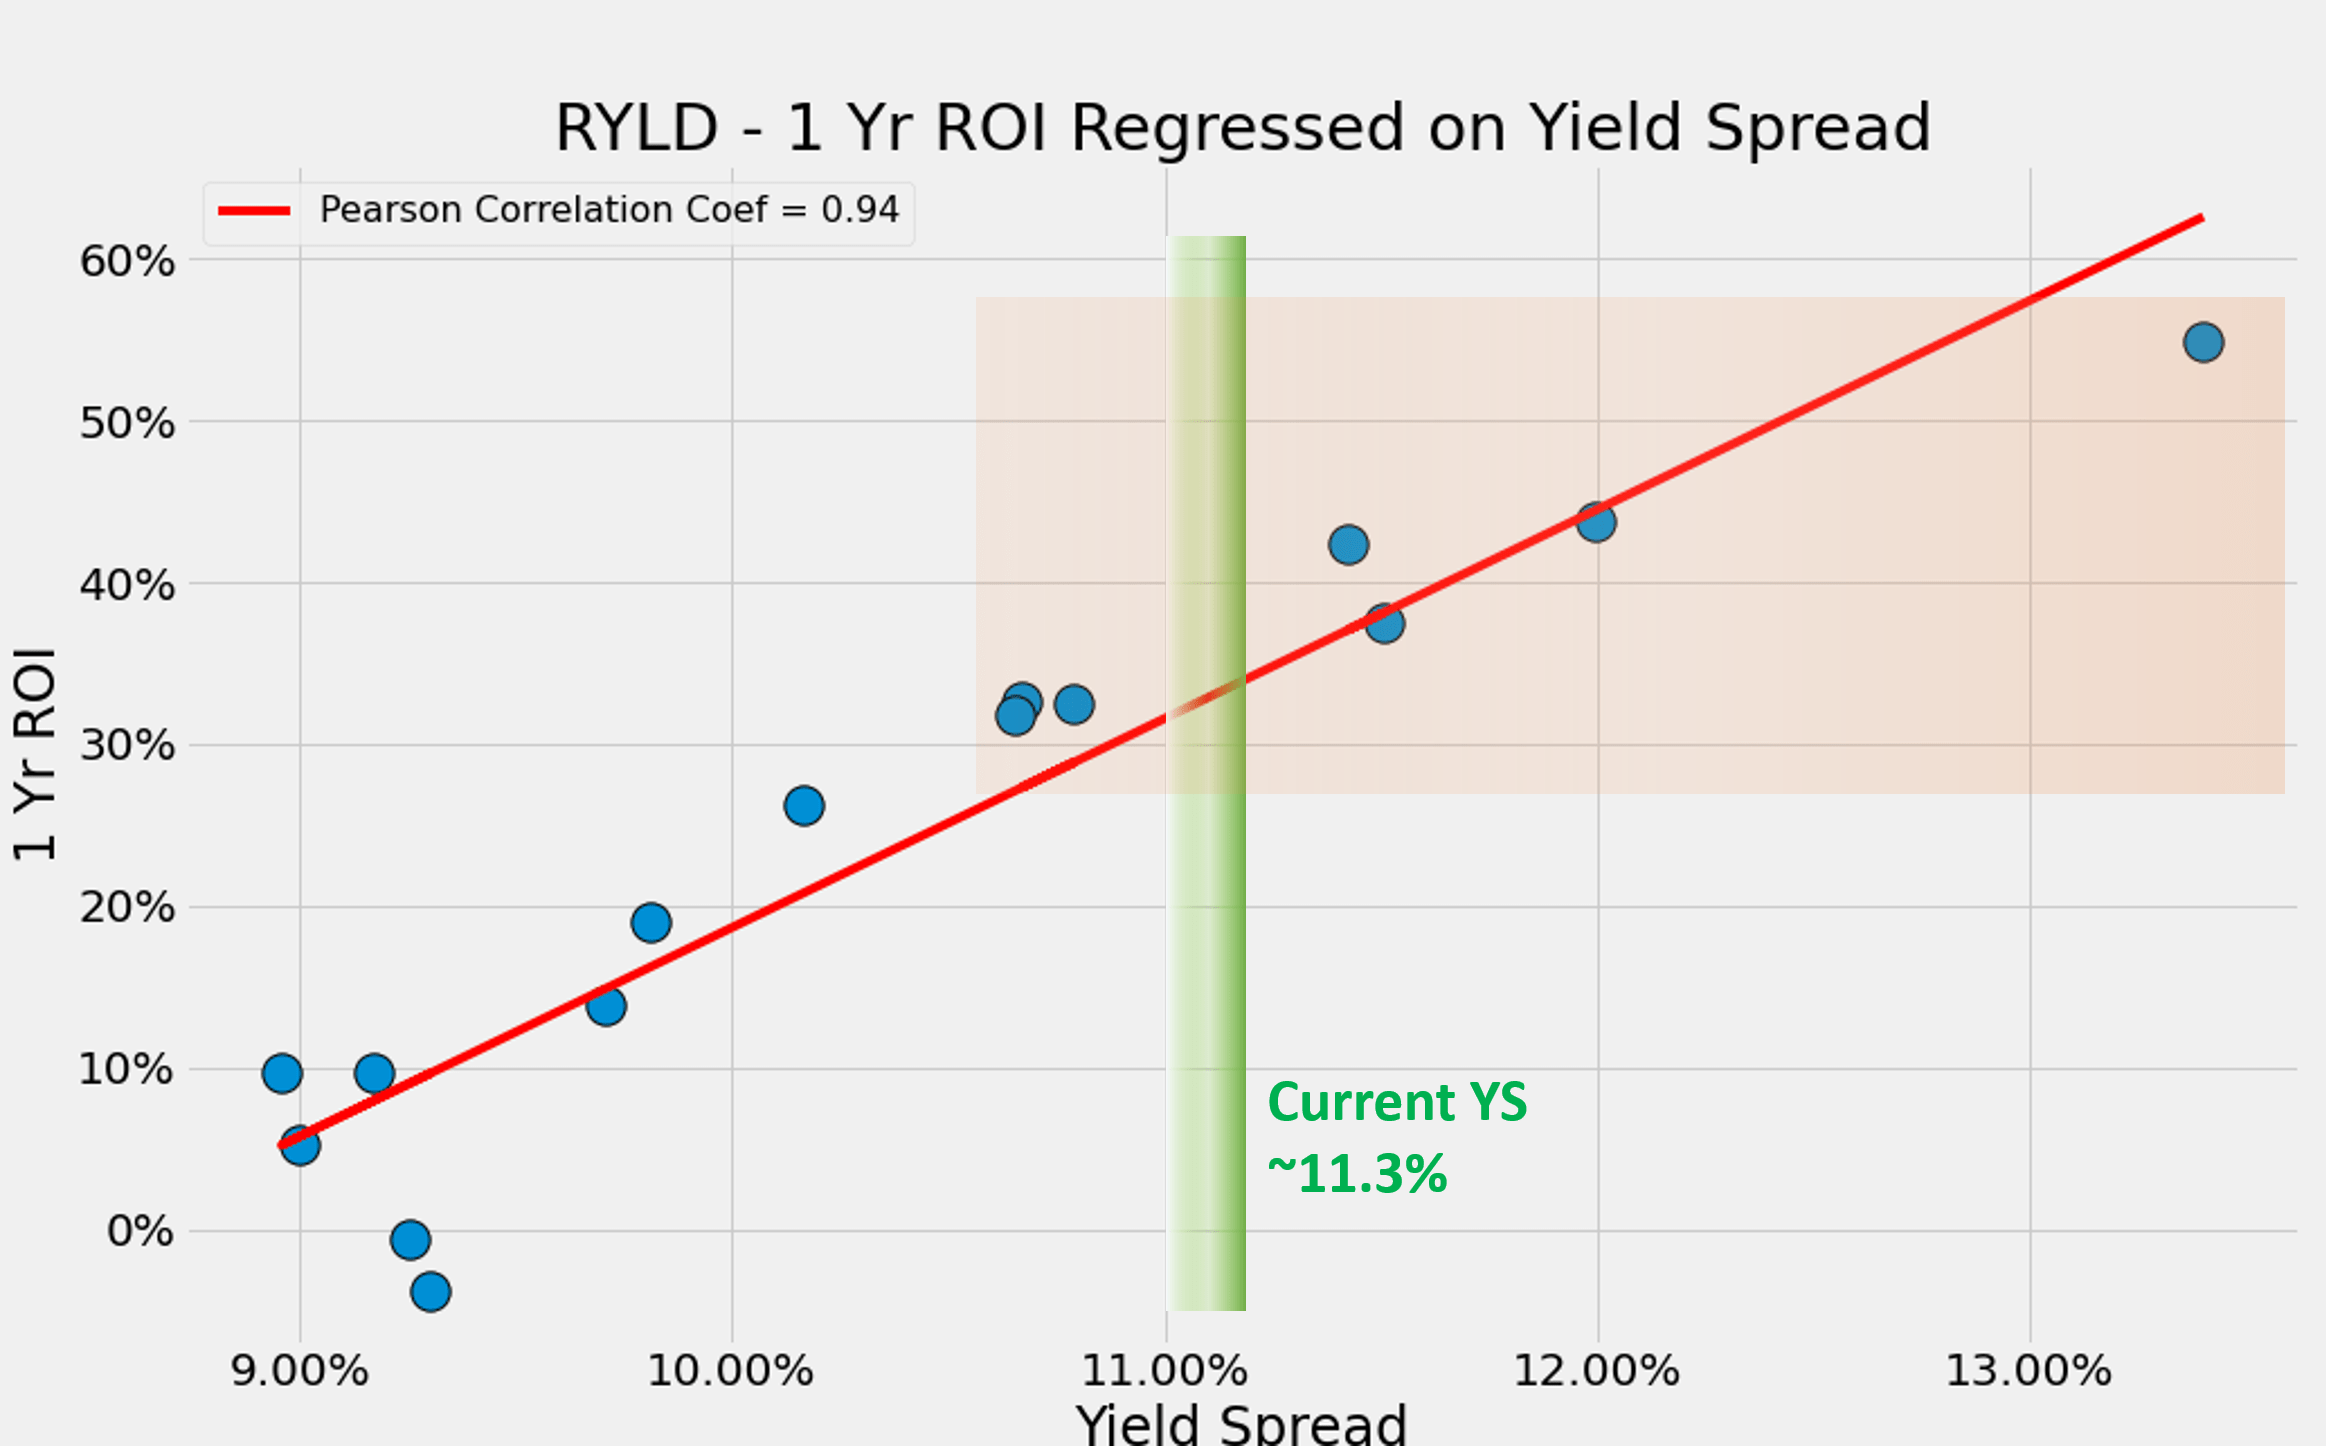
And the second chart below shows that the short-term returns are closely correlated with the YS. The chart shows the 1-year total return on RYLD (including price appreciation and dividend) regressed on yield spreads. Largely due to the limited data because RYLD was launched in 2020 only, the correlation coefficient is 0.94, almost a perfect correlation. Particularly when the YS is near or above 11.3%, the total returns in the next year have been all positive and very large (but again, be aware of the limited data points available here).
Source: Author based on Seeking Alpha data Source: Author based on Seeking Alpha data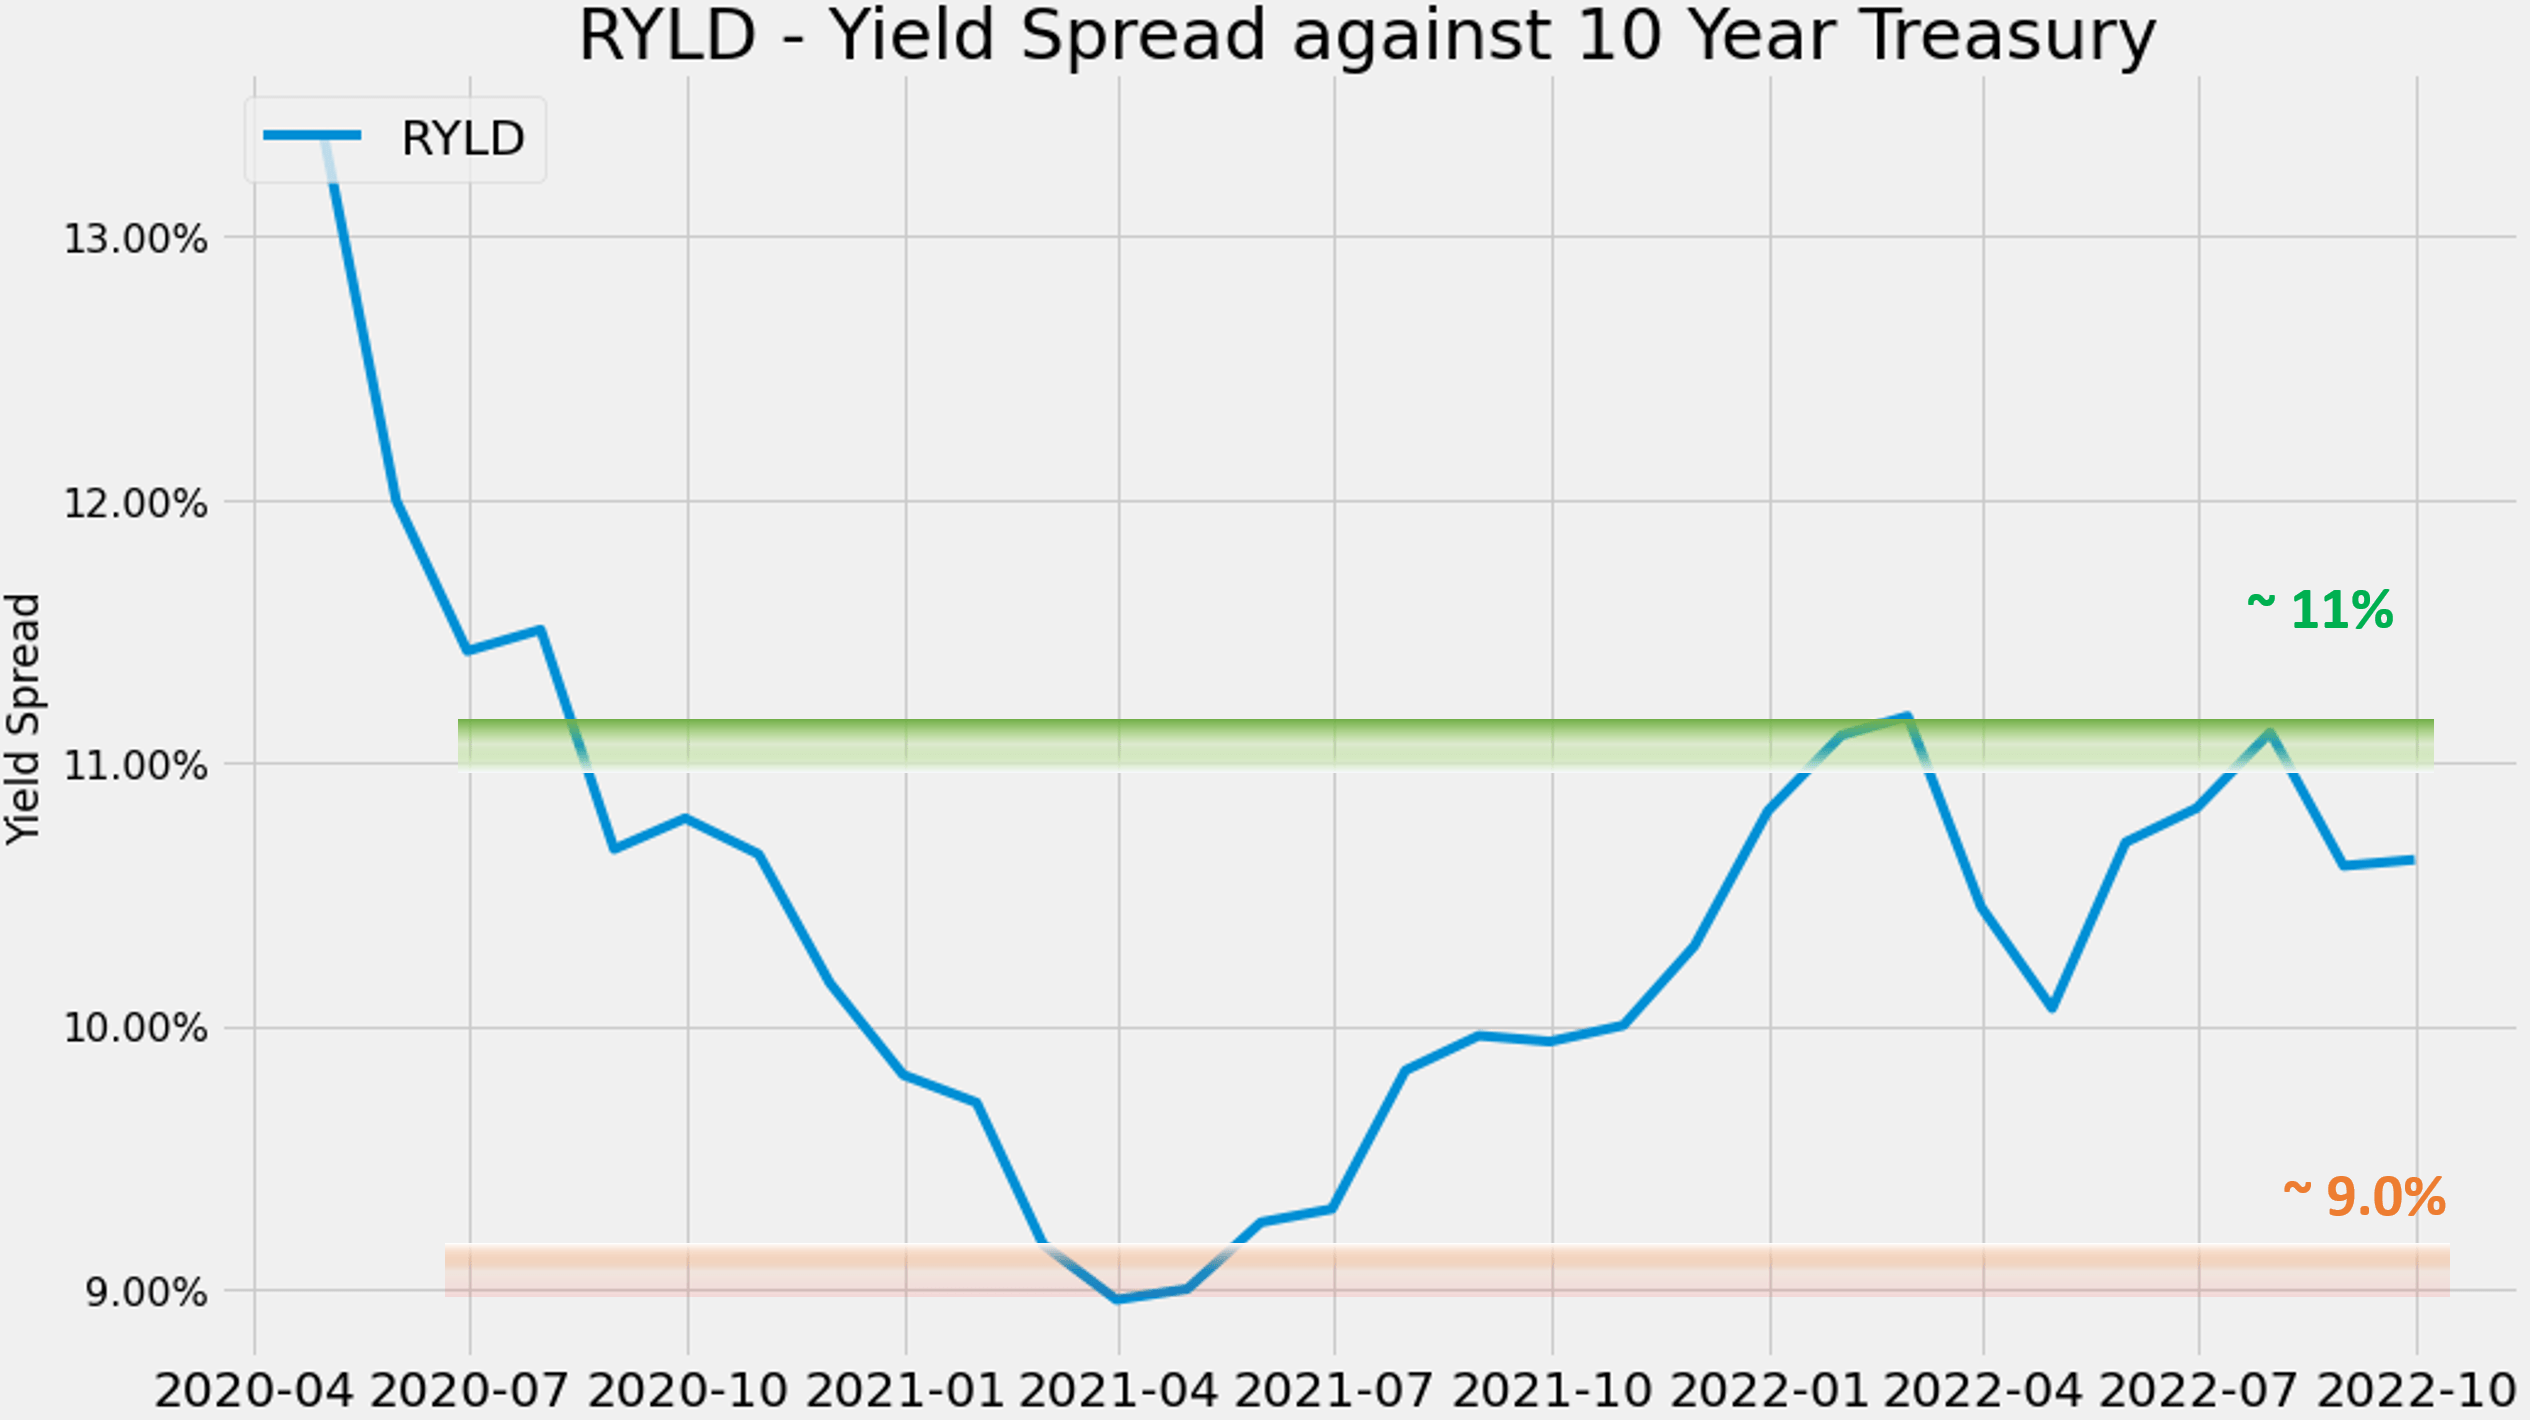
IWM’s picture is a bit mixed
The picture for IWM is mixed as mentioned above. On the one hand, its valuation is at a large discount of 24% in terms of dividend yield. At the same time, its P/E multiples are also near a secular bottom as shown in the chart below. As seen, small caps are only valued at 10.7x FW P/E. Such valuation is among the lowest in more than 2 decades. It is essentially at the bottom level during the COVID crash and is approaching the bottom level during the 2008 crisis.
Source: www.yardeni.com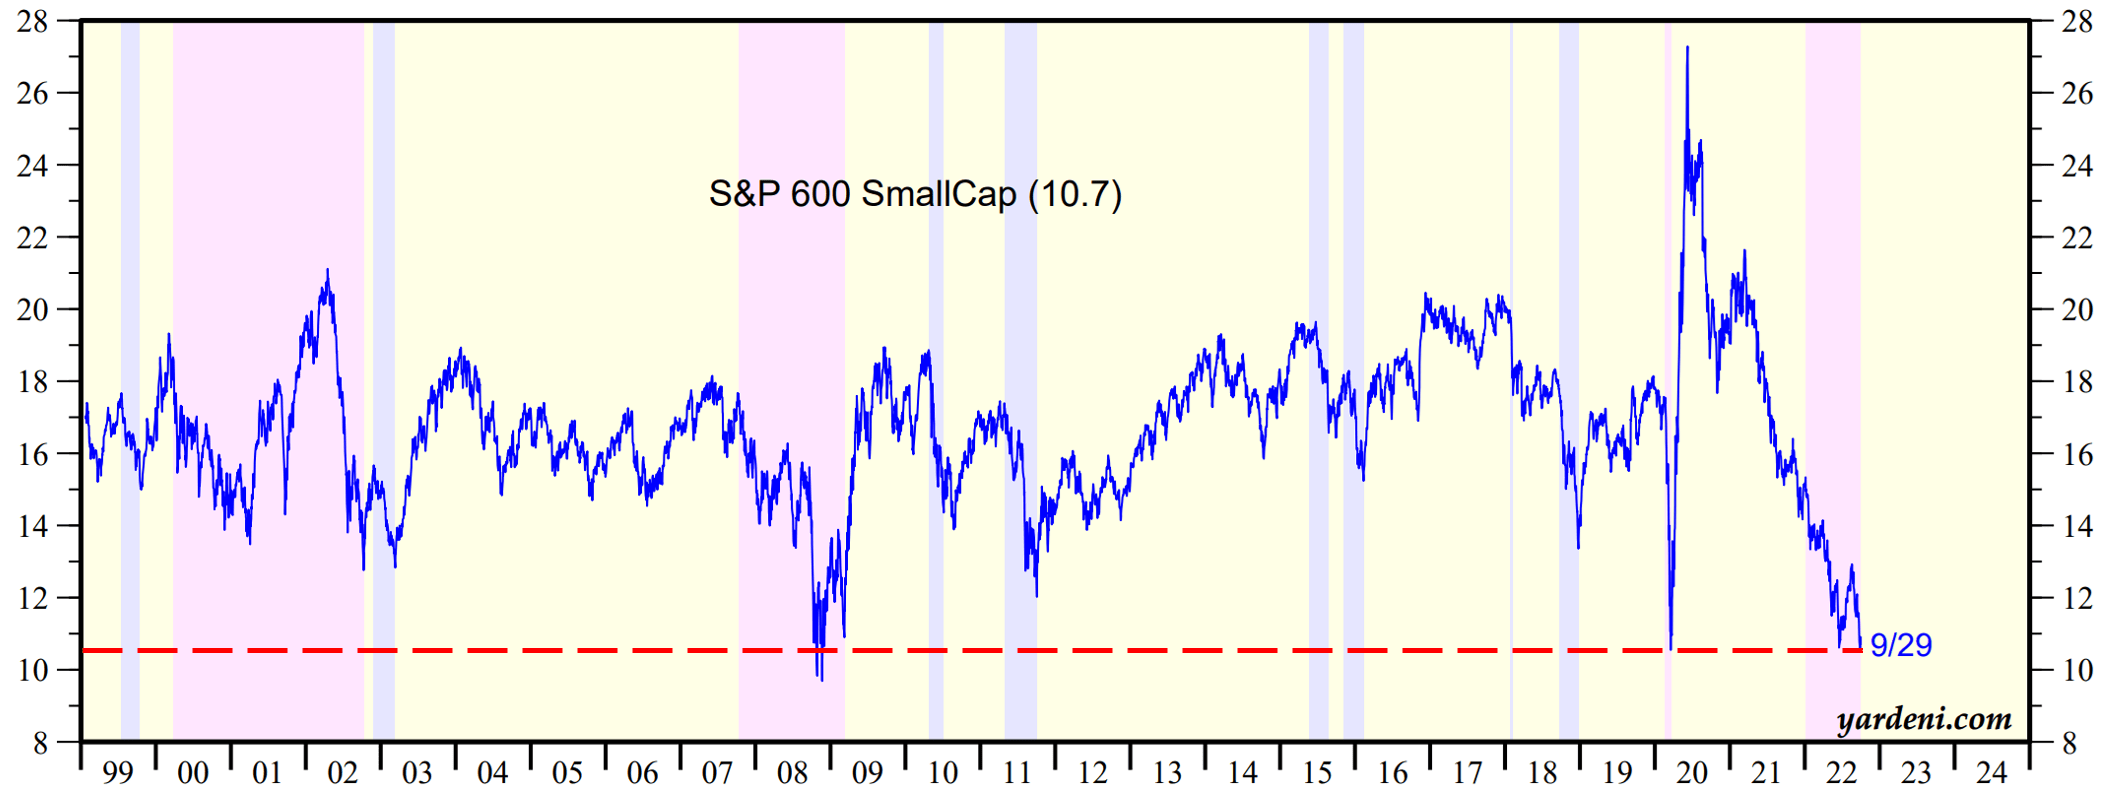
However, on the other hand, its yield spread against risk-free rates is also near the thinnest level in a decade as you can see from the chart below. You can see that the yield spread between IWM and the risk-free treasury rates has been bounded and tractable over the decades. The spread has been fluctuating in the range between about 0% and negative 2.5% the majority of the time since 2008. Currently, the YS hovers around -2.2% (1.47% TTM yield from IWM minus 3.7% 10-year treasury rates as of this writing. It is near the thinnest level last seen in 2010 amid the aftermath of the 2008 crisis.
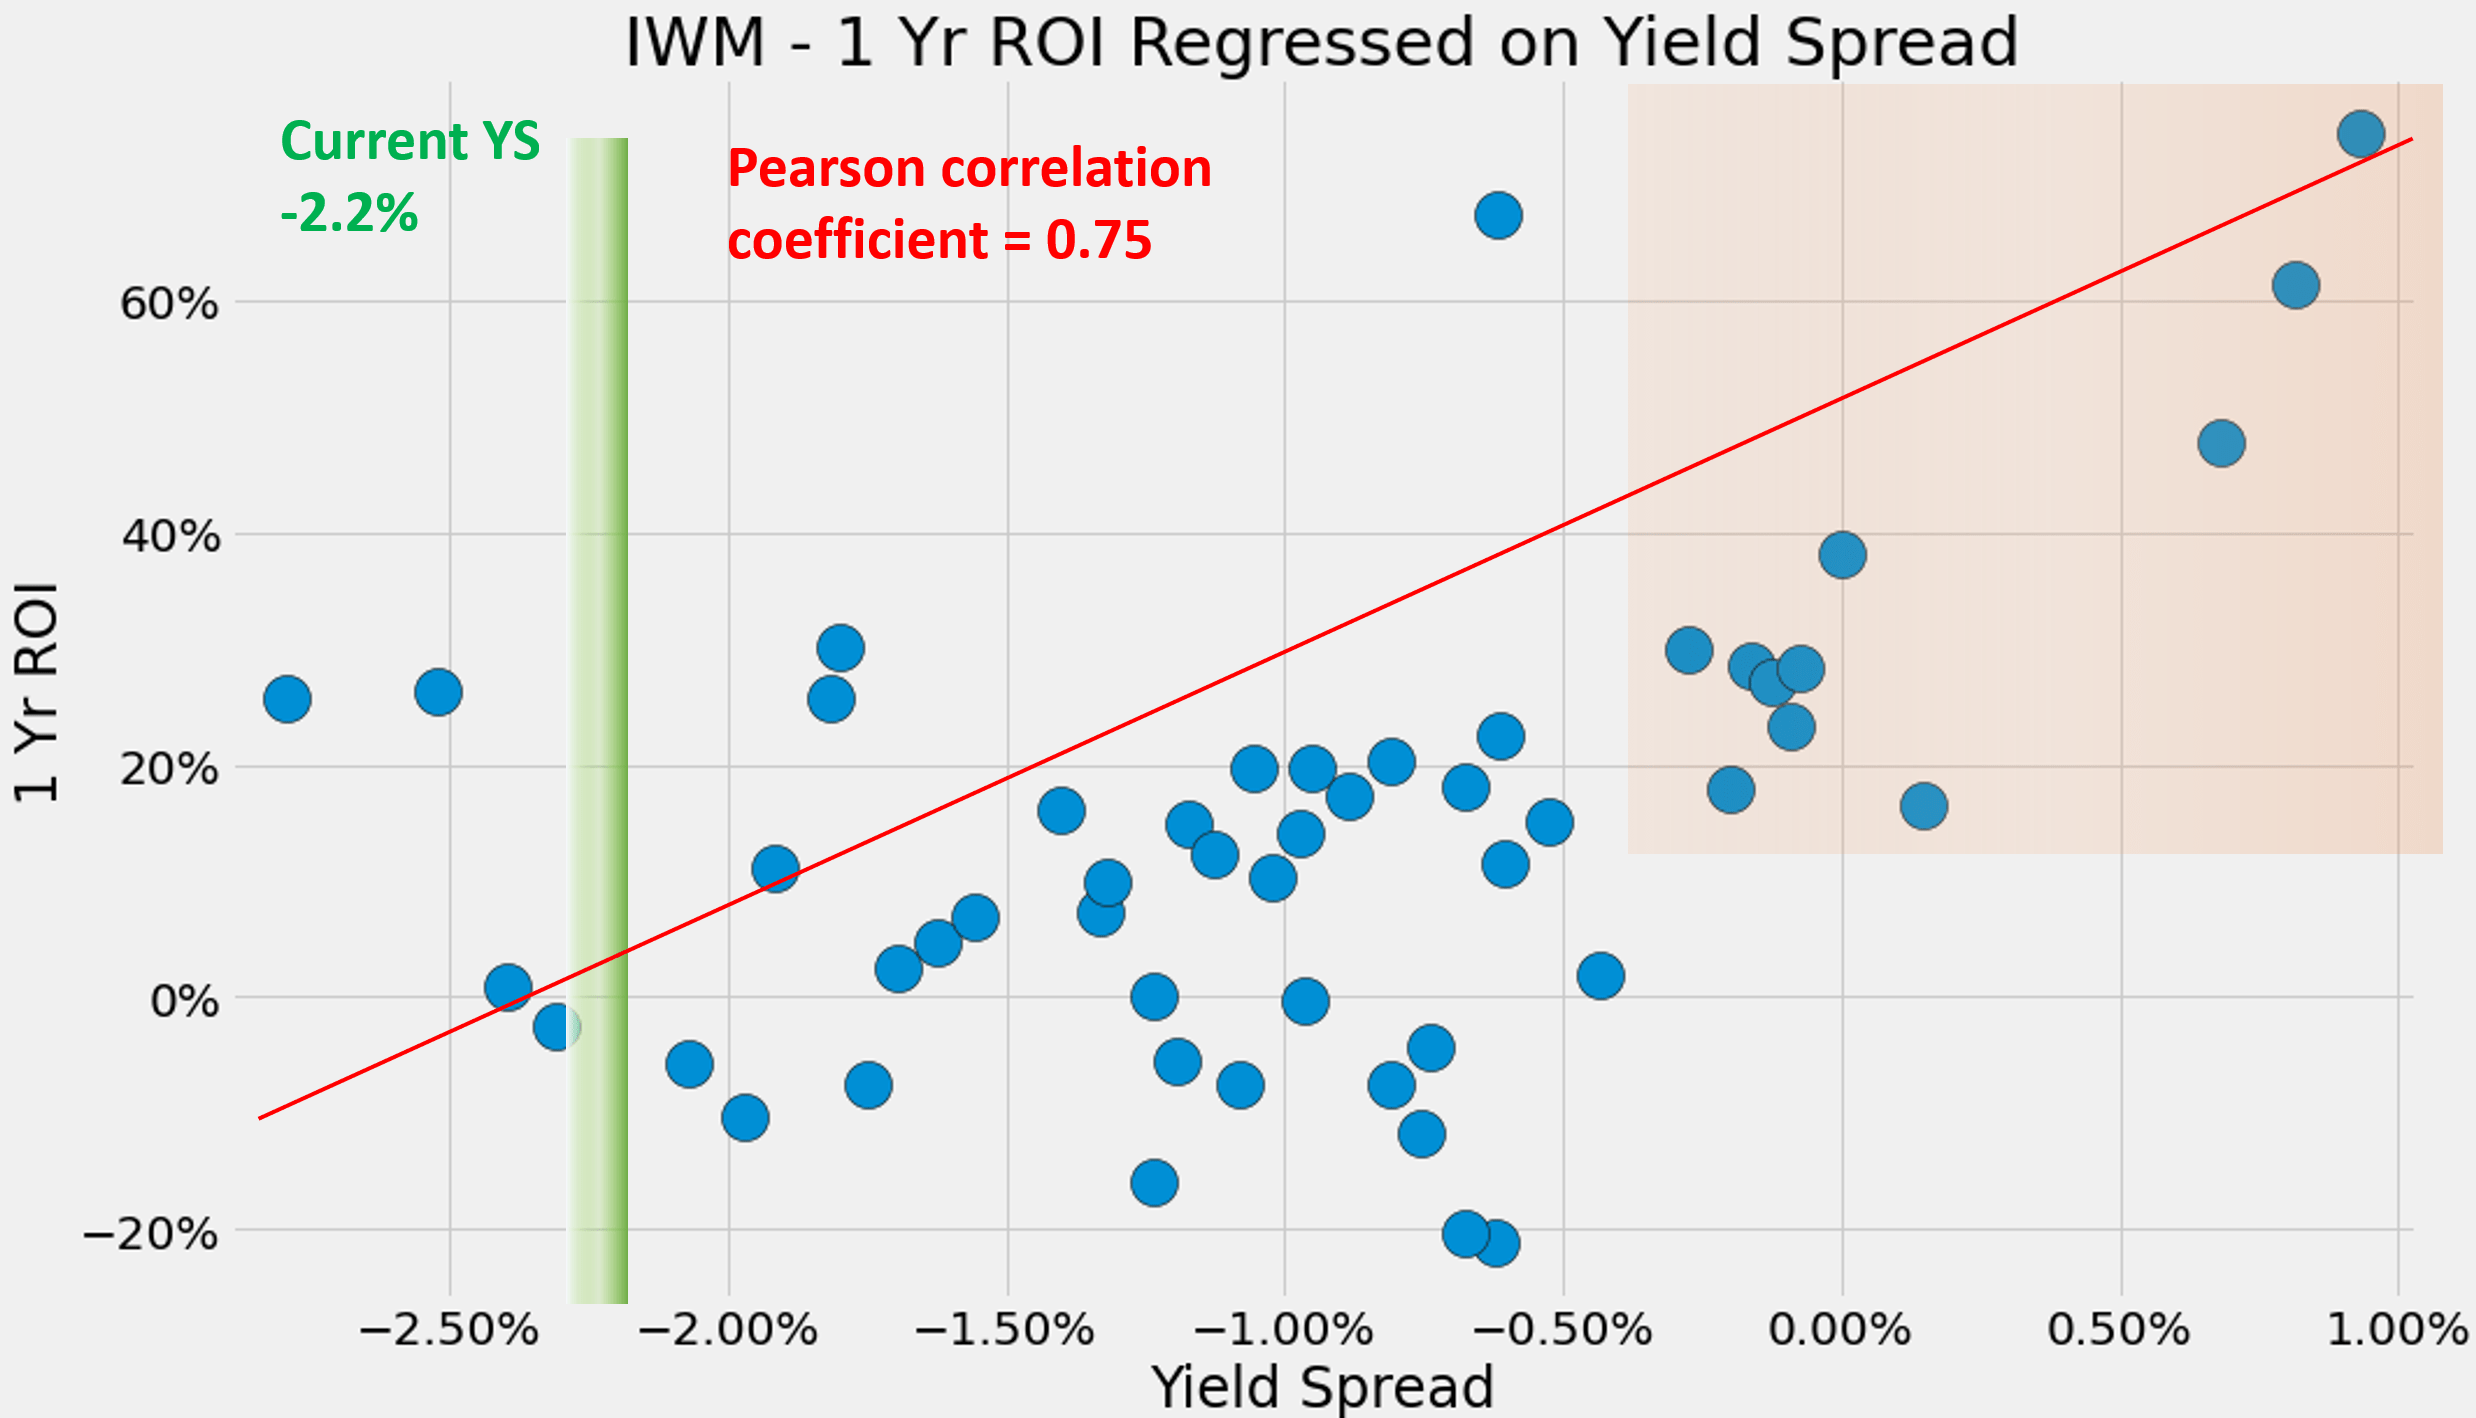
And as you can see from the second chart below, the 1-year total return on IWM (including price appreciation and dividend) also correlates positively and strongly with the YS (the Pearson correlation coefficient is 0.75). Ant the current YS of -2.2% signals considerable short-term volatility risks from historical data.
Source: Author based on Seeking Alpha data Source: Author based on Seeking Alpha data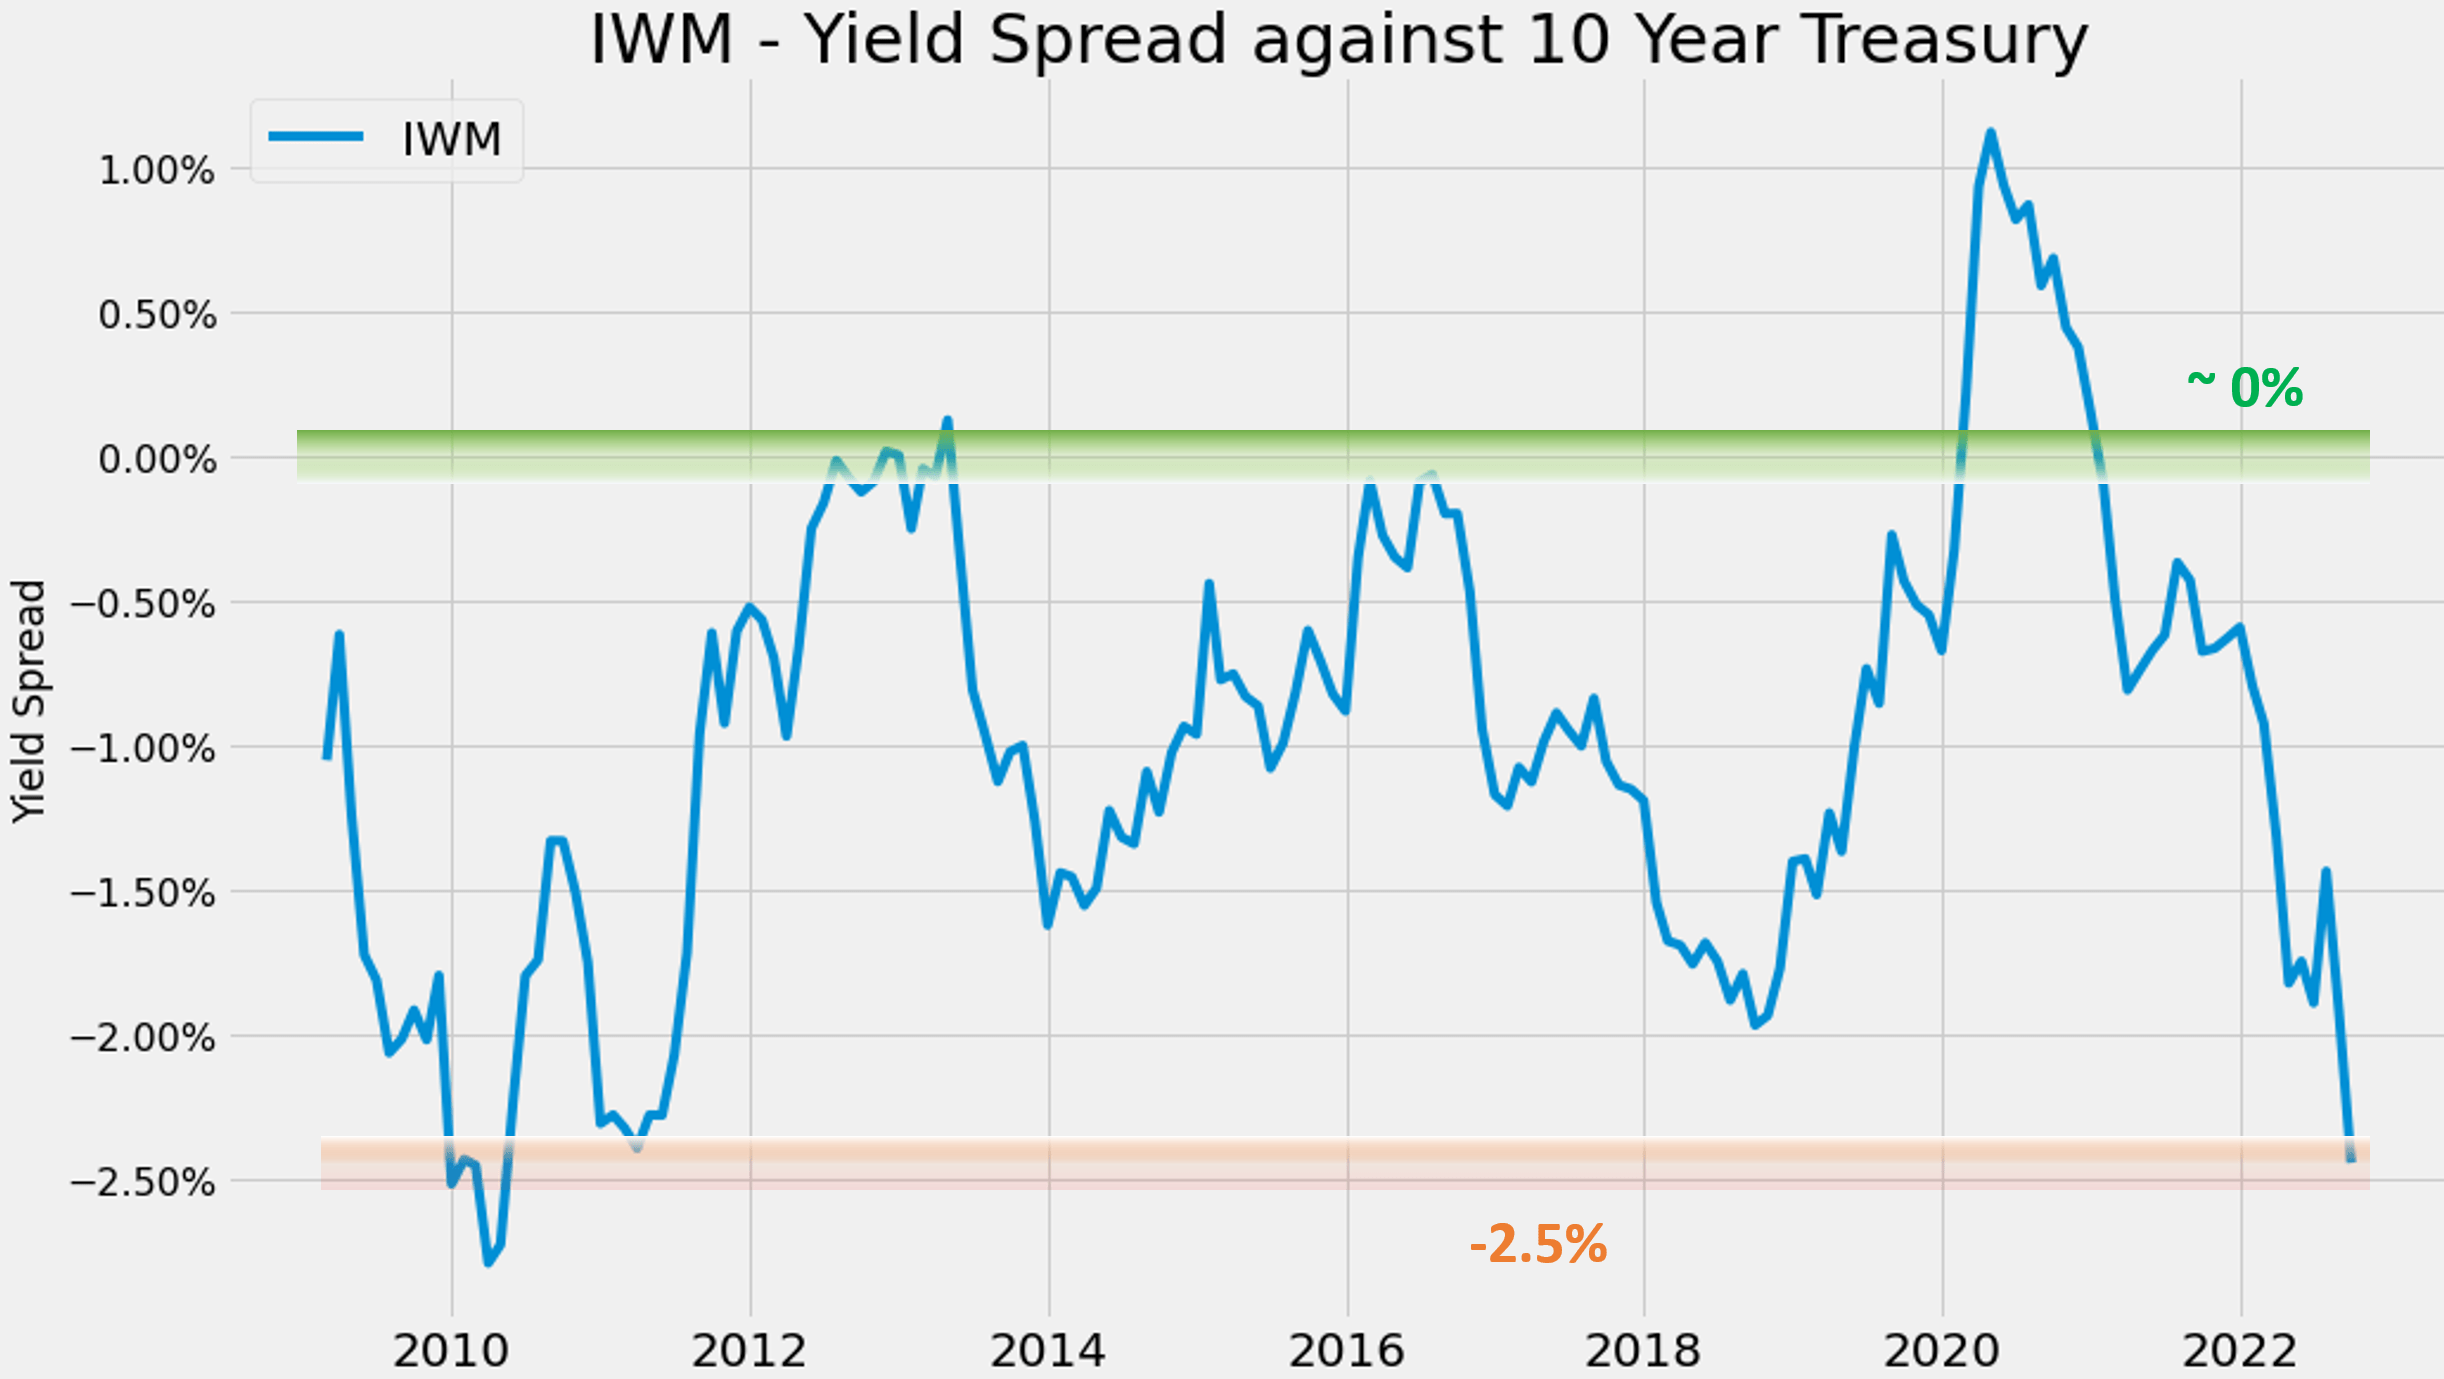
Risks and final thoughts
The risks associated with either IWM or RYLD are largely the same as the macroeconomic risks facing the overall market (such as inflation, further interest rate hikes, and also the possibility of recession). The exception here is that RYLD’s use of options provides a hedge from its premium (at the cost of limiting its price appreciation potential in the case of a strong market rally). Furthermore, IWM is more closely correlated with the overall market. It has a correlation of 0.90 against the equity market represented by SPY. IWM also suffers larger volatility than the overall market. Its annualized standard deviation is almost 25%, about 5% above the overall market and RYLD.
Source: Portfolio Visualizer
To conclude, recent market corrections have brought the small caps to attractive levels. Judging by dividend, IWM currently yields 1.47%, about 24% above its 4-year average of 1.19%, signaling a large valuation discount. Judging by P/E multiples, small caps are currently valued near the 2008 bottom and 2020 COVID crash. Covered-call ETFs such as RYLD are especially attractive because they benefit from the current marketing conditions twice: the valuation discount of the underlying and also the premium increase due to market volatility. Its yield spread relative to 10-year treasury rates is also at a very safe level.
As such, my overall impression is that RYLD is a good investment opportunity for conservative and income-oriented investors. I feel IWM should have a larger upside potential than RYLD in the next 5 to 10 years given the large valuation compression. Although, the fund faces substantial near-term volatility risks given its thin spread against risk-free rates. As such, I feel it is more suitable for investors with a longer time horizon who can wait out the near-term risks can cap.
Be the first to comment