

JLGutierrez
Inflation in services is now where the action is, not commodities or durable goods.
Inflation as measured by the Consumer Price Index backed off a tad in July to a still ugly 8.5%, from the super-ugly 9.1% in June, as food prices continued to spike but gasoline and natural gas prices fell sharply and prices of durable goods backed off their crazy spike.
But inflation in services rose to 6.25%, the highest since 1982. The CPI for services is still below overall CPI and is still pulling down overall CPI. But it has been getting worse every month for 11 months, and as other price spikes back off, the services CPI pushes to the forefront. That’s how inflation works after it’s entrenched: it cycles from category to category and pops up in different places, while backing off for a while in other places.
The headline Consumer Price Index (CPI-U), released on Wednesday by the Bureau of Labor Statistics, was unchanged for the month, after two ugly month-to-month spikes, and rose by 8.5% year-over-year:
Consumer Price Index, % Change From Year Ago (Author)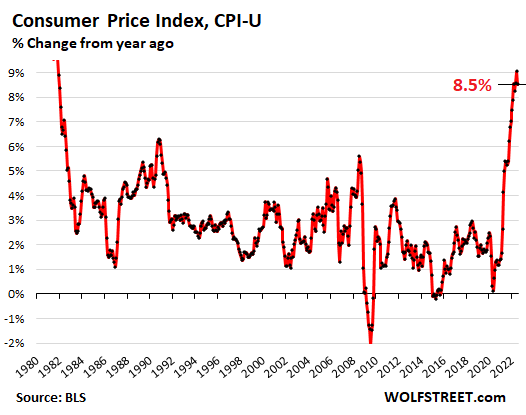
Social Security COLA: CPI-W, the first month of three
The Consumer Price Index for “all urban wage earners & clerical workers” (CPI-W) backed off to a still horrible 9.1% in July. The average of the July, August, and September readings will be used to determine the COLAs for Social Security benefits in 2023, and July’s 9.1% is the first month in this average of three months:
Consumer Price Index For Urban Wage Earners & Clerical Workers, % Change From Year Ago (Author)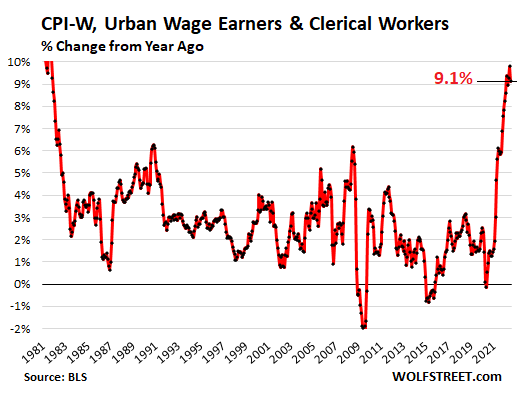
Services Inflation worsens
The CPI for services continued its relentless spike, rising by 0.37% in July from June and by 6.25% year-over-year, the worst increase since 1982.
Some services, such as airfares, are indirectly influenced by commodities (fuel). Others, such as insurance, healthcare, housing (based on rental factors), etc., are not, and a decline in the prices of commodities don’t reduce inflation in these services.
Inflation in services is now where the action is, and it’s very tough to get inflation in services under control:
Consumer Price Index For Services, % Change From Year Ago (Author)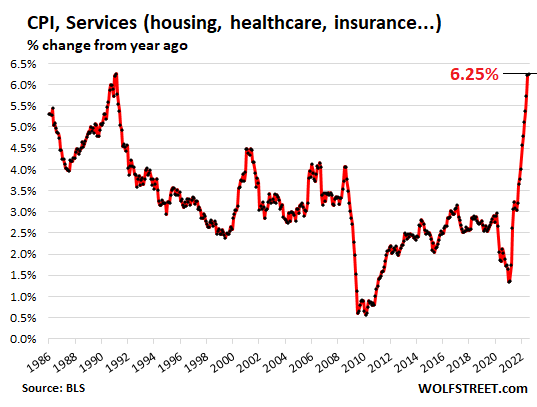
Service categories where CPI rose year-to-year:
- Health insurance: +20.6%
- Rent of primary residence: +6.3%
- Rent, owner’s equivalent: +5.8%
- Motor vehicle maintenance, repair: 8.1%
- Auto insurance: +7.4%
- Medical care services: +5.1%
- Delivery services: +14.0%
- Pet services, including veterinary: +9.3%
- Airline fares: +27.7% (-7.8% monthly)
- Hotels & motels: +1.0% (-2.7% monthly)
- Other personal services (dry-cleaning, haircuts, legal services, etc.): 6.3%
- Admission to movies, theaters, concerts: +6.2%
- Video and audio services, including cable: +3.8%
- Water, sewer, trash collection services: +4.4%
Service categories where CPI fell/remained flat year-over-year:
- Telephone services: unchanged
- Car and truck rental: -11.9%
- Admission to sporting events: -2.7% (but +4.9% monthly)
“Core” CPI
The “core” CPI excludes the volatile commodities-dependent food and energy components to track inflation in the broader economy. Services are a big part of it. But so are durable goods.
It rose by 0.3% in July from June, after the red-hot spike in June, and by 5.9% year-over-year, same as in June:
Core Consumer Price Index, % Change From Year Ago (Author)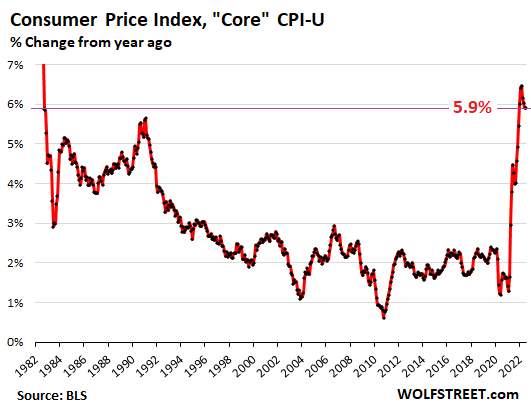
Food prices spike worst since 1979, but shift among categories
The CPI for “food at home” – food bought in stores and at markets – spiked by 1.3% in July from June, and by 13.1% year-over-year, the worst spike since 1979.
Food is one of the categories where inflation hits consumers in the face on a daily basis. And it hits people in the lower part of the income spectrum much harder because they spend a relatively bigger portion of their income on food.
Consumer Price Index For Food At Home, % Change From Year Ago (Author)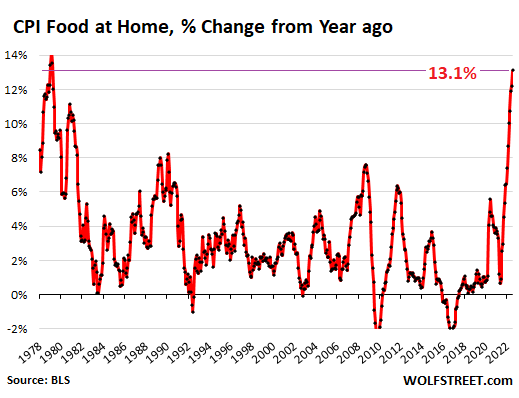
Inflation cycles from category to category, in a game of inflation Whac-A-Mole. For example, as you’ll see below, beef and pork prices, which had spiked over the past months, have now stabilized at very high levels as folks changed to poultry. And with some demand shifting from beef and pork to poultry, poultry prices are spiking. And eventually, price spikes might return to beef. This is the same principle everywhere.
Major food-at-home categories, and % change from a year ago (and % change from June):
- Cereals and cereal products: +15.0% (+1.8%)
- Beef and veal: +3.4% (unchanged)
- Pork: +7.6% (-0.2%)
- Poultry: +16.6% (+1.2%)
- Fish and seafood: +8.7% (-0.1%)
- Eggs: +38.0% (+4.3%)
- Dairy and related products: +14.9% (+1.7%)
- Fresh fruits: +9.0% (+0.2%)
- Fresh vegetables: +7.3% (+0.1%)
- Juices and nonalcoholic drinks: +12.9% (+2.0)
- Coffee: +20.3% (+3.5%)
- Fats and oils: +20.8% (+2.2%)
- Baby food: +15.0% (+2.1%).
“Food away from home” CPI – restaurants, vending machines, cafeterias, sandwich shops, etc. – jumped by 0.7% in July from June, and by 7.6% year-over-year. Both June (+7.7%) and July (+7.6%) had been the worst since November 1981.
Energy
The Energy CPI plunged by 4.6% in July from June, driven by plunges in gasoline and natural gas, which were a big contributor to the headline CPI getting a little less hot. But year-over-year, the energy CPI was still up 32.9%:
- Gasoline: -7.7% for the month, but still +44.0% year-over-year.
- Utility natural gas to the home: -3.6% for the month, but still +30.5% year-over-year.
- Electricity service: +1.6% for the month, +15.2% year-over-year.
Housing costs
The CPI for “rent of shelter,” which is included in the services CPI and accounts for 31.7% of total CPI, attempts to measure housing costs as a service – “shelter” – not as an investment asset to be purchased. Its two components:
“Rent of primary residence” (accounts for 7.2% of total CPI) jumped by 0.7% in July from June, and by 6.3% year-over-year (red in the chart below). It’s based on what a large panel of tenants reported about their actual rent payments over time, including in rent-controlled apartments.
“Owner’s equivalent rent of residences” (accounts for 23.5% of total CPI) jumped by 0.6% for the month and by 5.8% year-over-year (green line). It attempts to measure the costs of homeownership as a service, based on what a large panel of homeowners report their home would rent for.
Both measures have been surging relentlessly, but are still below overall CPI and are still holding down overall CPI, but are holding it down less each month and will become a major driver of CPI inflation:
Consumer Price Index For Rent Of Primary Residence, Owner’s Equivalent Of Rent, % Change From Year Ago (Author)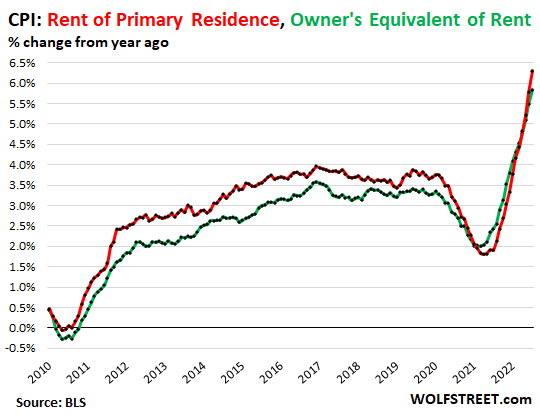
The “Zillow Observed Rent Index” (ZORI) reflects asking rents – meaning the advertised rents of apartments and houses listed for rent. They’re a measure of rents that landlords are trying to get on their vacant units.
In June, the latest data available, the ZORI jumped by 0.8% from May to a record of $2,007 – but that 0.8% jump, though still huge, was smaller than the prior month-to-month spikes.
Year-over-year, the ZORI spiked by 14.8%, which is little less massive than the prior spikes.
It takes a while for asking rents (red line in the chart below) to turn into actual rents that tenants are paying and reporting as part of the CPI panel, where they’re eventually picked up by “rent of primary residence” (purple) and by “owner’s equivalent rent” (green).
The rent spike since mid-2021 has been so sudden that it accentuated the lag between the CPI rent indices and the ZORI (my discussion of this phenomenon, the lag, and what it means for CPI into 2023):
Zillow Rent Index Vs. CPI Rent Vs. CPI OER (Author)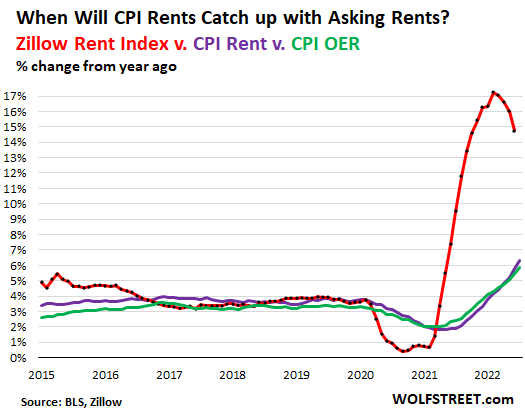
Home prices spiked by 19.7% year-over-year, according to the latest Case-Shiller Home Price Index (purple line below), which lags four to six months. I’ve been documenting this raging mania since 2017 with my series, “The Most Splendid Housing Bubbles in America.”
But the CPI attempts to measure the cost of housing as a service via its “owner’s equivalent rent” (red). Both indices here are set to 100 for January 2000:
Consumer Price Index Owner’s Equivalent Rent; Case-Shiller Home Price Index (Author)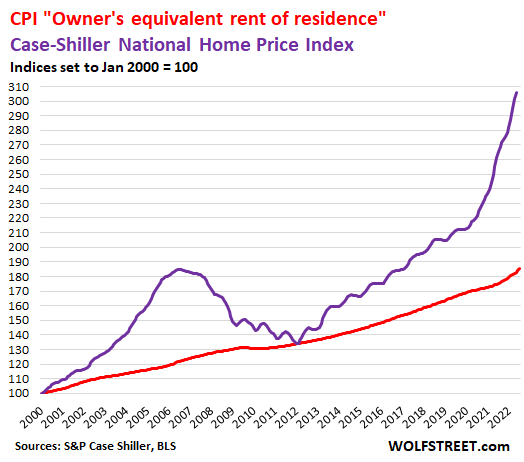
Durable goods CPI
Durable goods went through a huge boom during the pandemic that caused prices to spike in a ridiculous manner, notably in new and used vehicles but also in other categories. This boom is now winding down as consumers are shifting their spending to services.
The CPI for durable goods rose 0.3% in July from May, and was up by 7.9% year-over-year, which is still a huge amount of annual inflation, but it was down from the crazy levels in the 17-19% range early this year and was the smallest year-over-year increase since April last year.
Consumer Price Index Durable Goods, % Change From Year Ago (Author)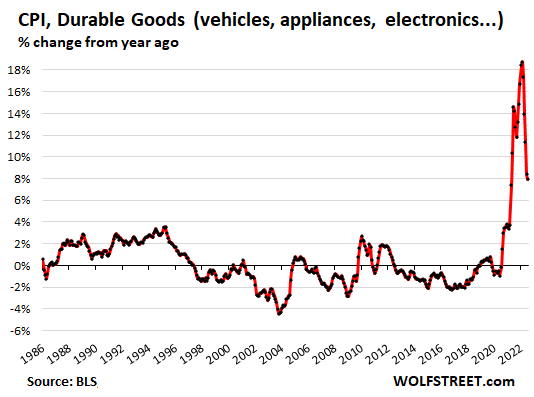
Some major categories of durable goods:
- New vehicles: +0.6% monthly, +10.4% year-over-year
- Used vehicles: -0.4% monthly, +6.6% year-over-year
- Household furnishings (furniture, appliances, floor coverings, tools, etc.): +0.6% monthly, +10.8% year-over-year
- Sporting goods (bicycles, equipment, etc.): -0.2% monthly, +5.2% year-over-year
- Information technology (computers, smartphones, etc.): -0.9% monthly, -8,1% year-over-year
A word about prices and CPI in information technology products
As the list just above shows, information technology products had at a negative CPI. Computers, smartphones, and other electronic devices have gotten immeasurably more powerful and useful over the years. Some of those products didn’t even exist 20 or 30 years ago. A good PC with two floppy drives and no hard drive, and no internet connection cost around $2,000 to $3,000 in 1985. This would be a useless boat anchor today. A $1,000 laptop today is immeasurably more useful and powerful.
CPI attempts to track the loss of purchasing power of the dollar, in other words, how much you pay for the same product over time. So when a product gets a million times better, it’s not the same product anymore. If the price stays the same, or declines, though the product gets better, then this is “deflationary.”
Tech products, thanks to constant invention, have been “deflationary” from the beginning of time. And that’s a good thing. That’s how it is. CPI adjusts for this via hedonic quality adjustments. And that’s why the CPI of tech products should be negative, and it usually is.
Editor’s Note: The summary bullets for this article were chosen by Seeking Alpha editors.
Be the first to comment