

(This article was co-produced with Hoya Capital Real Estate.)
On November 12, 2021, in conjunction with the Hoya Capital Income Builder (hereafter HCIB) marketplace service, I introduced the ETF Reliable Retirement Portfolio (hereafter ETFRRP).
On July 11, 2022, I offered the 2022 Q2 update on the portfolio. I referred to this as “the bear market update,” since Q2 closed with the S&P 500 index in bear market territory. Further, the classic 60/40 portfolio suffered its worst drop in years, with both stocks and bonds down over 10%.
For a complete discussion of the theory behind the initial portfolio construction, as well as the starting balance and positions, please feel free to reference the articles referenced above. In the next section, however, I will offer an abbreviated overview of key data points and concepts to lay a groundwork for the performance update that is ultimately the subject of this article.
Portfolio Structure And Themes
Based on 2022 investment outlooks from several reputable sources, here are the key themes that drove portfolio construction.
- A bias toward value stocks in the U.S. – Of late, a relatively small subset of U.S. growth stocks has significantly outperformed virtually every other asset class. Various analyses suggest that value stocks may offer a better risk/reward profile moving forward.
- The return from U.S. equities may be only marginally higher than bonds – Particularly for retirees, finding a solid balance of risk/reward is worthy of consideration. I attempt to find this balance in my portfolio.
- Superior growth opportunities may come from outside the U.S. – A mid-year 2021 update from Vanguard forecast Euro-area stocks as potentially outperforming their U.S. cousins by roughly one-half percent; a range of 2.9% – 4.9% as opposed to 2.4% – 4.4%. And emerging markets offered even higher potential, albeit with more volatility and risk.
Below, I have reproduced the table of exchange-traded funds (“ETFs”) included in the portfolio. However, the weightings are proprietary to subscribers of Hoya Capital Income Builder.
ETFRRP by ETF Monkey (Hoya Capital Income Builder)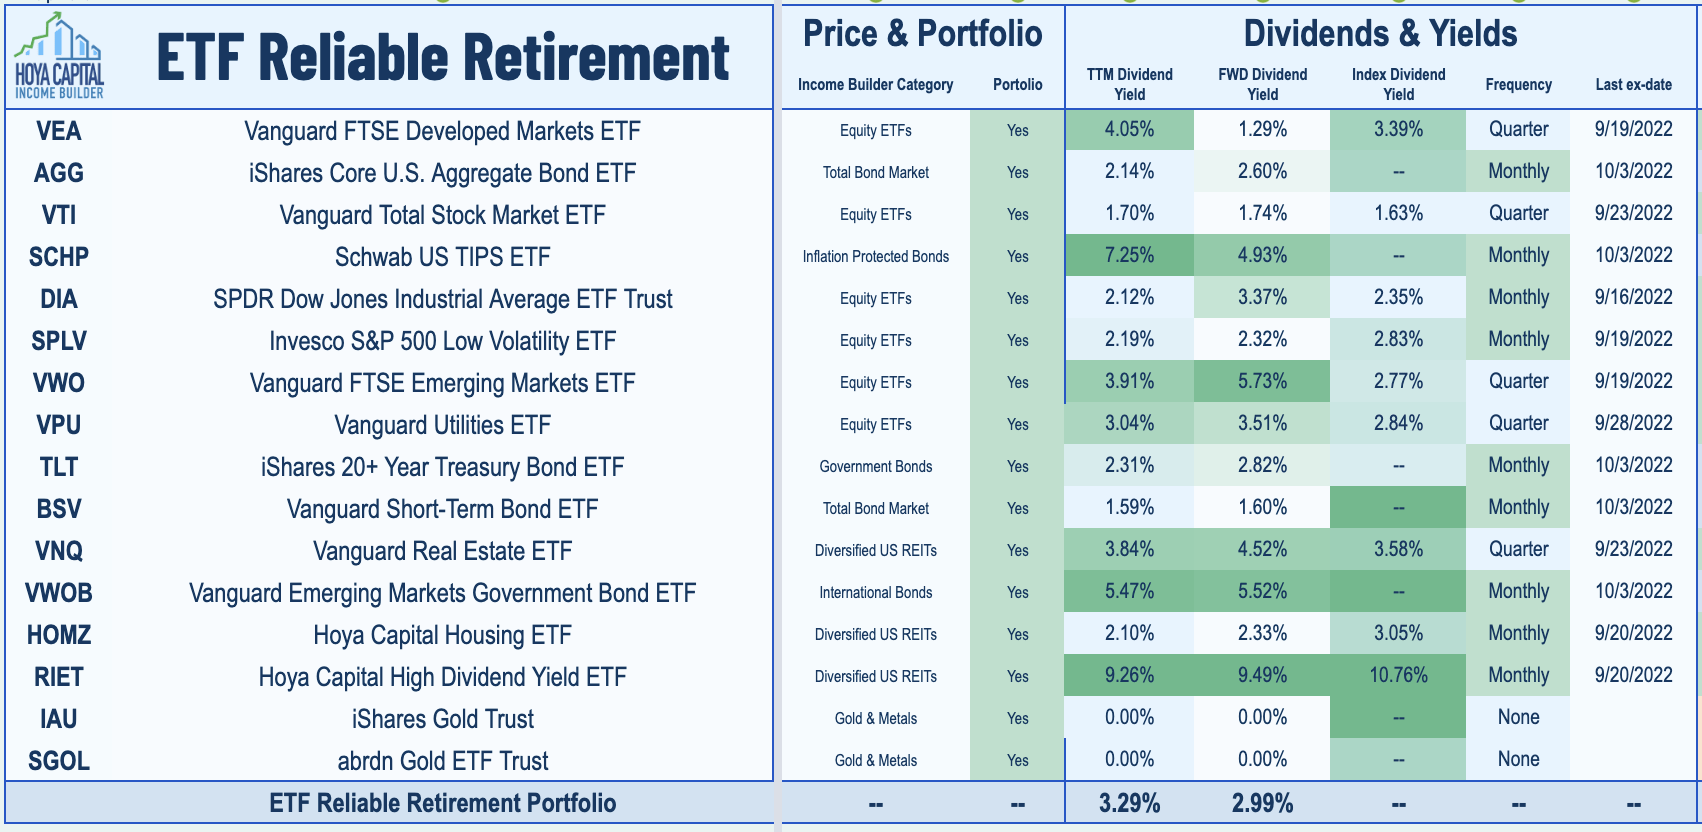
At a high level, the portfolio is comprised of five asset classes:
- U.S. Stocks
- Foreign Stocks
- Bonds/TIPS
- Real Estate
- Gold.
As a conclusion to this section, I might note that, while a high dividend level was not the primary focus of this portfolio, nine of the 14 dividend-producing ETFs pay dividends monthly, with the remaining five paying quarterly. The two gold-backed ETFs, of course, pay no dividends.
2022 Q3 Update: Where The Rubber Meets The Road
In the graphic below, I offer a comprehensive overview of how the ETFRRP has performed, compared with major U.S. market averages.
ETFRRP by ETF Monkey vs. Market Averages (Author-Generated Spreadsheet)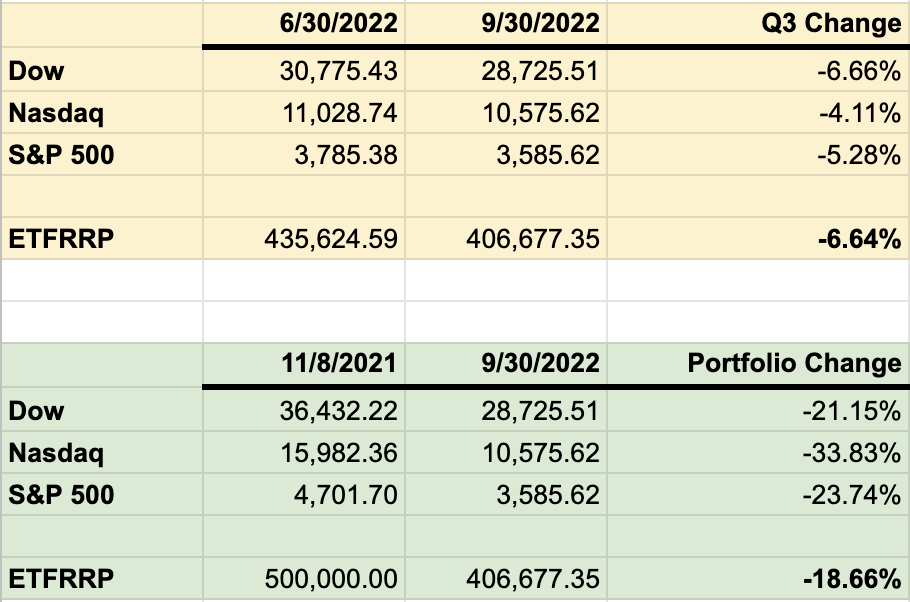
As can be seen, the ETFRRP declined by 6.64% during Q3. This roughly matched the performance of the Dow and was actually slightly worse than the S&P 500 and Nasdaq indexes.
In the second portion of the graphic, please notice that, instead of the more typical YTD results, I displayed the time period since the inception of the portfolio. Since the portfolio was so new, I didn’t write a formal report at year-end, and therefore did not capture the balance. However, I might note that the major averages were relatively flat during the period between 11/8/2021 and year-end.
In my Q2 update I also captured a nice tweet from Charlie Bilello charting the YTD performance of the classic 60/40 portfolio. At the time, he featured that this performance was the worst in over 40 years!
As it happens, Charlie has an update through the end of Q3. Here it is.
As can be seen, matters haven’t gotten any better. Given that, how did the ETFRRP do?
As a benchmark for evaluation, I ran a comparison in Portfolio Visualizer against the Vanguard Balanced Index, as represented by a mutual fund such as Vanguard Balanced Index Fund Admiral Shares (VBIAX). In the analysis, I set the flag to include, and reinvest, all dividends. Here are the results.
2022 Q3 Returns – ETFRRP vs. Vanguard Balanced Index (PortfolioVisualizer.com)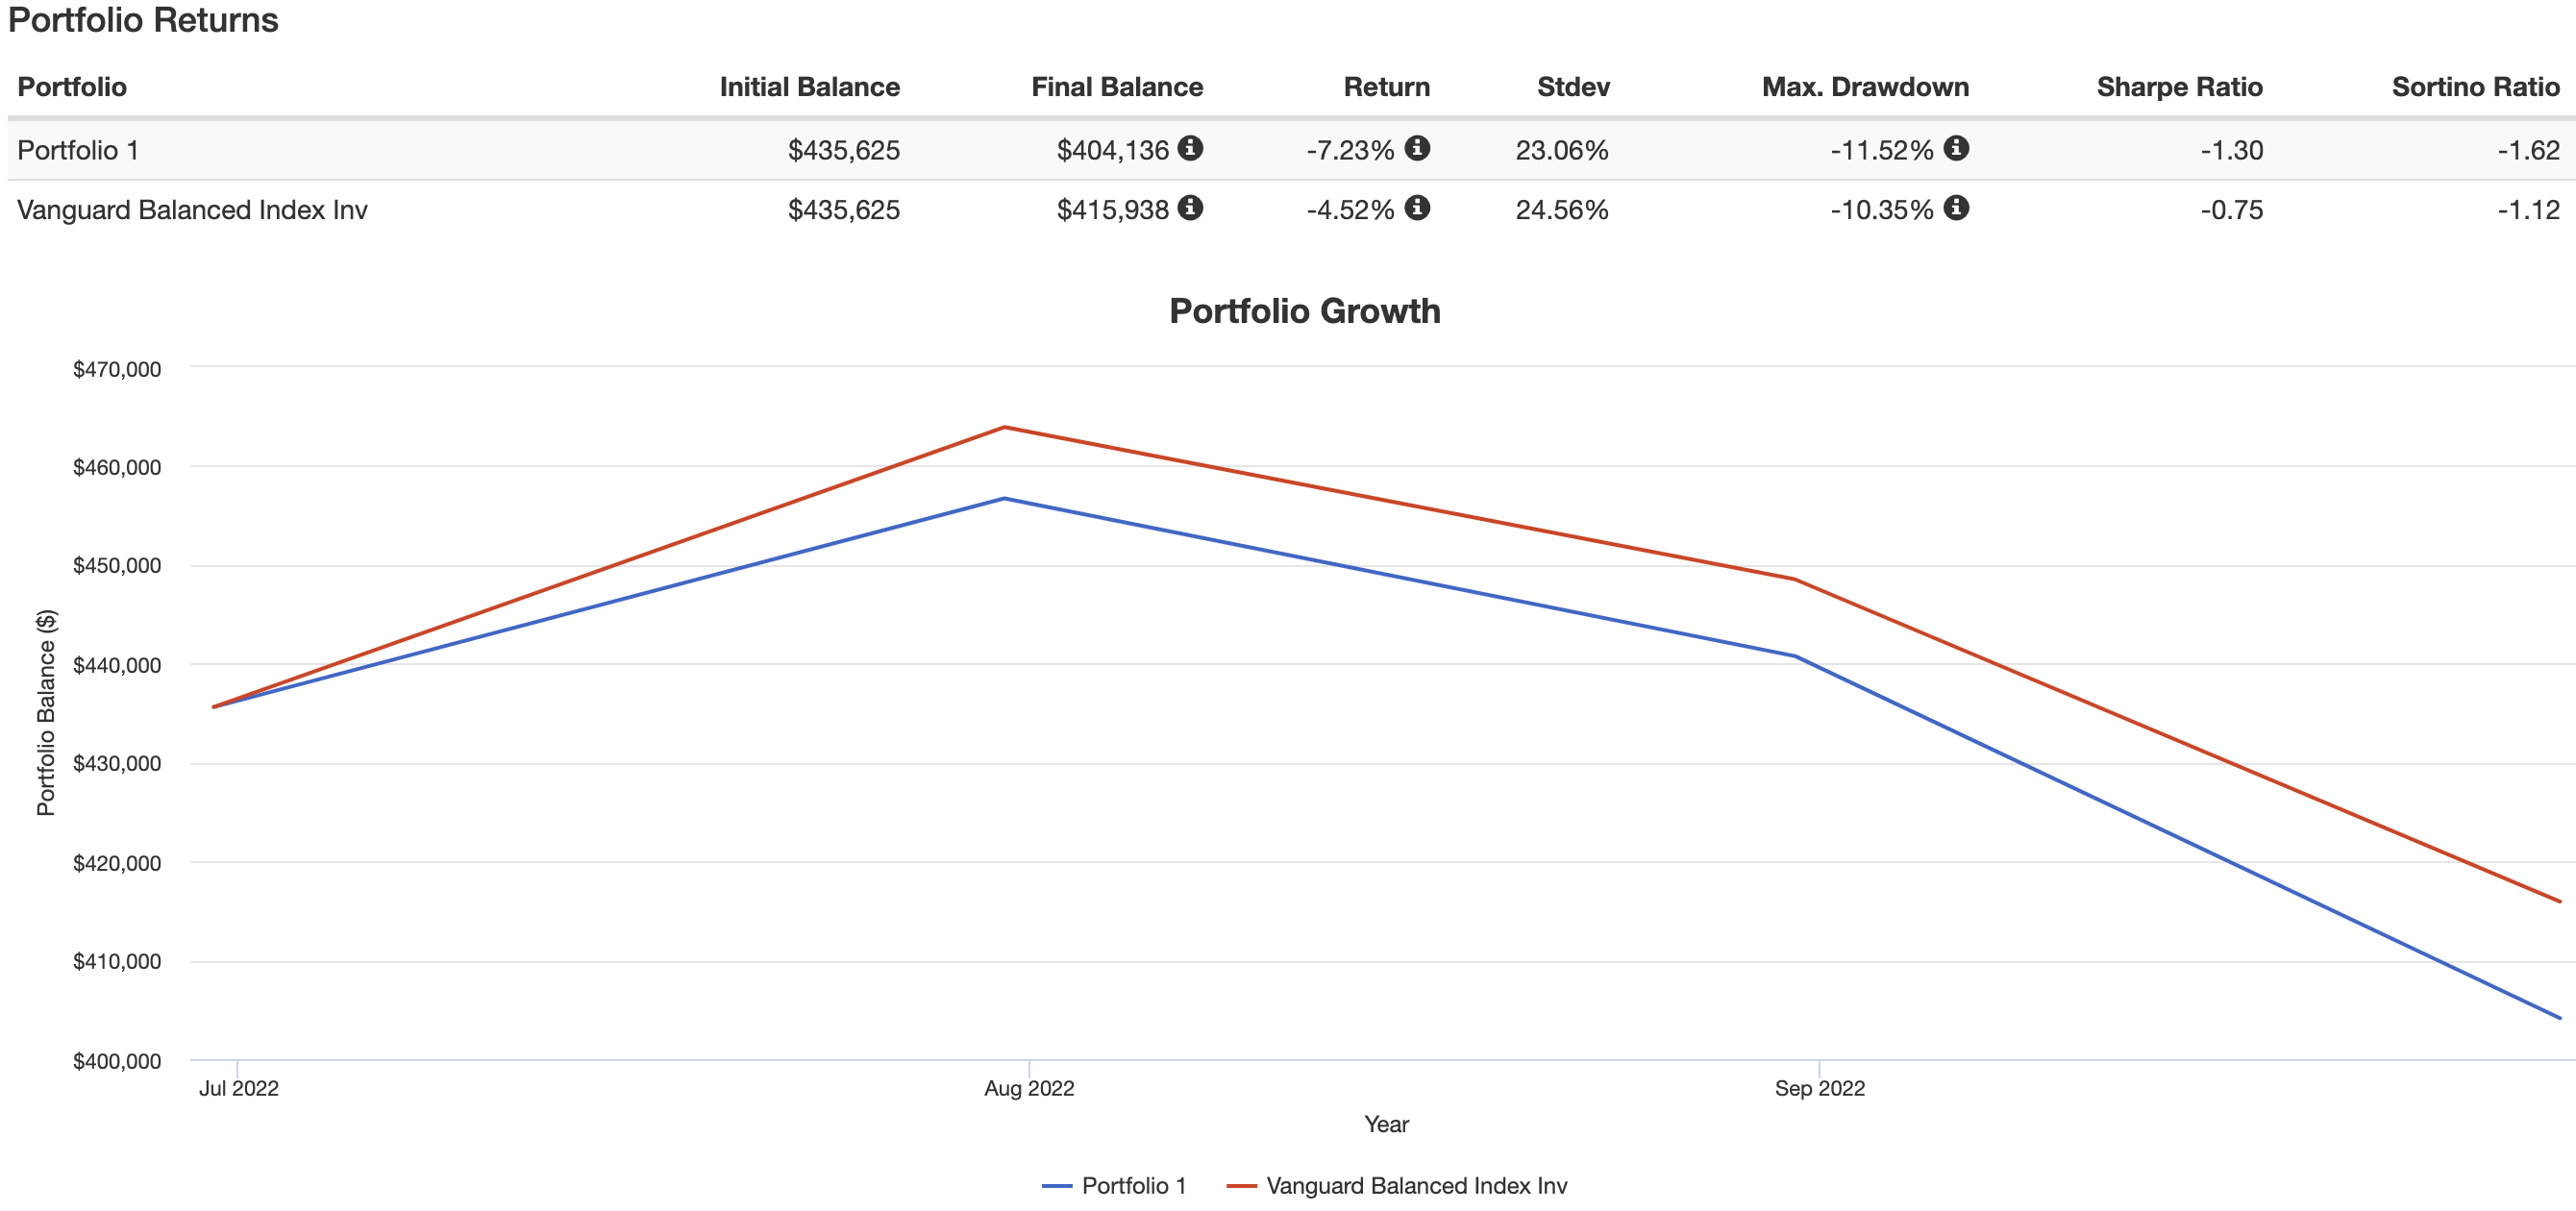
If you look carefully at the above, based on my Q2 starting point of $435,625, Portfolio Visualizer calculated an ending balance for the portfolio roughly $2,500 lower than my actual. During the quarter, I executed a couple of minor rebalancing transactions, as well as a couple of small profitable trading hunches. This accounts for the actual results being slightly better than what is shown here.
However, the simple fact remains that the ETFRRP underperformed this very relevant index. In short, the reason is that what I might refer to as the alternate asset classes I included in the portfolio—international stocks, real estate, and gold—all had a very difficult quarter.
Let’s break things down, then, by asset class.
U.S. Stocks
Overall, this section of the portfolio declined by roughly 5.8%.
As reflected in previous reports, overall, Invesco S&P 500 Low Volatility ETF (SPLV) and Vanguard Utilities ETF (VPU) have been my most prescient inclusions in the portfolio.
This is still the case. However, in my title, I called this report “the quarter everything collapsed.” While I will feature this even more dramatically when I discuss other asset classes, SPLV and VPU fell victim to this as well in Q3. SPLV declined by 6.72% and VPU declined by 6.62%, roughly in line with the Dow. As of the end of Q3, VPU finally lost the honor of being the only ETF in the portfolio in positive territory since inception, falling to 1.94% below my purchase price. However, both ETFs continued to generate handsome dividends, slightly offsetting the price declines.
Just one other note in this section. In my Q2 report, I featured the fact that I switched out of Vanguard Total Stock Market ETF (VTI) in favor of Vanguard S&P 500 ETF (VOO) based on the findings in a recent article I had written. In September, I made the decision to swap back in to VTI. I believe that, given the market’s sharp decline in late September, VTI may capture potential growth a little better moving forward.
Foreign Stocks
Overall, this section of the portfolio declined by roughly 11.32%.
The ongoing struggle between Russia and Ukraine has only intensified since the close of Q2. As a result, European economies are experiencing tremendous difficulty. Inflation, particularly in the Eurozone, is running at levels more or less parallel to the United States. Further, the strong U.S. dollar which, in turn, weakens other currencies, has been a drag.
As a result, my two ETFs of choice, Vanguard FTSE Developed Markets ETF (VEA) and Vanguard FTSE Emerging Markets ETF (VWO), experienced declines of 10.88% and 12.39%, respectively, over the period covered by this report.
At the same time, readers may be interested in my recent article VXUS: Past Performance Is No Guarantee Of Future Results. It offers a perspective that may at least be worth pondering.
Bonds/TIPS
Overall, this section of the portfolio declined by roughly 6.44%.
In various articles, including this recent example, I argue that bonds deserve at least some place in every portfolio. In this particular period, that advice has come with a cost. Let’s start with the 3 ETFs I selected for my bond allocation.
Over this period, Vanguard Short-Term Bond ETF (BSV), iShares Core U.S. Aggregate Bond ETF (AGG), and iShares 20+ Year Treasury Bond ETF (TLT) declined by 2.57%, 5.25%, and 10.81%, respectively.
In terms of TIPS, Schwab U.S. TIPS ETF (SCHP) declined by 7.17% during Q3. However, similar to Q2, SCHP has continued to pay a very high dividend, generating 2.07% in dividends during Q3, calculated against the balance as of the end of Q2.
Finally, I included a small weighting in Vanguard Emerging Markets Government Bond ETF (VWOB) in the portfolio, calling it “perhaps the most adventurous ETF in the portfolio.” After a stunning decline of 12.25% in Q2, VWOB stabilized somewhat in Q3, but still declined by an additional 6.22%. On the plus side, similar to SCHP this ETF has contributed a nice dividend, some 1.31% during Q3, calculated against the balance as of the end of Q2.
Real Estate
Overall, this section of the portfolio declined by roughly 11.35%.
Due to the substantial interest rate increases from the Fed in Q3, this asset class continued to get hit hard. My 3 selected ETFs experienced losses ranging from 5.45% to 15.61% in terms of price. On the plus side, together the 3 ETFs pulled in $481.20 in dividends in Q3, approximately 1.13% of the combined balance at the end of Q2.
Gold
Overall, this section of the portfolio declined by roughly 8.12%.
After a fairly strong performance through Q2, this asset class also became part of “the quarter everything collapsed.” Again, because of the sudden and sharp increases in interest rate, gold fell out of favor.
Summary and Outlook
In summary, the ETFRRP underperformed the Vanguard Balanced Index during Q3. As revealed in the breakdown by asset class detailed above, international stocks, real estate, and gold contributed to this underperformance.
Interestingly, a couple of months back, I wrote a fairly comprehensive summary of a recent note from Zoltan Pozsar, Investment Strategist at Credit Suisse.
Here is what I later wrote concerning what I was pondering, both for my personal portfolio as well as for the ETFRRP.
My takeaway is that the next key area I am watching for is right around 3,500-3,600. At 3,600, you have a 25% decline in the S&P.
. . . Bearing in mind that, as a retiree, I need to remain somewhat cautious with my allocation, I feel like I might be willing to move to 55% stocks at 3,600. Perhaps 56% at 3,400.
As it happens, the S&P index closed Q3 at exactly 3,585.62. Clearly, what I theorized based on my reading of Pozsar’s note, as well as other sources, came to pass.
However, I have changed my view slightly as to what I will likely do going forward. I currently plan to keep my stock allocation right around the 50% point barring a substantial further dip in the market.
In short, as a result of sharply higher interest rates, both cash and bonds, and in particular long-term bonds, are offering a nice alternative to stocks for the first time in many years.
I hope this summary has been educational. Please feel free to leave comments, questions, and even critique, in the comments section below.
Daniel Balakov/E+ via Getty Images
Be the first to comment