

jetcityimage
This article was co-produced with Dividend Sensei.
A recession is highly likely in 2023. How likely?
The bond market thinks we have a 100% probability of recession starting by July.
A January survey by Ernst & Young of 1,200 CEOs found that 98% expect a recession this year.
The FactSet consensus is that we’re in a mild six-month recession right now, and the Bloomberg consensus is that a mild recession begins in Q2 and lasts two quarters.
-
0% overall growth in 2023
-
the mildest recession in US history
-
the previous mildest was 2001’s -0.4% growth year.
That’s the good news. The bad news is that historically economists almost always underestimate recessions, so it’s possibly that negative growth this year could be worse.
But guess what?
A 2023 recession won’t hurt your retirement plan if your portfolio is diversified and packed full of Ultra SWAN (sleep-well-at-night) companies like Humana (NYSE:HUM).
Let me show you the three reasons why Humana is a wonderful fast-growing dividend Ultra SWAN that’s perfect not just for the 2023 recession, but for all future recessions.
In fact, as part of the fast-dividend growth part of your portfolio, Humana is a potential rich retirement dream stock.
Reason One: One Of The World’s Best Companies
Humana is a great fast-growth Ultra SWAN choice for this recession or any recession. In 2022, it was up 5% while the market fell 18%, and its historical beta is 0.47 (it falls about half as much as the broader market in most downturns).
Why?
Because this is a highly recession-resistant business and despite a strong rally in the past year, it remains a potentially good 2023 recession buy.
Here’s why.
Why You Can Trust Humana In This Recession
Founded in 1961 in Louisville, Kentucky, Humana is one of the largest insurance companies in America.
The company specializes in government-subsidized plans like Medicare Advantage, Medicaid, and Tricare (for the military).
It was founded to help the elderly, thus the focus on Medicare Advantage.
-
it was founded out of a nursing home.
The government pays companies like Humana the same as it does Medicare providers, and Humana’s incredible profitability is a testament to its:
-
high customer satisfaction
-
large scale
-
ability to drive down costs.
The company has become more vertically integrated over time, including buying some of its caregivers, such as Kindred at Home, in 2021.
-
the largest home health and hospice provider in the US
Vertical integration allows Humana better control over the quality of care and cost efficiency.
That vertical integration has also helped Humana achieve, maintain and grow its strong position in Tricare, Medicaid, and small-employer health insurance plans.
Management thinks it can sustain around 13.5% long-term growth due to its strong secular growth opportunities.
For example, Medicare Advantage alone has 64.3 million eligible potential enrollees today.
In 2022, HUM’s market share in Medicare Advantage was 48%, and management thinks it can get that to 60% by 2030. By 2030, an aging population will mean that about 20% of all Americans are eligible for Medicare Advantage, saving the US government money.
-
Thus they have the incentive to drive as many people to it as possible
Medicare Advantage isn’t just about costs; studies show that these plans result in 43% lower avoidable hospitalizations.
-
In 2022 the average cost to hospitalize an elderly American was $12,800…per day
Value-based care, in which compensation is tied to good outcomes, is the new gold standard that the Centers for Medicare and Medicaid Services, or CMS, strive for.
Humana’s value-based care results are industry-leading, including:
-
12% fewer ER trips ($2,200 cost on average)
-
245,000 fewer daily hospital bed stays ($13,000 per day)
-
$500 annual savings for family members
-
higher customer satisfaction
And guess what? Good service and superior results don’t come at a cost to Humana. Its value based-care plans bring in 20% higher margins.
-
HUM’s interests are aligned with those of subscribers and the government
Its preventative medicine compliance on cancer screenings and diabetes and cholesterol control medications is 81% to 97%. That’s why national insurance rating agencies rate HUM 98% compared to 86% for its national peers.
What does that mean for customers? An additional 900,000 preventative screenings over the last five years, saving thousands of lives.
It also saved the healthcare industry (including the government) over $5.5 billion. And that was just with 2 million average customers.
-
If all 64 million eligible people were using Humana value-based care plans, the cost savings would have been about $182 billion
The government loves Humana for saving it money. Companies love Humana for saving money. The military loves Humana for running Tricare so effectively. And customers love Humana for its excellent service and great outcomes. Humana, in 2022, was ranked the best health insurance company in America by JD Power and Forrester Research and #2 by JD Power in US mail-order pharmacy.
In other words, Humana’s cost efficiency doesn’t come at the cost of good care. Its cost efficiency and incredible profitability are because of its superior care, which saves lives and money.
-
Historical profitability for Humana is in the top 10% of its peers.
This superior quality and lower costs are why Humana has been growing at 11.4% annually since 2017, compared to 9.1% for the industry.
How big is HUM’s addressable market? About $1.32 TRILLION. It currently has $103 billion in revenue. That’s 7.8% total market share, and yet it’s an industry leader
-
a decades-long growth runway
Management aims to drive 1% to 2% annual EPS growth through cost savings, and its track record has been very good.
Humana Is One Of The World’s Best Companies
Humana Dividend Safety
|
Rating |
Dividend Kings Safety Score (250 Point Safety Model) |
Approximate Dividend Cut Risk (Average Recession) |
Approximate Dividend Cut Risk In Pandemic Level Recession |
|
1 – unsafe |
0% to 20% |
over 4% |
16+% |
|
2- below average |
21% to 40% |
over 2% |
8% to 16% |
|
3 – average |
41% to 60% |
2% |
4% to 8% |
|
4 – safe |
61% to 80% |
1% |
2% to 4% |
|
5- very safe |
81% to 100% |
0.5% |
1% to 2% |
|
HUM |
100% |
0.5% |
1.00% |
|
Risk Rating |
Very Low Risk (93rd S&P Global percentile risk-management) |
BBB+ Stable Outlook credit rating = 5% 30-year bankruptcy risk |
20% or less max risk cap |
Long-Term Dependability
|
Company |
DK Long-Term Dependability Score |
Interpretation |
Points |
|
Non-Dependable Companies |
20% or below |
Poor Dependability |
1 |
|
Low Dependability Companies |
21% to 39% |
Below-Average Dependability |
2 |
|
S&P 500/Industry Average |
40% to 59% |
Average Dependability |
3 |
|
Above-Average |
60% to 79% |
Dependable |
4 |
|
Very Good |
80% or higher |
Very Dependable |
5 |
|
HUM |
100% |
Very Dependable |
5 |
Overall Quality
|
HUM |
Final Score |
Rating |
|
Safety |
100% |
5/5 very safe |
|
Business Model |
90% |
3/3 wide moat |
|
Dependability |
100% |
5/5 very dependable |
|
Total |
97% |
13/13 Ultra SWAN |
|
Risk Rating |
5/5 Very Low Risk |
|
|
5% OR LESS Max Risk Cap Rec |
20% Margin of Safety For A Potentially Good Buy |
How high quality is Humana?
Its average dividend cut risk in a recession is about 0.5%, courtesy of a 12% payout ratio.
Its average risk during a Great Recession or Pandemic level crash is about 1%.
It’s the 101st highest-quality company on the DK 500 Master List.
The Dividend Kings 500 Master List includes some of the world’s best companies, including:
-
every dividend champion (25+ year dividend growth streaks, including foreign aristocrats)
-
every dividend aristocrat
-
every dividend king (50+ year dividend growth streaks)
-
every Ultra SWAN (as close to perfect quality companies as exist)
-
the 20% highest quality REITs according to iREIT
-
40 of the world’s best growth blue-chips
Among the world’s most elite companies, HUM is in the top 20%, truly a world-beater Ultra SWAN you can trust…in any economy.
Humana 2025 Consensus Total Return Potential
FAST Graphs 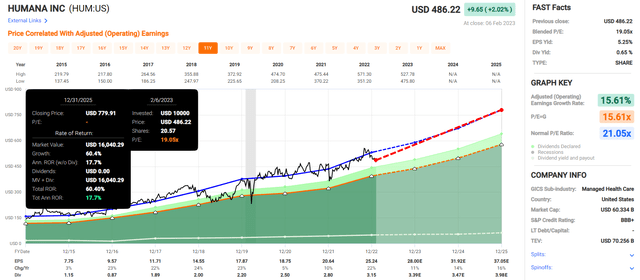
If HUM grows as expected and returns to fair value by 2025, it could deliver 60% returns or 18% annually.
Humana 2029 Consensus Total Return Potential
FAST Graphs 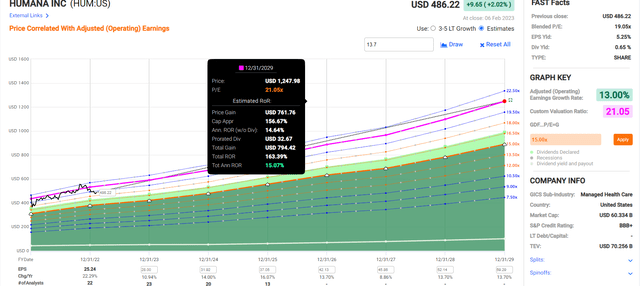
Over the next six years, HUM could deliver 163% total returns or 15% annually.
-
3X the S&P 500 total return consensus
Humana Investment Decision Score
Dividend Kings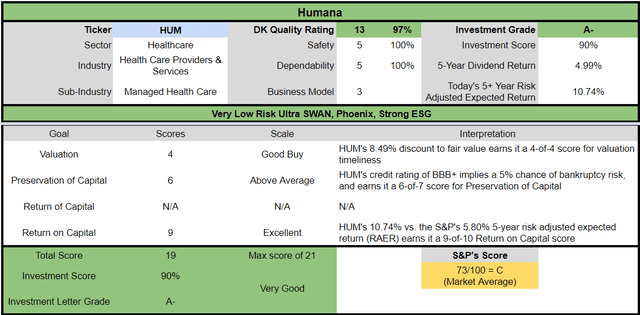
Compared to the S&P, HUM is a potentially very good dividend growth Ultra SWAN opportunity. Look how it compares to the market.
-
9% undervalued vs. 6% S&P overvaluation
-
0.7% very safe yield vs. 1.7% (but much safer and faster growing)
-
14.4% CAGR consensus return potential vs. 10.2% S&P
-
almost 100% higher risk-adjusted returns
Reason Two: Double-Digit Growth Potential for Decades To Come
What kind of growth do analysts expect from HUM over the next few years?
|
Metric |
2022 Growth |
2023 Growth Consensus |
2024 Growth Consensus |
2025 Growth Consensus |
|
Sales |
14% |
11% |
9% |
11% |
|
Dividend |
13% |
8% |
2% |
15% |
|
EPS |
22% |
11% |
14% |
16% |
|
Operating Cash Flow |
50% |
50% |
11% |
13% |
|
Free Cash Flow |
145% |
58% |
28% |
3% |
|
Book Value |
39% |
-13% |
16% |
23% |
(Source: FAST Graphs, FactSet)
Double-digit earnings growth through a recession? Yes, if you’re a defensive Ultra SWAN like Humana.
What about long-term growth? Management says they can deliver 11% to 15% long-term growth. So what do the 26 analysts that cover Humana think?
Humana Long-Term Growth Outlook
The median long-term growth consensus from all 26 analysts is 13.7%, the mid-range of management guidance. How accurate are analysts at forecasting HUM’s growth?
Within a reasonable margin of error, HUM hasn’t missed growth estimates in a decade. In fact, it beats them by 20+% 33% of the time.
Smoothing for outliers, the historical analyst margins-of-error are 10% to the downside and 20% to the upside.
-
11% to 16% margin-of-error adjusted growth consensus range
HUM’s growth rates over the last 20 years have ranged from 10% to 22% annually, and 11% to 15% growth guidance given a $1.3 trillion addressable market and 8% market share is reasonable.
Long-Term Total Return Consensus
|
Investment Strategy |
Yield |
LT Consensus Growth |
LT Consensus Total Return Potential |
Long-Term Risk-Adjusted Expected Return |
|
Humana |
0.7% |
13.7% |
14.4% |
10.1% |
|
ZEUS Income Growth (My family hedge fund) |
4.1% |
9.3% |
13.4% |
9.4% |
|
Schwab US Dividend Equity ETF |
3.6% |
8.6% |
12.2% |
8.5% |
|
Vanguard Dividend Appreciation ETF |
2.2% |
10.0% |
12.2% |
8.5% |
|
Nasdaq |
0.8% |
10.9% |
11.7% |
8.2% |
|
Dividend Aristocrats |
1.9% |
8.5% |
10.4% |
7.3% |
|
S&P 500 |
1.7% |
8.5% |
10.2% |
7.1% |
|
REITs |
3.9% |
6.1% |
10.0% |
7.0% |
|
60/40 Retirement Portfolio |
2.1% |
5.1% |
7.2% |
5.0% |
(Source: DK Research Terminal, FactSet, Morningstar)
HUM offers Nasdaq beating 14% to 15% long-term return potential with Ultra SWAN safety.
Total Returns Since 1985
Since 1985 HUM has delivered 13.5% annual returns, turning $1 into $117.
-
$1 into $42 adjusted for inflation vs. $18 for the S&P 500
Its average 12-month rolling return is a Buffett-like 20% annually.
Inflation-Adjusted Consensus Total Return Forecast: $1,000 Initial Investment
|
Time Frame (Years) |
7.9% CAGR Inflation-Adjusted S&P 500 Consensus |
12.1% CAGR Inflation-Adjusted HUM Consensus |
Difference Between Inflation-Adjusted HUM Consensus And S&P Consensus |
|
5 |
$1,465.25 |
$1,773.38 |
$308.13 |
|
10 |
$2,146.96 |
$3,144.89 |
$997.93 |
|
15 |
$3,145.84 |
$5,577.10 |
$2,431.26 |
|
20 |
$4,609.44 |
$9,890.34 |
$5,280.89 |
|
25 |
$6,753.99 |
$17,539.36 |
$10,785.37 |
|
30 |
$9,896.29 |
$31,104.02 |
$21,207.73 |
(Source: DK Research Terminal, FactSet)
Over the next 30 years, HUM could be a 31X bagger, adjusted for inflation, turning $1000 today into $31K over an investing lifetime.
|
Time Frame (Years) |
Ratio Inflation-Adjusted HUM Consensus vs. S&P consensus |
|
5 |
1.21 |
|
10 |
1.46 |
|
15 |
1.77 |
|
20 |
2.15 |
|
25 |
2.60 |
|
30 |
3.14 |
(Source: DK Research Terminal, FactSet)
That’s triple the return potential of the S&P and with Ultra SWAN quality.
Reason Three: A Wonderful Company At A Fair Price
Tens of millions of income investors have paid between 16.5X earnings and 21X earnings for HUM outside of bear markets and bubbles for twenty years while it was growing at today’s rates.
-
91% statistical probability that this approximates intrinsic value
|
Metric |
Historical Fair Value Multiples (11-year) |
2022 |
2023 |
2024 |
2025 |
2026 |
12-Month Forward Fair Value |
|
13-Year Median Yield |
0.66% |
$472.73 |
$477.27 |
$477.27 |
$603.03 |
NA |
NA |
|
Earnings |
21.05 |
$531.30 |
$590.45 |
$670.86 |
$779.06 |
$877.36 |
NA |
|
Average |
$500.31 |
$527.86 |
$557.75 |
$679.84 |
$877.36 |
$531.31 |
|
|
Current Price |
$486.22 |
||||||
|
Discount To Fair Value |
2.82% |
7.89% |
12.82% |
28.48% |
44.58% |
8.49% |
|
|
Upside To Fair Value (NOT Including Dividends) |
2.90% |
8.56% |
14.71% |
39.82% |
80.45% |
9.92% |
|
|
2023 EPS |
2024 EPS |
2022 Weighted EPS |
2023 Weighted EPS |
12-Month Forward EPS |
12-Month Average Fair Value Forward PE |
Current Forward PE |
Cash-Adjusted PE |
|
$28.05 |
$31.87 |
$24.81 |
$3.68 |
$28.49 |
18.6 |
17.1 |
10.4 |
HUM is historically worth about 18.6X earnings and today trades at a 9% discount at 17.1X. Adjusted for cash, its PE is 10.4.
-
0.76X cash-adjusted PEG
-
Ultra SWAN growth at a very reasonable price
|
Rating |
Margin Of Safety For Very Low-Risk 13/13 Ultra SWAN Quality Companies |
2023 Fair Value Price |
2024 Fair Value Price |
12-Month Forward Fair Value |
|
Potentially Reasonable Buy |
0% |
$527.86 |
$557.75 |
$531.31 |
|
Potentially Good Buy |
5% |
$501.47 |
$529.86 |
$504.75 |
|
Potentially Strong Buy |
15% |
$448.68 |
$474.09 |
$451.62 |
|
Potentially Very Strong Buy |
25% |
$376.10 |
$418.31 |
$398.48 |
|
Potentially Ultra-Value Buy |
35% |
$343.11 |
$362.54 |
$345.35 |
|
Currently |
$486.22 |
7.89% |
12.82% |
8.49% |
|
Upside To Fair Value (Including Dividends) |
9.21% |
15.36% |
9.92% |
Humana is a potentially good buy for anyone comfortable with its risk profile.
Risk Profile: Why Humana Isn’t Right For Everyone
There are no risk-free companies, and no company is right for everyone. You have to be comfortable with the fundamental risk profile.
Humana Risk Profile Summary
“We see medium uncertainty around Humana’s future cash flows in the long run, as policy risks may never fully evaporate until universal, affordable coverage is achieved in the U.S.
From a concentration perspective, nearly 90% of the firm’s nonmilitary medical membership (excluding stand-alone Medicare Part D drug plans) is tied to government funding. While that exposes Humana to changes in federal and state budget priorities, this exposure is currently a positive factor, especially as the Medicare Advantage population continues to rise and represents one of the strongest growth areas in the industry.
However, potential healthcare policy changes could create ESG-related risks for Humana, especially during future election cycles, as access to universal, affordable coverage remains a key concern of the American public. For example, the Medicare for All scenario debated in the lead-up to the Democratic primaries in 2020 called for eliminating the private insurance industry, which would have threatened most of the company’s operations. While we view the probability of a Medicare for All-like scenario as virtually zero in the foreseeable future, other policy risks may threaten private insurer economic profit margins in future election cycles. After nearly universal coverage levels are reached, we would look for regulators to focus on reducing healthcare inflation rates, perhaps by cutting into MCO profits. However, given how slow the U.S. may be at reaching nearly universal coverage, we think that significant margin compression appears to be a very long-term risk.“ – Morningstar
Humana Risk Profile Includes
-
regulatory risk (Medicare for All would require a completely new business model)
-
margin compression risk (a long-term risk based on reducing medical inflation ratios)
-
M&A acquisition risk
-
operational risk (for care providers it owns, like Kindred)
-
geographic risk: unlike UNH, HUM is a 100% US-focused insurance company
The medium-term risks for something like Medicare for all are very low, essentially zero.
Over the last 20 years, the medical industry has spent over $4 billion lobbying congress to prevent single payer.
-
$616 billion in 2022 alone
Money talks in DC, and even when Democrats had a 60-seat Senate majority to pass the ACA (Obamacare), they couldn’t even get a public option passed.
And given that the UK, Canada, and the Nordic countries are the only countries in the world with single payer, it’s likely that any universal healthcare reform would still allow HUM to survive, just likely growing at a slower rate.
-
Germany, France, and Switzerland all have public-private partnerships for health insurance.
That’s not to say that regulatory fears can’t cause HUM stock to plunge. During the 2000 Medicare/Medicaid reforms, which caused the “SNF apocalypse”, HUM fell 84% over two years.
It took 6.5 years for investors who bought in 1998 to break even.
How do we quantify, monitor, and track such a complex risk profile? By doing what big institutions do.
Long-Term Risk Management Analysis: How Large Institutions Measure Total Risk Management
DK uses S&P Global’s global long-term risk-management ratings for our risk rating.
-
S&P has spent over 20 years perfecting their risk model
-
which is based on over 30 major risk categories, over 130 subcategories, and 1,000 individual metrics
-
50% of metrics are industry specific
-
this risk rating has been included in every credit rating for decades
The DK risk rating is based on the global percentile of how a company’s risk management compares to 8,000 S&P-rated companies covering 90% of the world’s market cap.
HUM scores 93rd Percentile On Global Long-Term Risk Management
S&P’s risk management scores factor in things like:
-
supply chain management
-
crisis management
-
cyber-security
-
privacy protection
-
efficiency
-
R&D efficiency
-
innovation management
-
labor relations
-
talent retention
-
worker training/skills improvement
-
occupational health & safety
-
customer relationship management
-
business ethics
-
climate strategy adaptation
-
sustainable agricultural practices
-
corporate governance
-
brand management
-
regulatory risk management
HUM’s Long-Term Risk Management Is The 67th Best In The Master List 87th Percentile In The Master List)
|
Classification |
S&P LT Risk-Management Global Percentile |
Risk-Management Interpretation |
Risk-Management Rating |
|
BTI, ILMN, SIEGY, SPGI, WM, CI, CSCO, WMB, SAP, CL |
100 |
Exceptional (Top 80 companies in the world) |
Very Low Risk |
|
Humana |
93 |
Exceptional |
Very Low Risk |
|
Strong ESG Stocks |
86 |
Very Good |
Very Low Risk |
|
Foreign Dividend Stocks |
77 |
Good, Bordering On Very Good |
Low Risk |
|
Ultra SWANs |
74 |
Good |
Low Risk |
|
Dividend Aristocrats |
67 |
Above-Average (Bordering On Good) |
Low Risk |
|
Low Volatility Stocks |
65 |
Above-Average |
Low Risk |
|
Master List average |
61 |
Above-Average |
Low Risk |
|
Dividend Kings |
60 |
Above-Average |
Low Risk |
|
Hyper-Growth stocks |
59 |
Average, Bordering On Above-Average |
Medium Risk |
|
Dividend Champions |
55 |
Average |
Medium Risk |
|
Monthly Dividend Stocks |
41 |
Average |
Medium Risk |
(Source: DK Research Terminal)
HUM’s risk-management consensus is in the top 13% of the world’s best blue chips and is similar to:
-
Medtronic (MDT): Ultra SWAN dividend aristocrat
-
Sanofi (SNY): Ultra SWAN global dividend aristocrat
-
ASML Holding (ASML): Ultra SWAN
-
Bank of Montreal (BMO): Ultra SWAN
-
Caterpillar (CAT): Ultra SWAN dividend aristocrat
The bottom line is that all companies have risks, and HUM is exceptional at managing theirs, according to S&P.
How We Monitor HUM’s Risk Profile
-
26 analysts,
-
four credit rating agencies
-
30 experts who collectively know this business better than anyone other than management
-
the bond market for real-time fundamental risk assessment
“When the facts change, I change my mind. What do you do, sir?”
– John Maynard Keynes
There are no sacred cows at iREIT or Dividend Kings. Wherever the fundamentals lead, we always follow. That’s the essence of disciplined financial science, the math behind retiring rich and staying rich in retirement.
Bottom Line: Humana Is A 2023 Recession Ultra SWAN Buy With A $1.3 Trillion Growth Opportunity
Let me be clear: I’m NOT calling the bottom in HUM (I’m not a market-timer).
13/13 Ultra SWAN quality does NOT mean “can’t fall hard and fast in a bear market.”
Fundamentals are all that determine safety and quality, and my recommendations.
-
over 30+ years, 97% of stock returns are a function of pure fundamentals, not luck
-
in the short term; luck is 25X as powerful as fundamentals
-
in the long term, fundamentals are 33X as powerful as luck.
While I can’t predict the market in the short term, here’s what I can tell you about HUM.
-
top 20% of the world’s best blue-chips by quality (world-beater)
-
11-year dividend growth streak
-
very safe 0.7% yield (1% severe recession risk cut and fast-growing)
-
14.4% long-term return potential Vs. 10.2% S&P
-
9% historically undervalued
-
17.1X earnings vs. 16.5 to 21 historical
-
10.4X cash-adjusted earnings = 0.76 PEG
-
163% consensus return potential over the next six years, 15% annually, 3X more than the S&P 500
-
100% better risk-adjusted expected returns
If you own Ultra SWANs like Humana, you never have to worry about the Fed, interest rates, or the economy.
You can laugh at bear markets, knowing your hard-earned savings are managed by some of the most adaptable and skilled risk-managers on earth.
If you’re tired of praying for luck on Wall Street, it’s time to take charge of your financial destiny and make your own luck.
Because when you buy a fast-growing Ultra SWAN like this, retiring rich isn’t a matter of luck, just time and patience.
Be the first to comment