

KTStock/iStock via Getty Images
A bit over six years ago, I wrote an extremely controversial article titled “How to Quit Working In 5 Years With $330,000 In Savings”. The premise was very simple, involving a hypothetical well-educated young entrant to the working world, earning $70,000 in her first year ($86,406.05 in today’s dollars).
The hypothetical worker, let’s call her Jane, could then save 65% of her income by living extremely frugally and, with an 8.2% annualized return, spend five years working and saving to earn a hypothetical passive income stream from a portfolio of four stocks (three CEFs and one BDC) to earn that 8.2% in passive income.
Each of these steps had some built-in assumptions that readers challenged, with doubt that an 8.2% annualized return would be possible over five years being the greatest concern of them all.
If Jane had read my article and taken my advice, would she be financially independent now? Would she have been better off if she’d just stuck to index funds and avoided income investing altogether? Today I want to revisit my old argument, the assumptions behind it, and see whether my advice back then would have resulted in financial freedom or disaster.
Assumption #1: Saving 65% of Income is Possible
In my original article, I proposed a $70,000 income earner spend just $24,000 per year ($29,625 in today’s dollars) to cover basic living expenses.
It seems that not only is it possible to get by on $29,625 per year in San Francisco today for a single young person, it’s still possible to get by on $24,000 per year.
|
Monthly |
|
|
Rent |
$1,000.00 |
|
Food |
$299.20 |
|
Transportation |
$150.00 |
|
Utilities |
$200.00 |
|
Entertainment |
$400.00 |
|
Other |
$350.00 |
|
TOTAL |
$2,399.20 |
Note the generous $750 budgeted for this person’s entertainment and other expenses, whereas food is amply covered (this amount is the cost for someone on a thrifty diet according to the USDA), and the $1,000 in rent is decent for a room in the city, if I can trust the ads on Craigslist. I suspect $200 for utilities, including a mobile phone, is overly cautious, while the $150 in transportation costs might be too conservative for a worker who needs a car to commute (many of the young urban professionals who fit Jane’s mould have no need for a car, however).
While saving 65% of after-tax income for a first-year professional is not comfortable, it is clearly not impossible.
Assumption #2: A 2% Inflation Rate would Remain in Place
This was one that I got very right until it went very, very wrong.
YCharts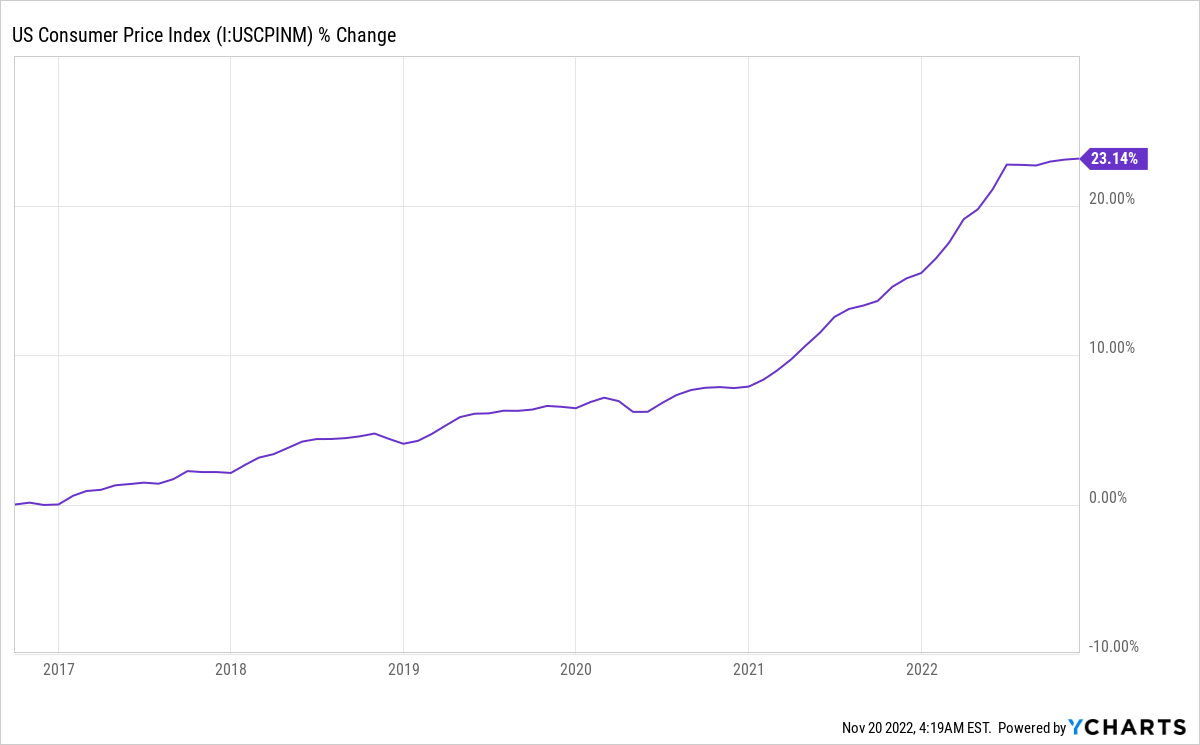
While inflation rates have soared to over 8% in 2022, completely scotching the idea of a stable 2% inflation rate in the future, the CAGR from the date of my article to today has been much kinder. With just an overall increase of 3.5%, inflation had been more manageable in the past than today.
Fortunately, this is pretty easy to fix. We can adjust our original model for Jane’s future passive income needs from this:
Author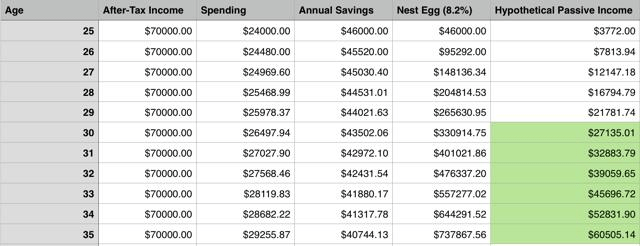
To this:
|
Age |
After-Tax income |
Spending |
Annual Savings |
Nest Egg (8.2%) |
Hypothetical Passive Income |
|
25 |
$70,000 |
$24,000 |
$46,000 |
$46,000 |
$3,772 |
|
26 |
$70,000 |
$24,840 |
$45,160 |
$94,932 |
$7,784 |
|
27 |
$70,000 |
$25,709 |
$44,291 |
$147,007 |
$12,055 |
|
28 |
$70,000 |
$26,609 |
$43,391 |
$202,452 |
$16,601 |
|
29 |
$70,000 |
$27,541 |
$42,459 |
$261,513 |
$21,444 |
|
30 |
$70,000 |
$28,504 |
$41,496 |
$324,453 |
$26,605 |
|
31 |
$70,000 |
$29,502 |
$40,498 |
$391,555 |
$32,108 |
|
32 |
$70,000 |
$30,535 |
$39,465 |
$463,128 |
$37,977 |
|
33 |
$70,000 |
$31,603 |
$38,397 |
$539,501 |
$44,239 |
|
34 |
$70,000 |
$32,710 |
$37,290 |
$621,031 |
$50,925 |
|
35 |
$70,000 |
$33,854 |
$36,146 |
$708,101 |
$58,064 |
|
36 |
$70,000 |
$35,039 |
$34,961 |
$801,126 |
$65,692 |
Now we see that financial independence is now delayed by less than one year thanks to a shortfall of $1,899 in income per year ($158.25 per month), although that is surmounted if we can get an 8.8% overall yield or if our annualized return from the years of working.
By backtesting our model against market returns, we see that there is no need to reach for yield and that Jane would have achieved financial independence significantly faster than I had projected.
Assumption #3: An 8.2% Annualized Return is Possible
Since my article was published, the S&P 500 has delivered an annualized return of 12.2%:
YCharts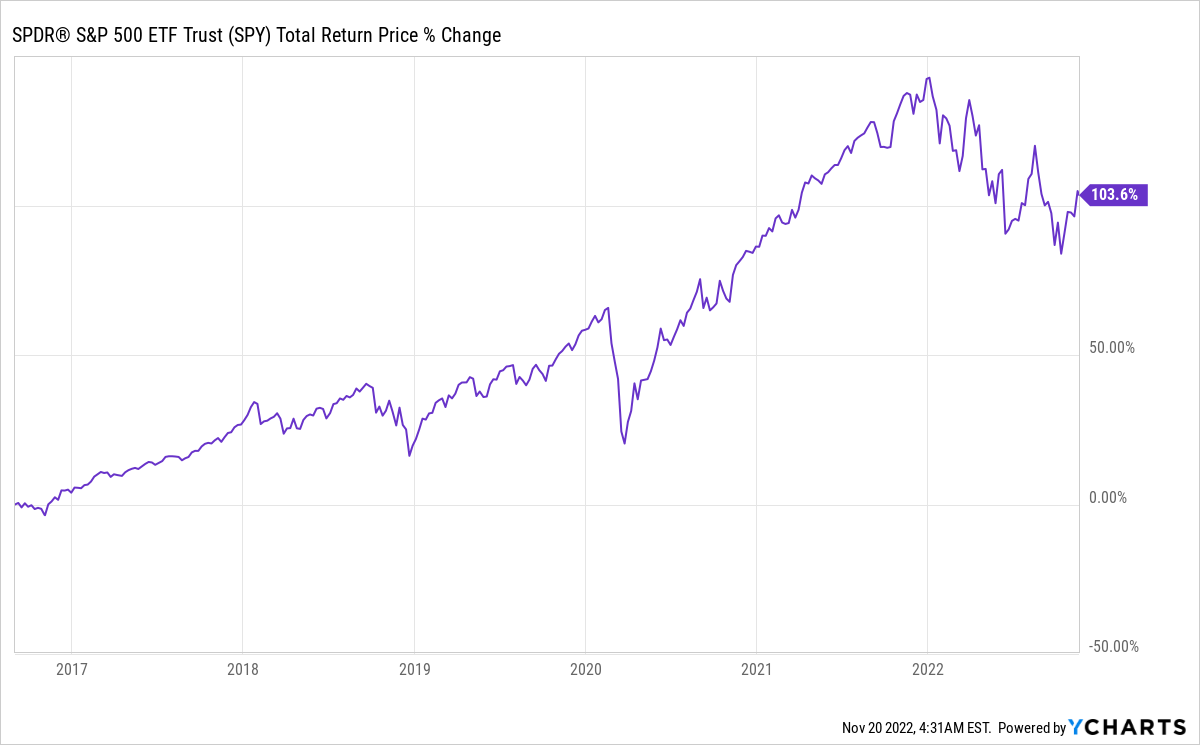
If we plug those numbers into our new model, we find that our worker has reached financial independence about a year and a half earlier than originally projected:
|
Age |
After-Tax income |
Spending |
Annual Savings |
Nest Egg (12.2%) |
Hypothetical Passive Income |
|
25 |
$70,000 |
$24,000 |
$46,000 |
$46,000 |
$3,772 |
|
26 |
$70,000 |
$24,840 |
$45,160 |
$96,772 |
$7,935 |
|
27 |
$70,000 |
$25,709 |
$44,291 |
$152,869 |
$12,535 |
|
28 |
$70,000 |
$26,609 |
$43,391 |
$214,910 |
$17,623 |
|
29 |
$70,000 |
$27,541 |
$42,459 |
$283,588 |
$23,254 |
|
30 |
$70,000 |
$28,504 |
$41,496 |
$359,681 |
$31,652 |
|
31 |
$70,000 |
$29,502 |
$40,498 |
$444,060 |
$36,413 |
|
32 |
$70,000 |
$30,535 |
$39,465 |
$537,701 |
$44,091 |
|
33 |
$70,000 |
$31,603 |
$38,397 |
$641,697 |
$52,619 |
|
34 |
$70,000 |
$32,710 |
$37,290 |
$757,274 |
$62,097 |
|
35 |
$70,000 |
$33,854 |
$36,146 |
$885,808 |
$72,636 |
|
36 |
$70,000 |
$35,039 |
$34,961 |
$1,028,837 |
$84,365 |
It is worth noting that this is taking into account the bear market of 2022. If we don’t smooth out returns and distribute them evenly over our time period and look at actual market returns, we see not only that Jane reached financial independence a few months earlier, but also that she was able to have a surplus nest egg than what she needs by a massive margin:
|
Age |
After-Tax income |
Spending |
Annual Savings |
Nest Egg at Real S&P 500 Annual Returns |
Hypothetical Passive Income |
|
25 |
$70,000 |
$24,000 |
$46,000 |
$46,000 |
$3,772 |
|
26 |
$70,000 |
$24,840 |
$45,160 |
$100,093 |
$8,208 |
|
27 |
$70,000 |
$25,709 |
$44,291 |
$138,138 |
$11,327 |
|
28 |
$70,000 |
$26,609 |
$43,391 |
$221,423 |
$18,157 |
|
29 |
$70,000 |
$27,541 |
$42,459 |
$299,886 |
$24,591 |
|
30 |
$70,000 |
$28,504 |
$41,496 |
$422,021 |
$34,606 |
|
31 |
$70,000 |
$29,502 |
$40,498 |
$391,619 |
$32,113 |
|
32 |
$70,000 |
$30,535 |
$39,465 |
||
|
33 |
$70,000 |
$31,603 |
$38,397 |
||
|
34 |
$70,000 |
$32,710 |
$37,290 |
||
|
35 |
$70,000 |
$33,854 |
$36,146 |
||
|
36 |
$70,000 |
$35,039 |
$34,961 |
Jane could use this to lower the yield she needs to a more reasonable 7.55%, which not only is less than the S&P 500’s historical performance during her accumulation period, but also for the entire history of the U.S. stock market, which has historically given about an 8% annualized return.
Assumption #4: CEFs and BDCs will Provide Sustainable 8.2% Income
The most crucial assumption for this model to be workable is that the funds Jane buys after quitting her job can be relied upon for a sustainable income to meet her needs. If that income falls due to a dividend cut, Jane will face a shortfall that requires repositioning her holdings or a return to the workforce; neither is really what a financially independent person ever needs to do.
The four holdings I chose for this passive income portfolio are all things I’ve held myself at one point in the past or another, and stocks that I had a long-term positive view on. These were: Main Street Capital (MAIN), Virtus AllianzGI Equity & Convertible Income Fund (NIE), PIMCO Dynamic Income Fund (PDI) and PIMCO Dynamic Credit Income Fund (PCI). PCI has since merged with PDI and, since its total return was similar to PDI before the merge, I will simply focus on the three still-extant tickers here for simplicity’s sake.
On average, the original portfolio yielded 10.34%, meaning a 20% cut to dividends would still allow for Jane to rely on these names for her passive income needs. While that 20% cut did not happen, substantial special dividends throughout the years did.
YCharts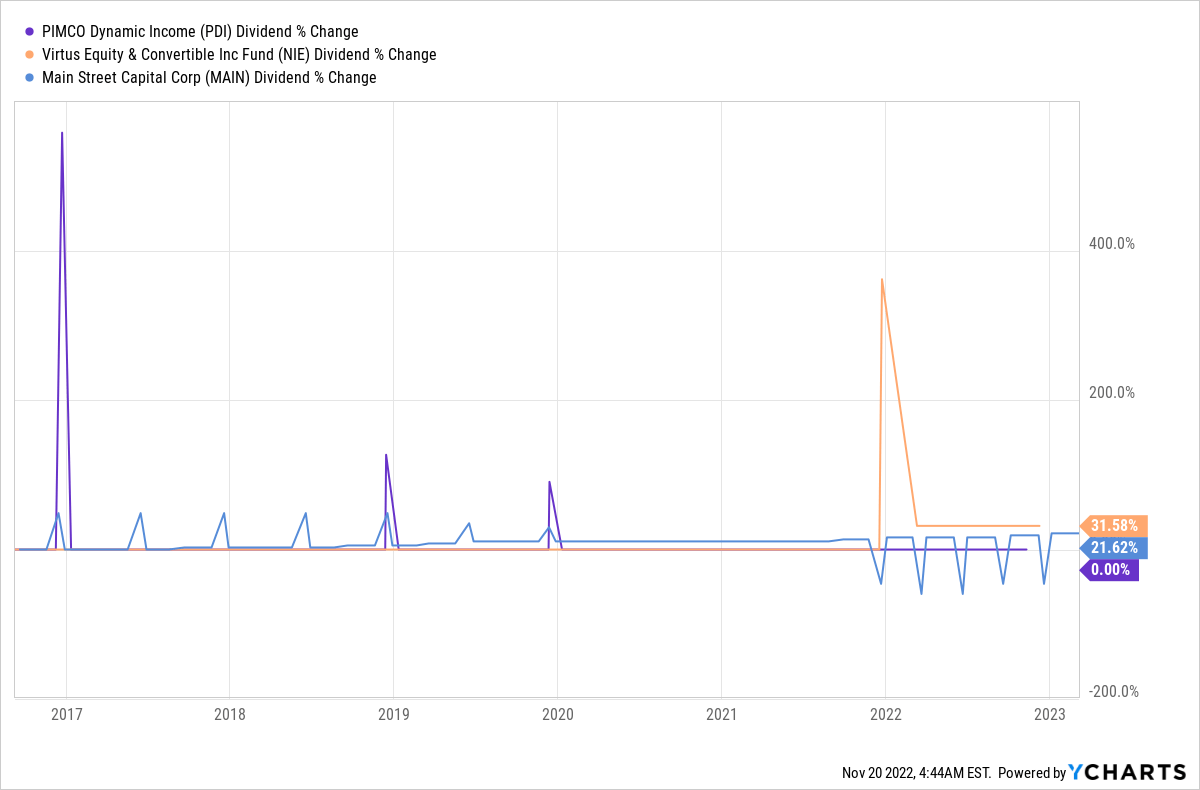
Thus, a Jane ready to quit in 2016 who took this approach not only had enough income to maintain her financial independence over the next few years, including a once-in-a-century global pandemic and the once-in-a-decade horrible bear market of 2022. Indeed, it is hard to imagine a bigger stress test for Jane’s financial independence than the last few years, and yet her income coming in would have exceeded her needs by well over a third, which could be reinvested to help her manage inflation as she lives on her investments.
For a Jane ready to quit in 2022, inflation remains a concern (and one that requires more of a solution from personal finance than from investing), but yield does not. This portfolio’s yield is still more than enough to cover her needs, if a bit lower than it was in 2016.
Author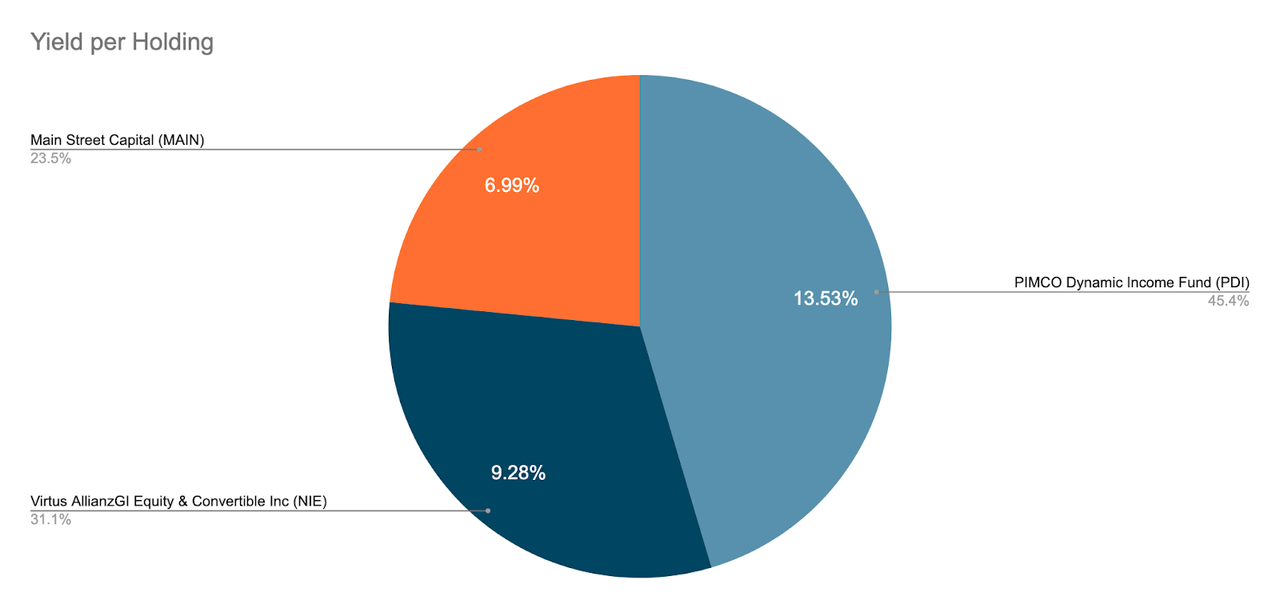
With an average 9.93% yield, excluding special dividends, we are still getting more than the 8.2% target, leaving income left over to save and reinvest to help offset inflation. Also note the share of income per holding; while PDI is a bigger contributor by a small margin, there is still significant diversification here that is a good starting point, and further diversification of income is possible by simply adding more CEFs in the mix. Thanks to current massive discounts, the average CEF yield is now 8.4%, according to CEF Insider data, much higher than its long-term 7.2% average. Furthermore, there are many high quality CEFs currently heavily discounted offering exposure to REITs and stocks well north of 10%, and even municipal bonds with yields over 7%.
What Jane Should Do Now
The very high yields currently offered on CEFs indicate that the dream of maintaining financial independence with a small nest egg and a high yield passive income stream is more achievable now than ever, but risks associated with higher than historical rates of inflation might suggest a much more sophisticated and defensive approach to personal finance would be necessary to make this plan sustainable until inflation rates fall back to historically normal levels. Likewise, a higher inflationary environment suggests a more diversified portfolio that includes more U.S. equity, a particularly beaten down asset class relative to historical performance, would be essential to sustain this income stream and preserve wealth.
In addition to MAIN, NIE, and PDI, buying a highly discounted equity CEF like the BlackRock Science & Technology Trust II (BSTZ), with a 13.5% yield on price and 18.7% discount to NAV could provide further diversification, giving Jane exposure to US growth as well as bonds and bond derivatives with PDI, convertibles and value stocks with NIE, and debt in mid-size firms with MAIN. Taking this further with more high yielding, high discounted CEFs could also push Jane’s yield on NAV higher while giving her less exposure to the risk of any one fund drop its income stream and put Jane’s financial independence in jeopardy.
Be the first to comment