

D-Keine
Real-time pain
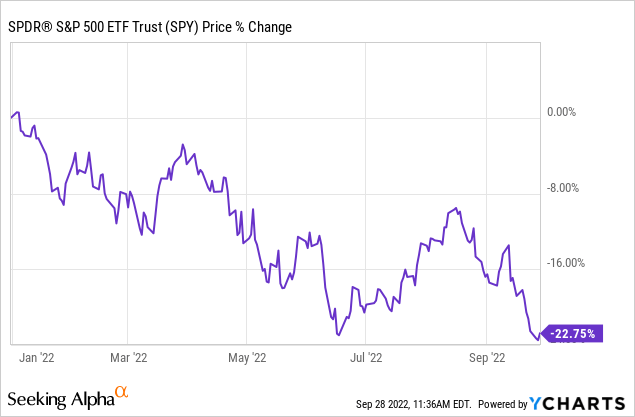
Bear markets are most painful in real-time (versus in hindsight), and this bear market is no different. What makes this bear feel even worse is the breadth of negative returns. From stocks to bonds, to real estate, to cryptocurrency it seems everything is down and there’s nowhere to hide.
As of September, the S&P 500 has already breached the technical definition of a bear market (-20%) twice this year. US stocks, as measured by the SPDR S&P 500 ETF Trust (SPY) are down almost -23% year-to-date.
Hopeful for a bottom
in June, the S&P made a year-to-date low and had a convincing bounce near the 3,600 level. In September the market retested that low and made a new one near the same level. Some investors are hopeful that marks a bottom for stocks.
S&P 500 Price Levels
koyfin.com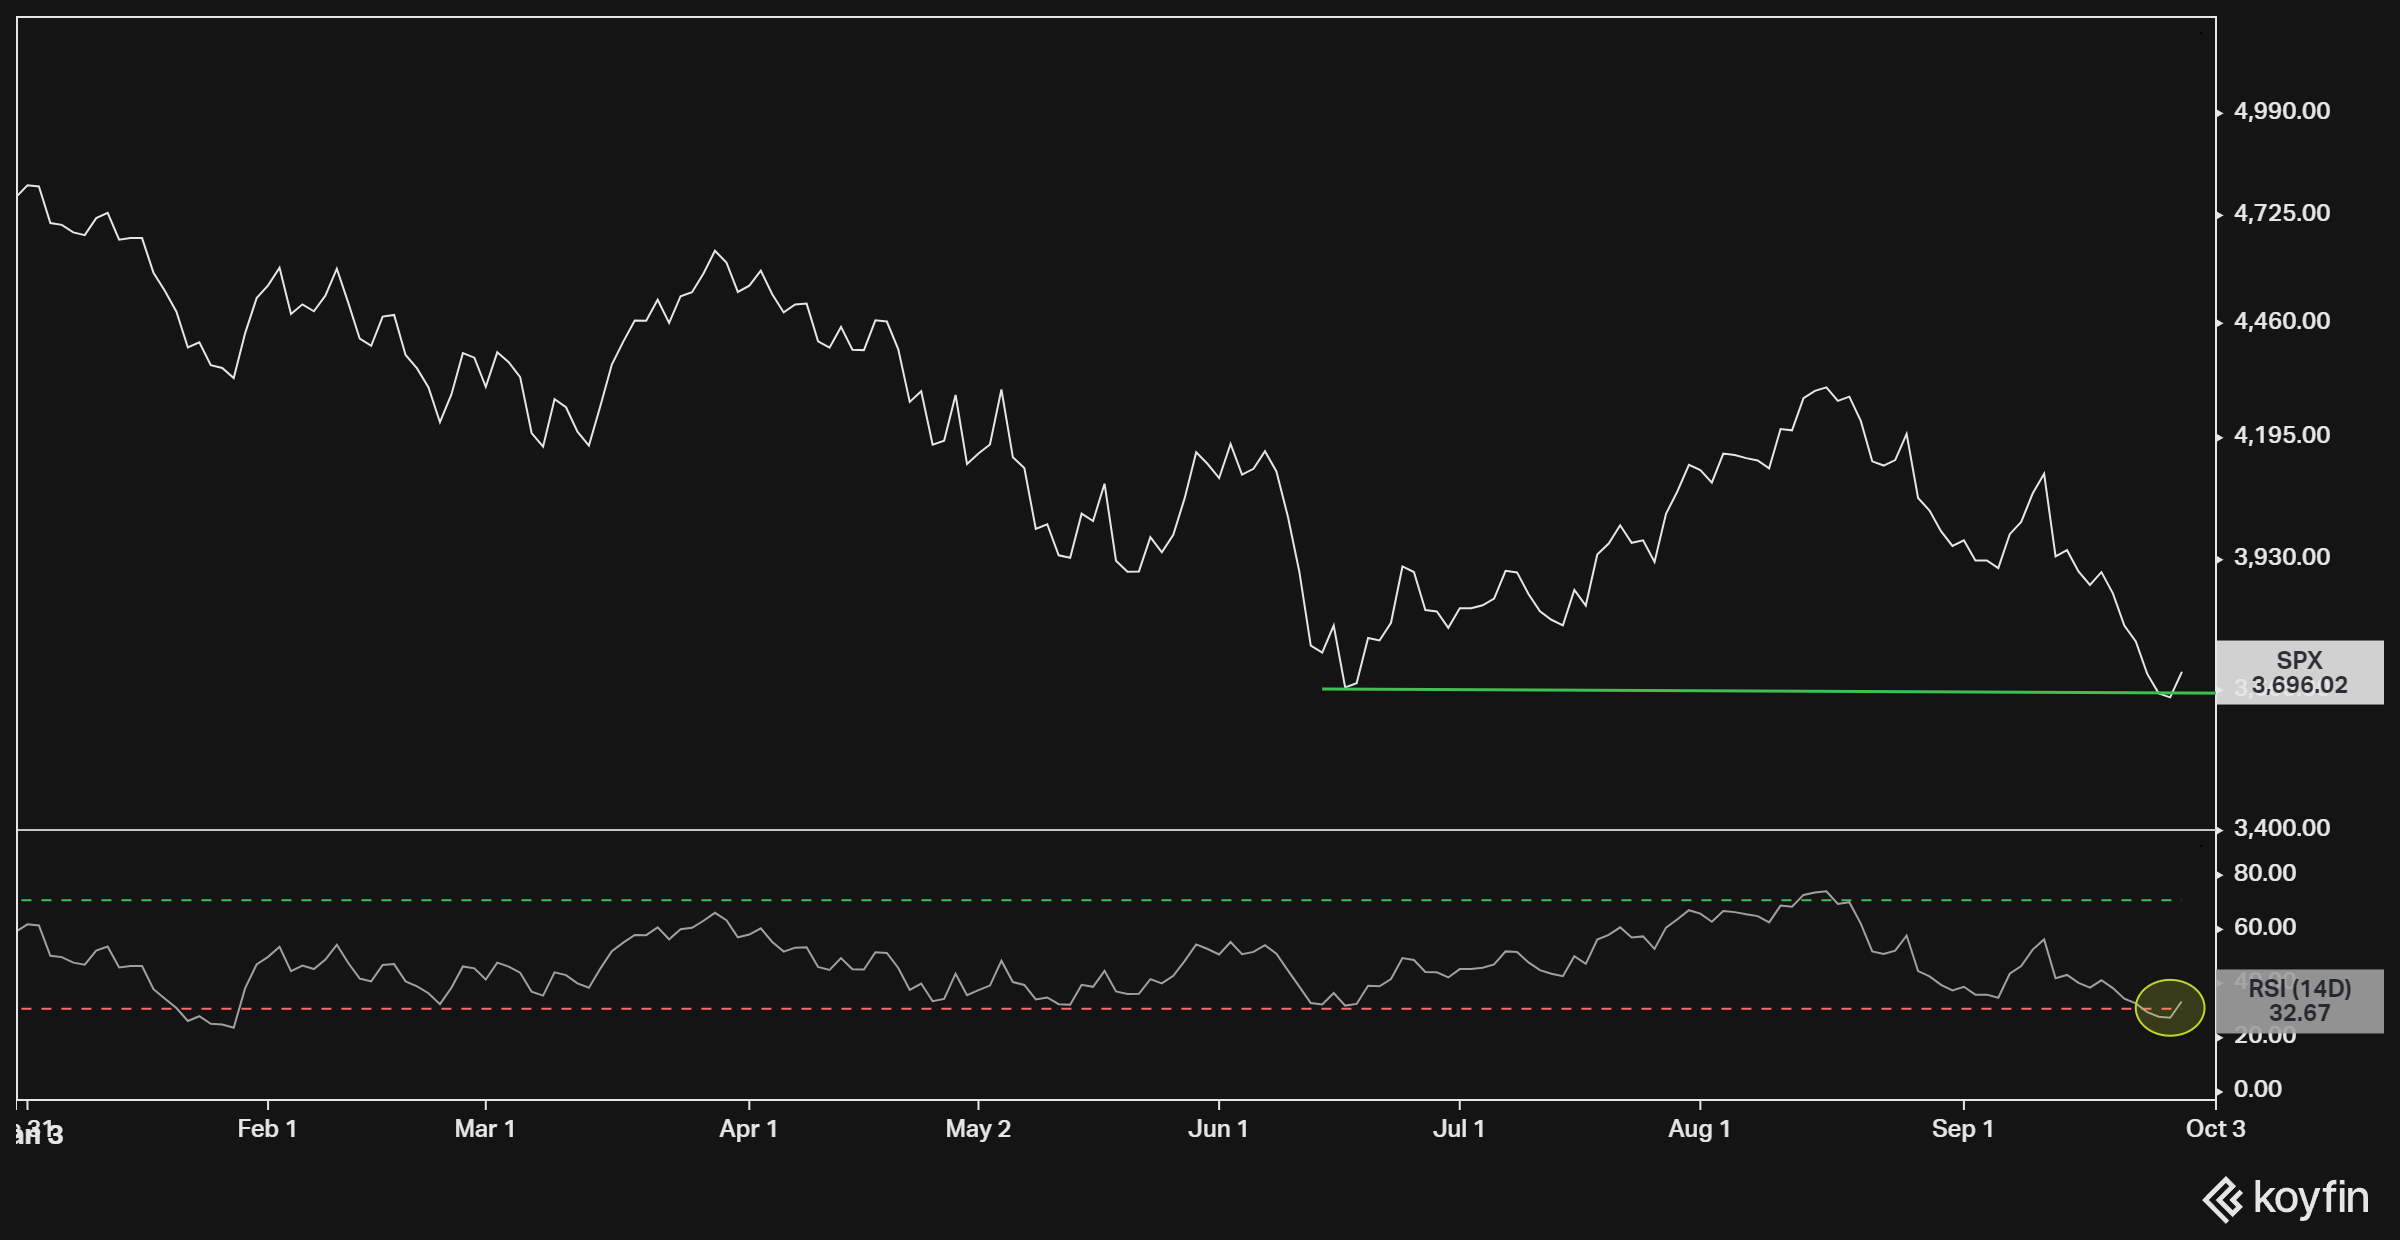
Stocks do look oversold, and the hopeful sentiment is understandable given dismal returns this year. Unfortunately, hope does little to help us identify the end of this bear market. Here are some indicators that provide better insight.
Magnitude of drawdown
The technical definition of a bear market starts at -20%, but the average bear market since 1928 is around -30%. There’s also a wide range around that midpoint.
The worst bear market on record was during the Great Depression when the S&P 500 fell by more than -80%. The mildest was in 2018 when the S&P 500 barely missed the mark with a -19.8% drawdown (assuming we count that as a bear).
At -23% we’re near the mild end of the spectrum. We may not end up with the -50% bears of 2000 or 2007. But given the understanding of “what goes up…” and the substantial run-up to the 2022 peak, an average pullback seems reasonable.
Another way to look at this is valuation. Based on current the Shiller Price to Earnings Ratio (CAPE) of 28x, the S&P 500 is still near its second highest level in history, even higher than prior to the Great Financial Crisis (GFC) of 2007.
multpl.com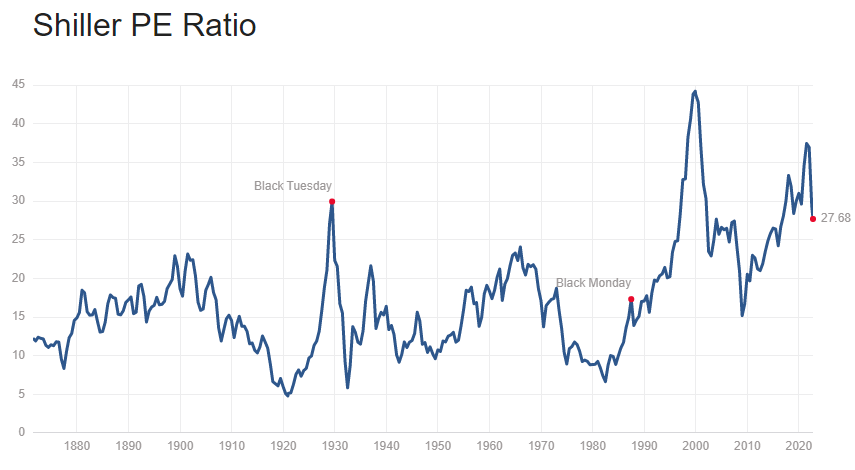
Over the past 150 years, the CAPE has averaged about 17x with a low 5x and a high of 44x. The CAPE bottomed around 15x in the GFC bear market. At prior major bottoms, it routinely fell to single digits.
To be fair, valuation is a blunt tool that is not useful for marking-timing, short-term trading, or predicting tops and bottoms. Case in point, the S&P 500 gained +27% in 2021 despite starting the year with a very high CAPE of over 36x.
However, valuation is useful for gauging the potential magnitude of market drawdowns when they happen. Extreme valuations readings to the upside are typically followed by extreme price declines to the downside, the clearest examples being 2000 and 1928.
Interest rates and the Fed
The old market adage “don’t fight the Fed” is so well-known it’s often disregarded. But investors would have done well to heed it in 2022. The stock market has reacted to Fed policy all year long, summarized by the chart and timeline below.
The Fed vs S&P 500
koyfin.com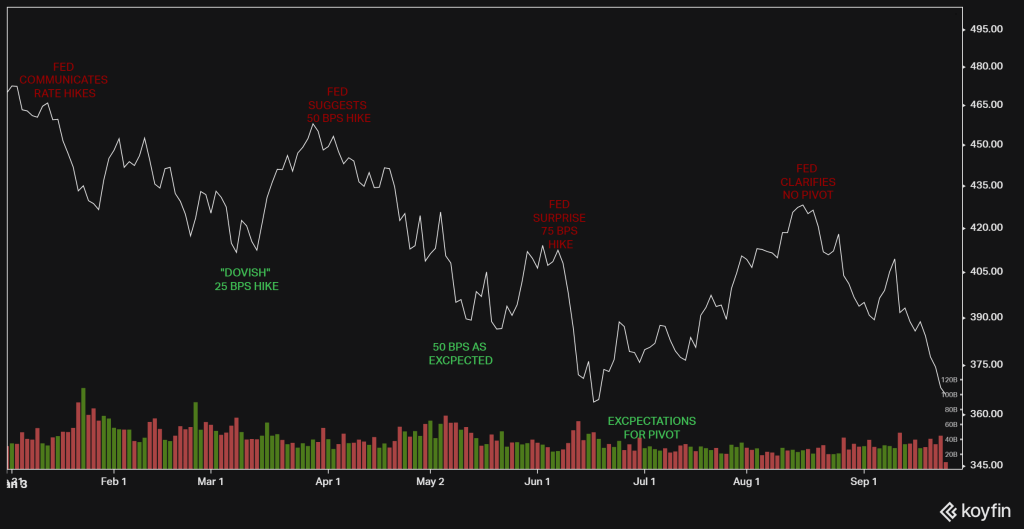
- In January, the Fed telegraphed intentions to tighten monetary policy, sparking widespread market pessimism to start the year.
- In March, stock rallied after Chair Powell confirmed the Fed was only planning a 25 bps move, which investors celebrated as less hawkish than feared.
- In April, the Fed communicated it was willing to be more aggressive and even signaled a potential 50 bps rate hike for May. That sent stocks to new lows, but prices stabilized after the 50 bps move came and went as expected.
- In early June, the Fed surprised with a higher-than-anticipated rate hike of 75 bps which sent stocks to new lows for the year.
- In late June, near the lows, whispers of a potential “Fed pivot” suggested the Fed may be less aggressive than expected if inflation eases. Factual or not, it was what investors wanted to hear and enough to fuel an 18% rally from the lows.
- In August, Chair Powell clarified there was no dovish pivot and the Fed intended to stay the course. That brought the abrupt risk reversal still in play at the end of Q3.
The “pivot” markets hoped for is important because historically, the stock market doesn’t bottom until after the Fed stops hiking rates and nears the end of rate cutting. The chart below shows the change in the Fed Funds Rate (blue) versus US stock prices (red) since 1990.
Fed Funds Rate vs Wilshire 5K
fred.stlouisfed.org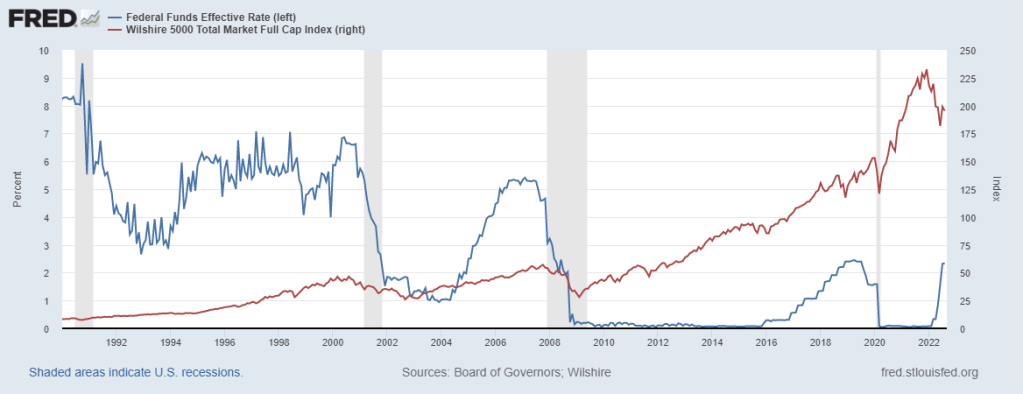
The Fed is set on raising rates further and clearly communicating its plans to do. That implies the stock market has not yet found a bottom and we should expect more pain ahead. Fed Chair Powell basically told us so much in his August statement.
Leading economic indicators
Last but not least are economic conditions. Market rallies can start on technical strength, but they need fundamental support to be sustainable. The underlying health and strength of economic conditions offer such support.
In the US, economic conditions peaked last year and leading economic indicators like housing, PMI measures, interest rates, and earnings growth have all deteriorated since.
The chart below shows the OECD’s US leading indicators (blue) versus US market prices over the past year. The steady decline in leading indicators implied the June – August bounce in stocks was a bear market rally and not the formation of a new bull as some hoped.
OECD CLI vs Wilshire 5K
fred.stlouisfed.org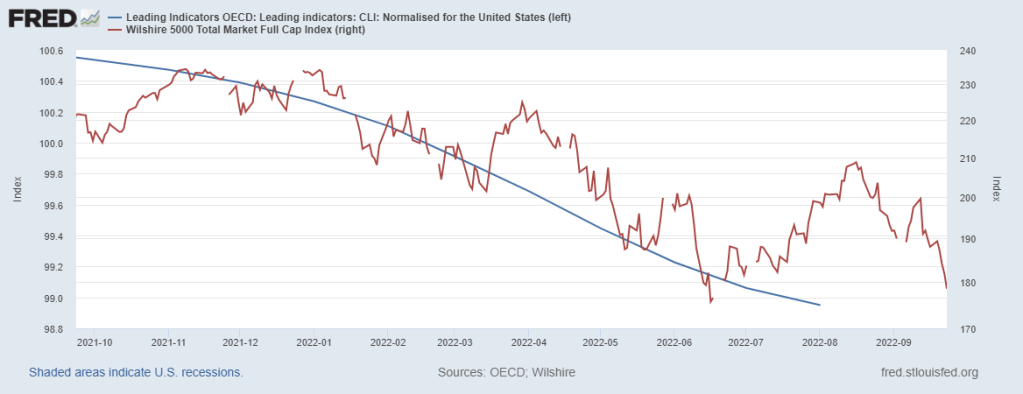
The hopeless bottom line
We are all hopeful for a bottom in stocks, but hope itself will not help us find it. Markets are difficult to time and I don’t know when this downturn ends. That being said, a number of reliable indicators imply this bear has more room to run.
Stock valuations, Fed policy, and economic conditions are all still far from where they typically have been near previous bear market bottoms. Furthermore, the very debate about if we’ve found a bottom is a contrarian indicator itself (albeit not convincing on its own).
Markets don’t hit a durable bottom until pessimism is so deep and so pervasive that nobody thinks there will be a bottom. A genuine bottom is a hopeless one where there is nobody left to sell.
Be the first to comment