
Kwarkot
The pending demise of STORE Capital (STOR) came as a deep disappointment, but not as a deep surprise. One risk of investing in firms that are very undervalued is that other people with deeper pockets than you can figure that out too and can do something about it.
However, the potential long-term gains from STOR are now water under the bridge, with near certainty. In the event, I sold my substantial (for me) holdings of STOR in the premarket the day of the announcement. Ultimately, my gains on those holdings were significant but below my target of a 15% CAGR.
STOR was my only investment in the space of REITs that lease free-standing, single-tenant properties on a triple-net basis, under which tenants pay for all maintenance, taxes, and insurance. The reflects my decision a year ago to concentrate my portfolio on larger positions in firms I study deeply.
Since there is much to like about the growth potential of the net-lease business model, I looked for a place to reinvest some of the principal. In the context of the present bear market, I wanted a firm whose stock was clearly undervalued. From a longer-term perspective, my preference is for firms whose business model produces higher growth.
In several ways Essential Properties Realty Trust (NYSE:EPRT) has both of those properties. I deployed some funds there. But since my most recent close look at EPRT was last December, it was a good time for an update.
I soon noticed that some investors in our chat room at High Yield Landlord were strongly attracted to Spirit Realty Capital (NYSE:SRC). The high yield clearly has an appeal.
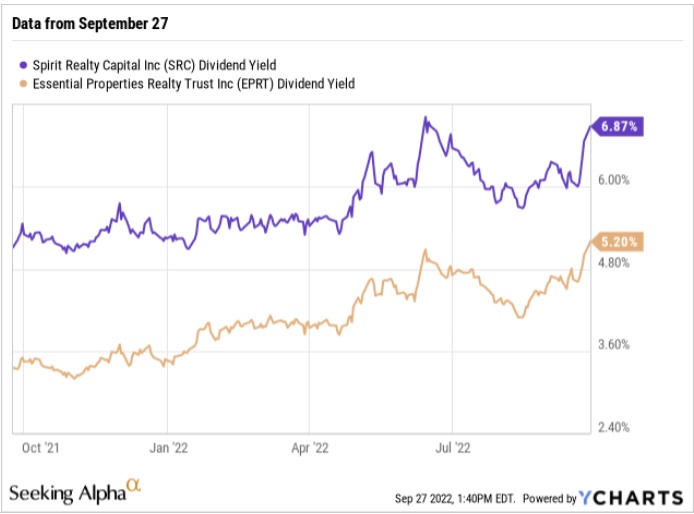
YCHARTS
SRC has not attracted much attention from me for quite a long time. I look at the various articles that feature it, but they do not paint a clear picture. The reasons for the research that led to the present article were to improve my own understanding and then to share it with readers.
As usual, both EPRT and SRC have the litany of risks spelled out in their SEC filings. In my view most of those are extremely small.
Very Brief Histories
EPRT is pretty new. They were formed and did their IPO in 2018. Management includes members with prior experience at REITs of which Chris Volk was CEO. Since 2018, they have pursued growth using a model similar in many ways to that of STORE.
In contrast, SRC has a longer history. They experienced several years of difficulty associated with the merger and then the bankruptcy of two of their tenants. The current management team, led by Jackson Hsieh, came into control in 2017.
Since 2017 SRC has shed their problematic properties, reworked their portfolio, and sought to grow earnings. Their ability to grow has been hurt by the high dividend yield demanded by the market, especially in 2017 and 2018.
The yield came down throughout 2019, and then the pandemic hit. We will examine the connection of yield and growth below.
The best measure of earnings for net lease REITs like these is per share Adjusted Funds From Operations, or AFFO. AFFO can have complexities (see this article), but tends to be pretty straightforward for this type of REIT. Here is a comparison of AFFO/share as determined by REIT/base for these two REITs:
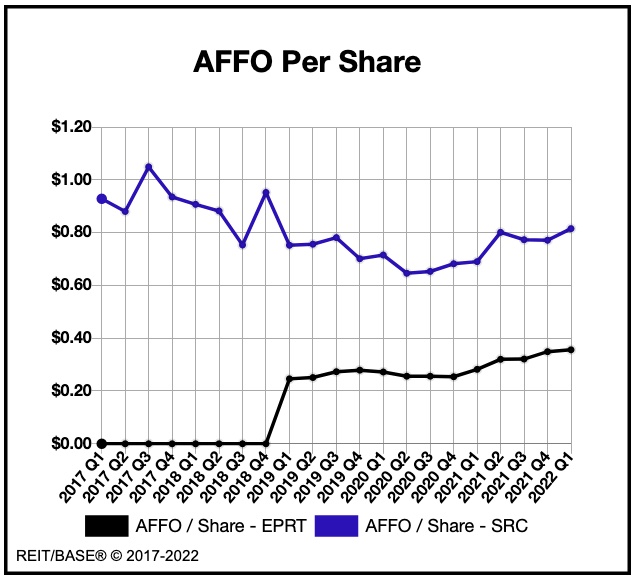
REIT/base chart
One can see the downward trend of AFFO/sh for SRC, until it bottomed during the pandemic. EPRT shows AFFO/sh as flat until 2021, when it began growing.
Both these REITs grew earnings strongly in 2021, as did many others. This continues in 2022 as recovery from the pandemic is still having an impact this year.
Forward growth rate projections after 2022 tend to be quite a bit smaller. We will look at mine below.
Business Models A: Direct Sources of Earnings Growth
After a bit of underlying theory, we will look here at specific numbers for these two REITs.
A Bit of Theory
A combination of elements determine the growth of AFFO/share that a REIT achieves. My understanding of it came from discussions with Chris Volk.
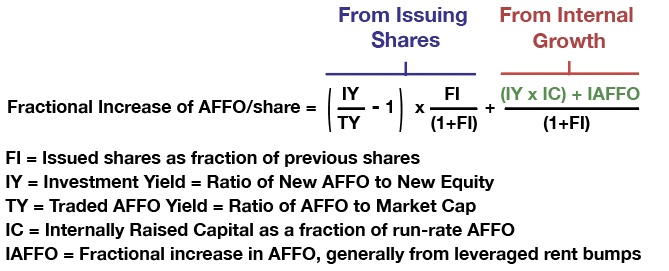
The relationship is mathematical and precise, although variations in timing of its parts can produce some lumpiness. Here it is:
RP Drake
This formula ignores the dilutive impact of stock-based compensation, which is far smaller than total share issuance for these REITs (and most REITs). I discussed what goes into this formula, and why it is the only quantitative and precise way to evaluate AFFO/share growth, in these two articles.
Important points here are that all REITs produce some level of internal growth (shown under the red label in the formula). This is independent of the stock price.
REITs also aspire to grow by issuing shares. The impact of this (shown under the purple label) depends on the ratio of the yield they get buying AFFO to the yield they get selling AFFO. (In the math above, these are the Investment Yield, IY, and the Traded Yield, TY, respectively.)
REITs buy AFFO by buying properties (or sometimes by developing them). REITs sell AFFO by selling shares — increasing the share count by 10% transfers ownership of about 10% of AFFO to those who buy the shares.
Funding the Acquisitions
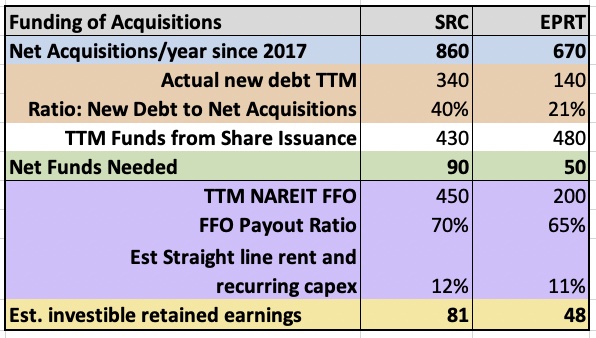
REITs grow earnings by adding property, which in turn produces income from rents. It helps to understand a given REIT by looking at how they fund this. Here is the summary of this aspect for these two REITs:
RP Drake
SRC has been adding property at a bit higher rate than EPRT has. Both no doubt aspire to increase this rate.
Over the last year, the funds for this came from the three usual places. The new debt issued and funds from share issuance are both shown above the row shaded green. The row shaded green shows the funds needed after debt and share issuance.
A note here is that EPRT issued their first fairly ordinary, unsecured notes in Q2 of 2021, raising $400M. This year they commented in the Q2 earnings call that:
Our philosophy is really to match fund our leverage to our long-dated leases, which we certainly plan to do. But it just strikes us that now is not an opportune time to lock in that long-term funding given the dislocation that we see in the public unsecured debt market.
In due course, EPRT will issue more debt. Overall, though, their debt is 33% of their gross assets. This seems to be their target, though it is an unusually low number for net lease REITs.
SRC has a more typical target of 40%. They issued that much debt during the past four quarters.
The increase in shares has been running about 10% for SRC and 20% for EPRT in recent years. A higher rate is common for newer REITs.
The rows shaded purple show the elements that determine the funds available to support growth from retained earnings. The table first shows the NAREIT Funds From Operations, or FFO. Some fraction of that is paid out as dividends.
But the remainder of FFO is not all available for investment. For these two REITs, the non-cash components of FFO are straight-line rents and recurring capex. These do vary even across net lease REITs, distorting the meaning of the oft-quoted ratio of price to FFO.
These two REITs have non-cash earnings that are just over 10% of FFO. I obtained the estimates shown using the REIT/base values for straight-line rents and recurring capex over recent years.
The row shaded gold shows the implied retained earnings. One can see that these numbers are close to the values shown on the row shaded green.
This completes the square regarding how growth has been supported recently. The only long-term difference one would expect is that EPRT will issue relatively more debt and less stock over time than they have in the past year.
Buying and Selling AFFO
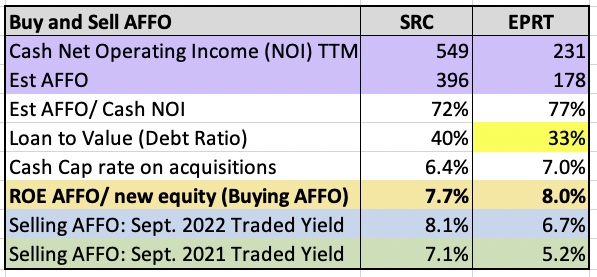
We next look at the yields obtained for these two REITs by buying or selling AFFO. We can put that together using this table:
RP Drake
Working with the income statement and the previous table lets one generate the first two rows here, shaded purple. One finds that AFFO is a percentage of Cash NOI in the 70s. The exact value is smaller for SRC because of their higher leverage and interest costs.
To look ahead we need a debt ratio for new acquisitions. The table uses 40% for SRC and 33% for EPRT (cell shaded yellow). The latter is based on my long-term expectation discussed above.
Both these REITs report the recent cash cap rate on new acquisitions in their earnings presentations. For reasons discussed below, this is larger for EPRT than for SRC.
The yield from buying AFFO is then implied by the three unshaded rows. It is shown on the row shaded gold to be 7.7% for SRC and 8.0% for EPRT. This is referred to in the math above as the Investment Yield, or IY.
In order for share issuance to increase AFFO/share, the yield from buying AFFO (row shaded gold) must exceed that for selling AFFO (rows shaded blue and green). This is symbolized as the Traded Yield, or TY, in the math above.
You can see that today (row shaded blue), SRC cannot increase AFFO/share using funds generated by issuing shock. In contrast, EPRT still can.
Both could do so a year ago, since the traded yield shown in the row shaded green is less than the investment yield shown in the row shaded gold for both of them.
AFFO/share Growth
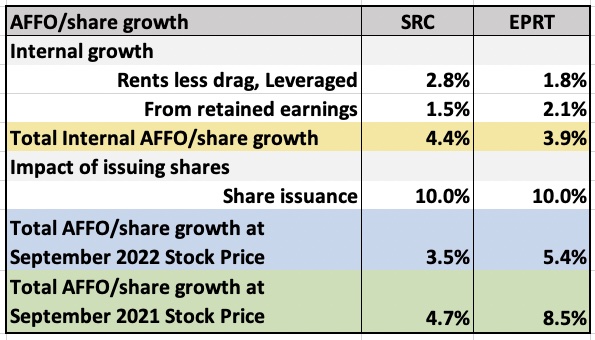
For some assumed increase in the share count, we can now apply the formula above to find the AFFO/share growth. This table shows how that comes together.
RP Drake
Rents increase at different rates for these two REITs. The escalators are 2% for SRC and 1.5% for EPRT.
The associated increase in AFFO/share is decreased by the properties that become non-performing. SRC claims in their presentation that this has become negligible recently. It will not stay that way. EPRT does not say.
I took this rent growth drag to be 0.3%. To evaluate the impact at neutral leverage, one levers the result up at the leverage target.
The growth from retained earnings shown above is used to buy AFFO at the return on equity just discussed. The combined result is that SRC obtains an internal growth rate of 4.4%, an excellent value. EPRT obtains a smaller rate, 3.9%.
Issuing shares dilutes the internal growth. It also provides an increase or dilution of AFFO/share, depending on the ratio of IY to TY.
You can see both cases here. The row shaded blue shows what happens today when SRC sells stock and buys properties. It has the impact of reducing AFFO/share growth. In contrast, the row shaded green shows the increase of AFFO/share for stock issued by SRC a year ago.
One can see that selling shares increases AFFO/share for EPRT in both periods, but that the increase was a lot larger a year ago.
What’s more, EPRT has been issuing shares at a rate closer to 20%. If this continues, their AFFO/share growth will be quite a bit larger.
This comparison illustrates the problem that the high dividend creates for SRC. If today’s stock prices were going to be typical, they ought to quit issuing shares. Investors would get a total return near 10% from the dividends plus the internal growth.
But SRC will not do that because they expect their share price to recover. In addition, they have ongoing relationships with businesses that rely on them for financing. It would be a long-term mistake to turn those off in reaction to what is likely a temporary bear market.
Investors who buy after stock prices recover are still likely to end up with a total return near 10% from SRC. But that is not a great deal. You can get the same returns from National Retail Properties (NNN), in my view a much more secure investment.
In contrast, EPRT is likely to be one of the net lease REITs that will produce a higher rate of growth and higher total return. This is thanks mainly to the larger cap rates they get within their business model.
This takes us to the other aspects of the business model, which impact the security and endurance of the growth these REITs can obtain.
Business Models B: Quality
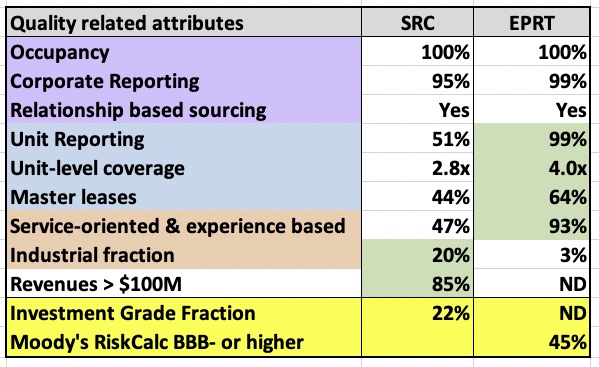
All REITs have attributes that contribute to their quality, but only indirectly impact the growth of AFFO/share. I call them quality related attributes. Several of these are shown here:
RP Drake
The rows with purple shading show occupancy, corporate reporting of financials, and an emphasis on sustaining relationships with tenants as a primary element of sourcing new ones. These are all important, and both REITs are excellent here.
The rows with blue shading show attributes that in my view are very important to minimizing losses in difficult times. In each of these aspects EPRT is of significantly higher quality than SRC:
- Obtaining financials from each unit helps the REIT proactively address locations becoming weaker.
- The rent coverage of any unit is a key measure of how well they can handle difficult times.
- Master leases prevent a corporation from selectively abandoning individual locations.
The two rows with orange shading show aspects whose beauty lies in the eye of the beholder. EPRT has explicitly emphasized service-oriented and experience-based properties, in part from the perspective that these are more resistant to e-commerce. If you value such a focus, you will value that aspect of EPRT.
SRC, in contrast, while having a substantial fraction of such tenants, also has 20% of its property leased to industrial firms. This is relatively large for this type of REIT. If you think industrial rents are going to infinity and beyond, you will value this aspect of SRC.
You can also see in the unshaded row that SRC favors large tenant corporations, so that 85% of their properties are leased to corporations with revenues above $100M. EPRT does not report this statistic, but my estimate from various indirect indicators is that the fraction is much smaller.
All else equal, one would expect corporations with larger revenue to be more robust. But this may not do a REIT much good unless they also have master leases.
Who’s Your Tenant?
The two rows shaded yellow in the table just above highlight a way in which these two REITs differ qualitatively. SRC reports the fraction of tenants that is investment grade, while EPRT does not.
When you look at SRC presentations, you see qualitative information about assessing tenant quality. You also see that the average purchase price per property in recent quarters has been near $10M.
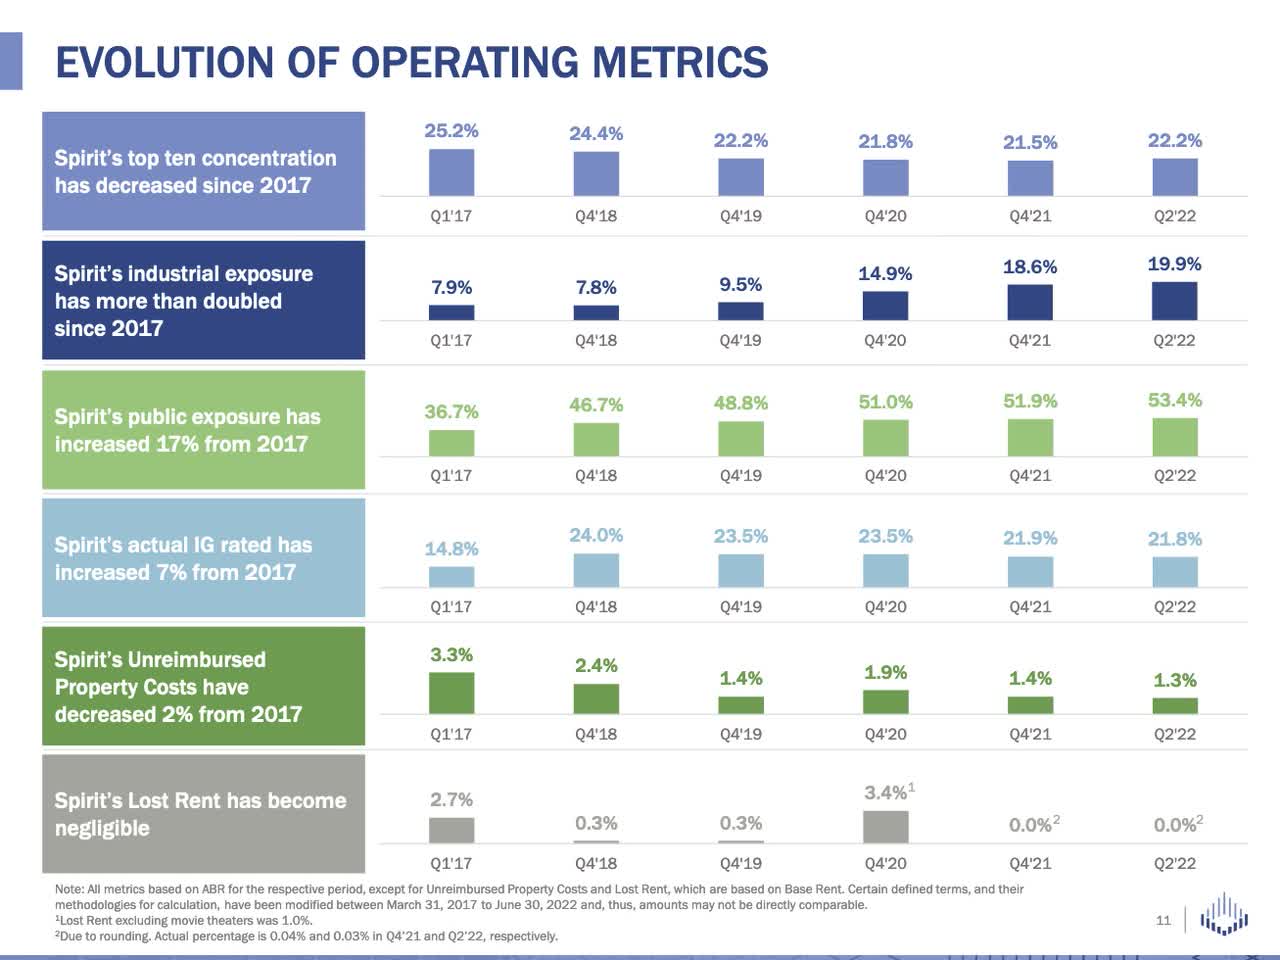
Here is what SRC chooses to emphasize as operating metrics:
SRC Q2 2022 Investor Presentation
SRC emphasizes the increase in the fraction of properties with investment-grade tenants. They also emphasize the increase in industrial properties. Their average industrial property has around 100,000 sq. ft
When I look through the presentation, I get the feeling that SRC aspires to be a mix of Realty Income (O) and W.P. Carey (WPC). But they are far from that now, and can’t easily get there.
The reason, as we saw above, is that they need higher cap rates to grow per share earnings, reflecting their relatively high dividend yield and Traded AFFO yield. I end up with the feeling that SRC aspires to become something that may be unrealistic.
All that said, SRC has a solid balance sheet, good debt management, and an ability to grow per share earnings internally at a comparatively high rate. But overall their growth of AFFO/share will be stuck at a few percent per year until if and when they convince the market to value them more richly.
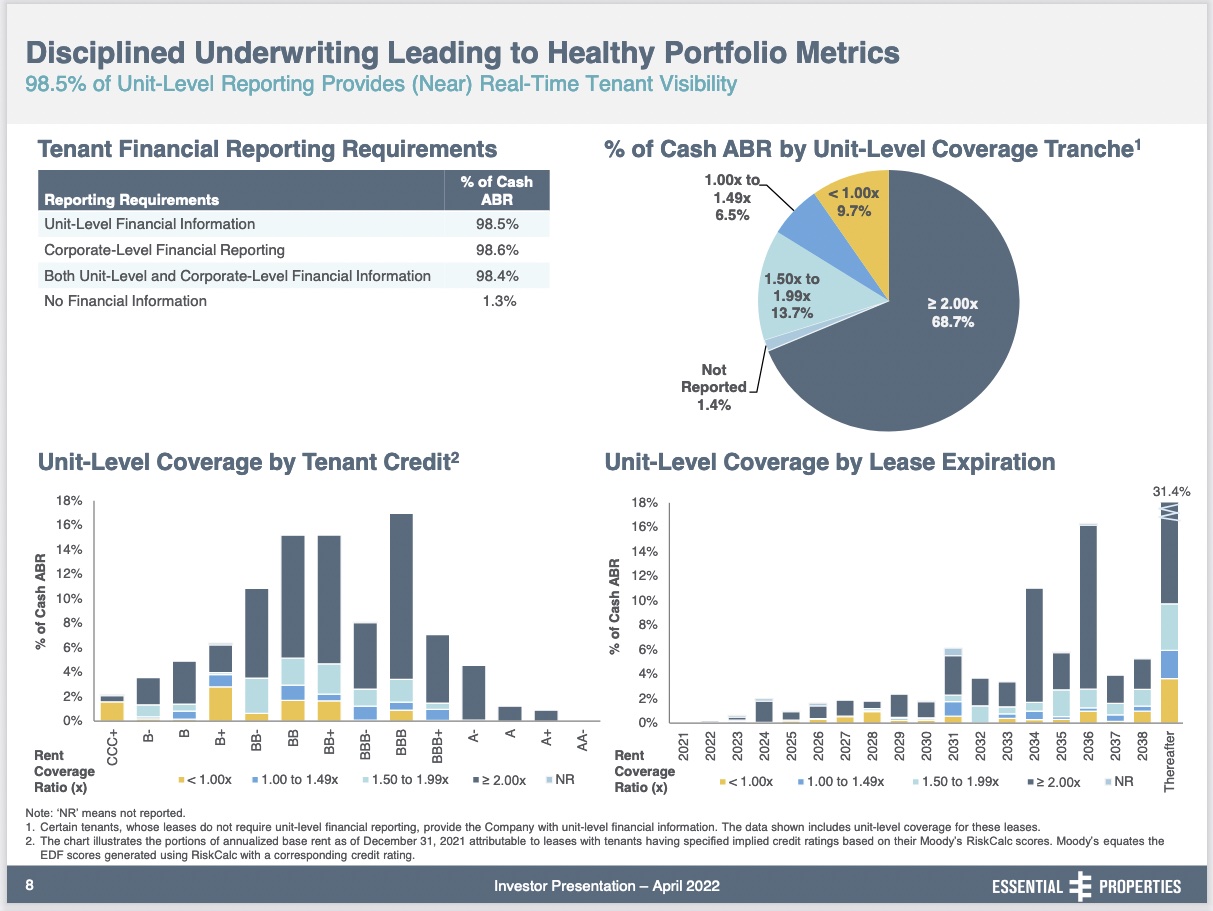
EPRT also has a solid balance sheet and good debt management. But what EPRT chooses to report in detail is unit-level, credit-related information for their tenants.
EPRT Q2 2022 presentation
Notably, they apply the RiskCalc methodology developed by Moody’s to assign a credit rating to each tenant. RiskCalc provides a way to assess credit quality for firms too small to access the bond markets. By this score nearly half of the units owned by EPRT are rated investment grade and most of the rest have scores in the BB range.
EPRT also emphasizes owning smaller properties, from the perspective that these are more fungible. They quote their average investment per property at $2.3M.
Perspective on the Dividends
Looking at the all the above, my overall view is that EPRT will suffer less than SRC in a severe recession. This was by design. This interview, of EPRT CEO Pete Mavoides includes a lot of other really good material relating to who EPRT is and wants to be.
That said, SRC is unlikely to suffer a lot even in a deep recession. Their diversification will protect earnings. Their low payout ratio will likely protect the dividend.
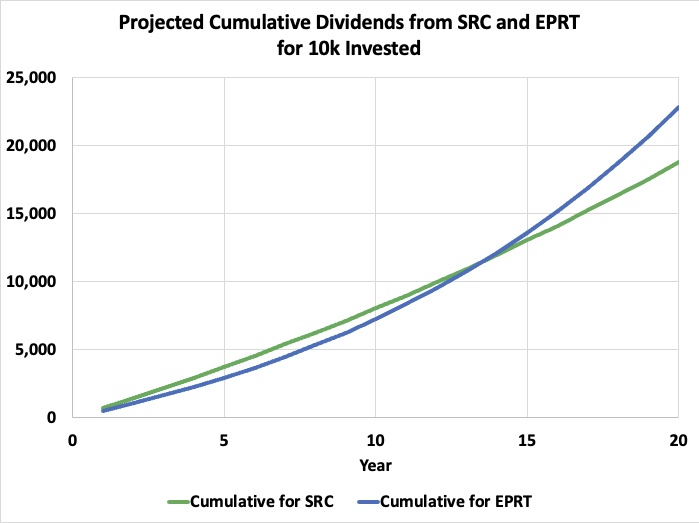
SRC pays a higher dividend that will grow more slowly while EPRT pays a lower dividend that will grow more rapidly. If one looks at cumulative dividends, one gets this plot.
RP Drake
The plot assumes SRC starts at a 7% Yield which grows at 3%, while EPRT starts at a 5% Yield which grows at 8%.
You would get somewhat more money from SRC during the first few years. For the first 10 years, the net present value of these dividends is 10% larger for SRC (using a 10% discount rate). By 20 years EPRT has pulled ahead and the difference would rapidly get larger from there.
I was not sure how this calculation would turn out. I thought perhaps the differences in the short run would be larger than they are.
Investors with short timescales will be drawn to the higher short-term returns from SRC. But each must ask themselves whether that modest difference is worth the increased (though still small) risk of a dividend cut.
Bear Market Upsides and Scenarios
As of September 27, EPRT is down 36% and SRC is down 29% from their 52-wk highs. The upsides back to those highs are 56% and 37%, respectively.
Perhaps the relative drop makes sense, since EPRT is a higher-growth stock. But when the market reverses EPRT is likely to rise farther and faster for the same reason. But you never know, do you?
We do not know how quickly the various markets and stocks will recover to their recent highs. If the markets anticipate enduring higher interest rates, then they might discount everything below the level of those highs.
In that case it will take earnings growth to push these stocks or any stocks back to their previous highs. EPRT is positioned to do better in that scenario.
Wrapping things up, I have no objection to holding SRC and admire Jackson Hsieh for the progress he has led. Perhaps SRC will continue to improve as they grow up. Just know that for now you hold a slow grower with some comparatively risky aspects.
In contrast, in return for accepting a modestly lower dividend from EPRT, you get a firm with more secure tenants and a clear path to stronger growth. This is my preference here.


Be the first to comment