

Sundry Photography
Two long-term compounders
Home Depot (NYSE:HD) and Lowe’s (NYSE:LOW) have had terrific total returns over the last decade, growing by 479% and 674% respectively (total return includes dividend payments), massively outperforming the S&P 500 (217%) and Nasdaq (317%). But will they continue to outperform in the following years? Both companies are currently down more than 25% from ATH and offer attractive entry levels to investors.
HD, LOW Total Return (Koyfin)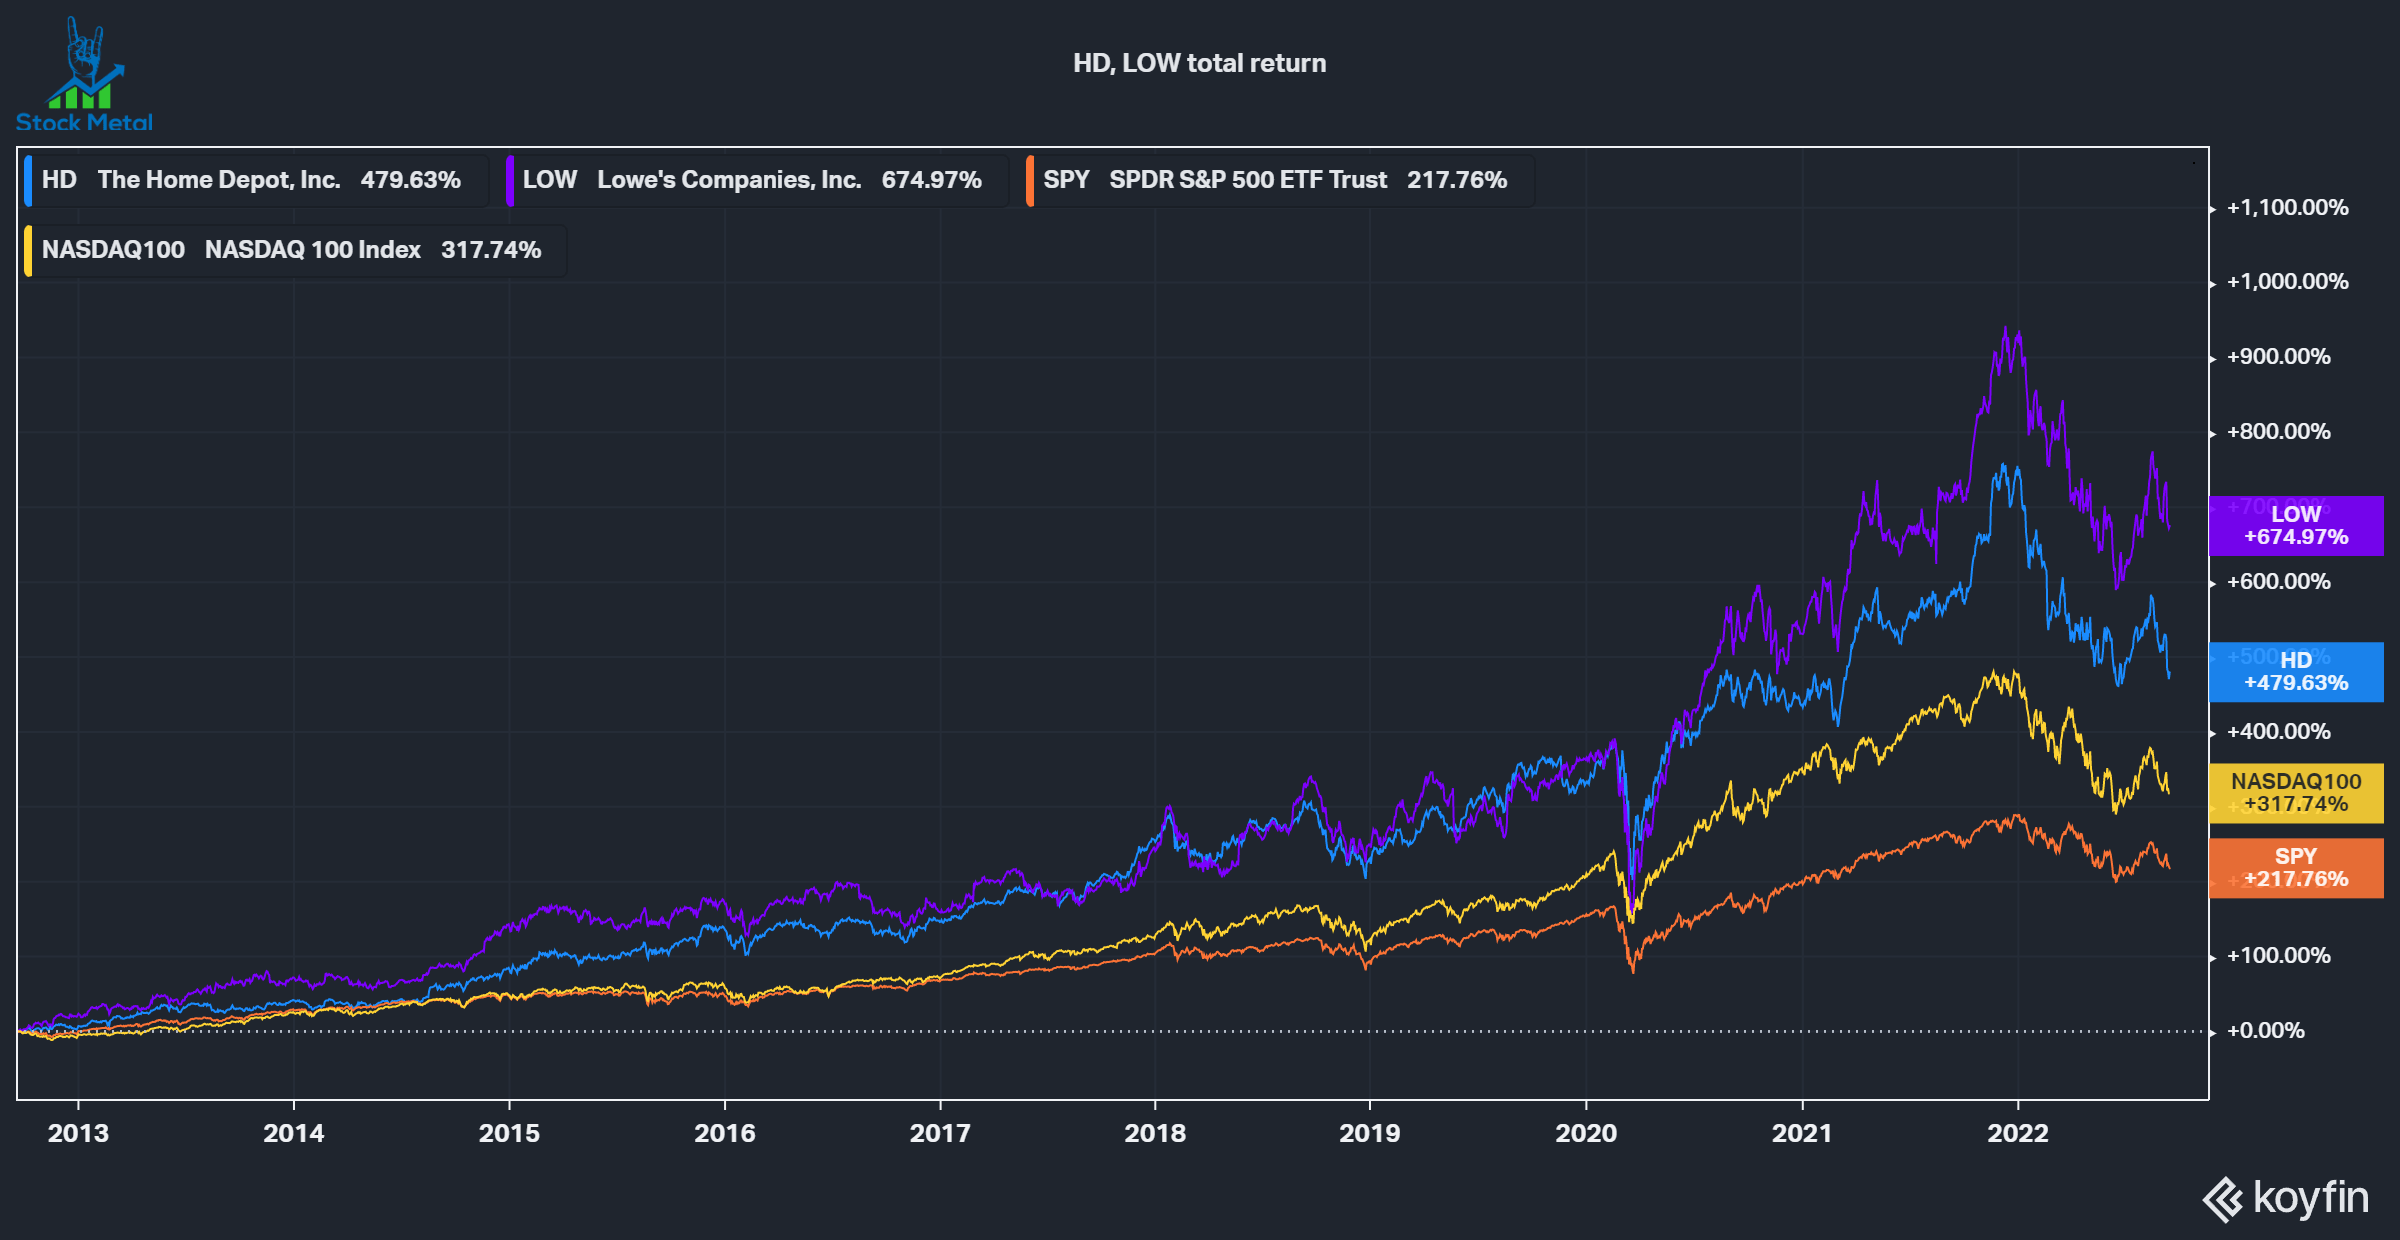
Quick elevator pitch on each company
This article is not aiming to be a deep dive into the business model of both companies, but rather a comparison between the fundamentals of the companies. I will give two quick elevator pitches about the business models, though.
Home Depot
Home Depot is the largest home improvement retailer with over 2300 stores in North America and over $155 billion in revenues in the trailing 12 months. The company does almost half of its revenue (45%) with professional contractors, while the other half (55%) is from DIY customers. The average Home Depot store is around 150,000 square feet of enclosed space and has a 24,000 square feet garden area, according to house digest.
Home Depot Q2 Infographic (Home Depot IR)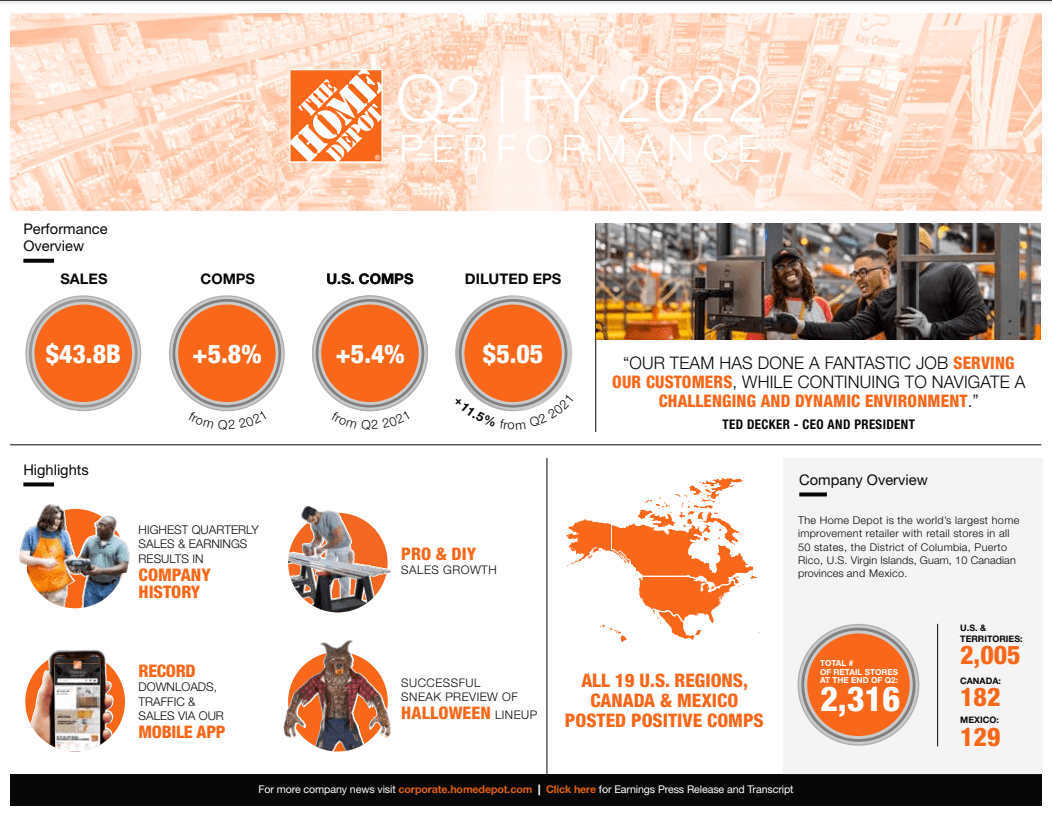
Lowe’s
Lowe’s is the second-largest home improvement retailer in North America with 1969 stores and over $95 billion in revenues. The company has a larger focus on DIY customers, which account for 75% of its revenues, while professional contractors only account for 25%. The average Lowe’s store is larger than the average Home Depot with around 112,000 square feet of enclosed space and 32,000 square feet of garden center areas, according to house digest.
Lowe’s Infographic (Lowe’s IR)
Industry
According to Graphical Research, the North American Home Improvement market is expected to experience moderate growth of 4% annually from 2021 to 2027 or $545 billion. DIFM (Do it for me or professional services) is likely to account for the majority ($315 billion) of this, growing faster than DIY (benefitting Home Depot due to its larger focus on DIFM). With a combined $247 billion of revenues in FY 21 Home Depot and Lowe’s account for over half of the market. A growing industry provides tailwinds to these businesses.
North American Home Improvement Market (Graphical Research)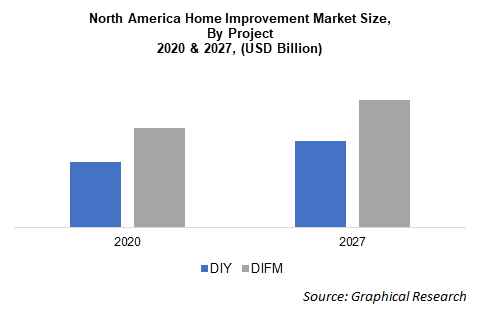
Capital Reinvestment
Over the long term, Capital Allocation is one of the most important differentiators for the performance of a company. This means, how are the cash flows generated by the company reinvested? Companies have six options:
- Invest in the existing operations of the business
- Acquire new businesses
- Buy back shares
- Pay out dividends
- Pay down debt
- Sit on the cash
The result of these reinvestments can be roughly measured by Return on Equity, Return on Assets and Return on Capital. In the graphic below, we can see that Return on equity is a useless measure to judge these two companies. Due to high buybacks, common equity is close to zero for HD or negative for LOW. Return on Capital and Return on Assets are not affected by that though, and we can see that both companies generate fantastic returns. A good company manages to consistently generate ROC above 15% and has a ROC that is at least 2% higher than its weighted average cost of capital (‘WACC’). Home Depot consistently has had a higher ROC and ROA than Lowe’s, but in recent years had stagnation and a slight decline, while Lowe’s keeps growing its ROC and ROA. Both companies get a point in this category.
HD, LOW Capital Reinvestment (Koyfin)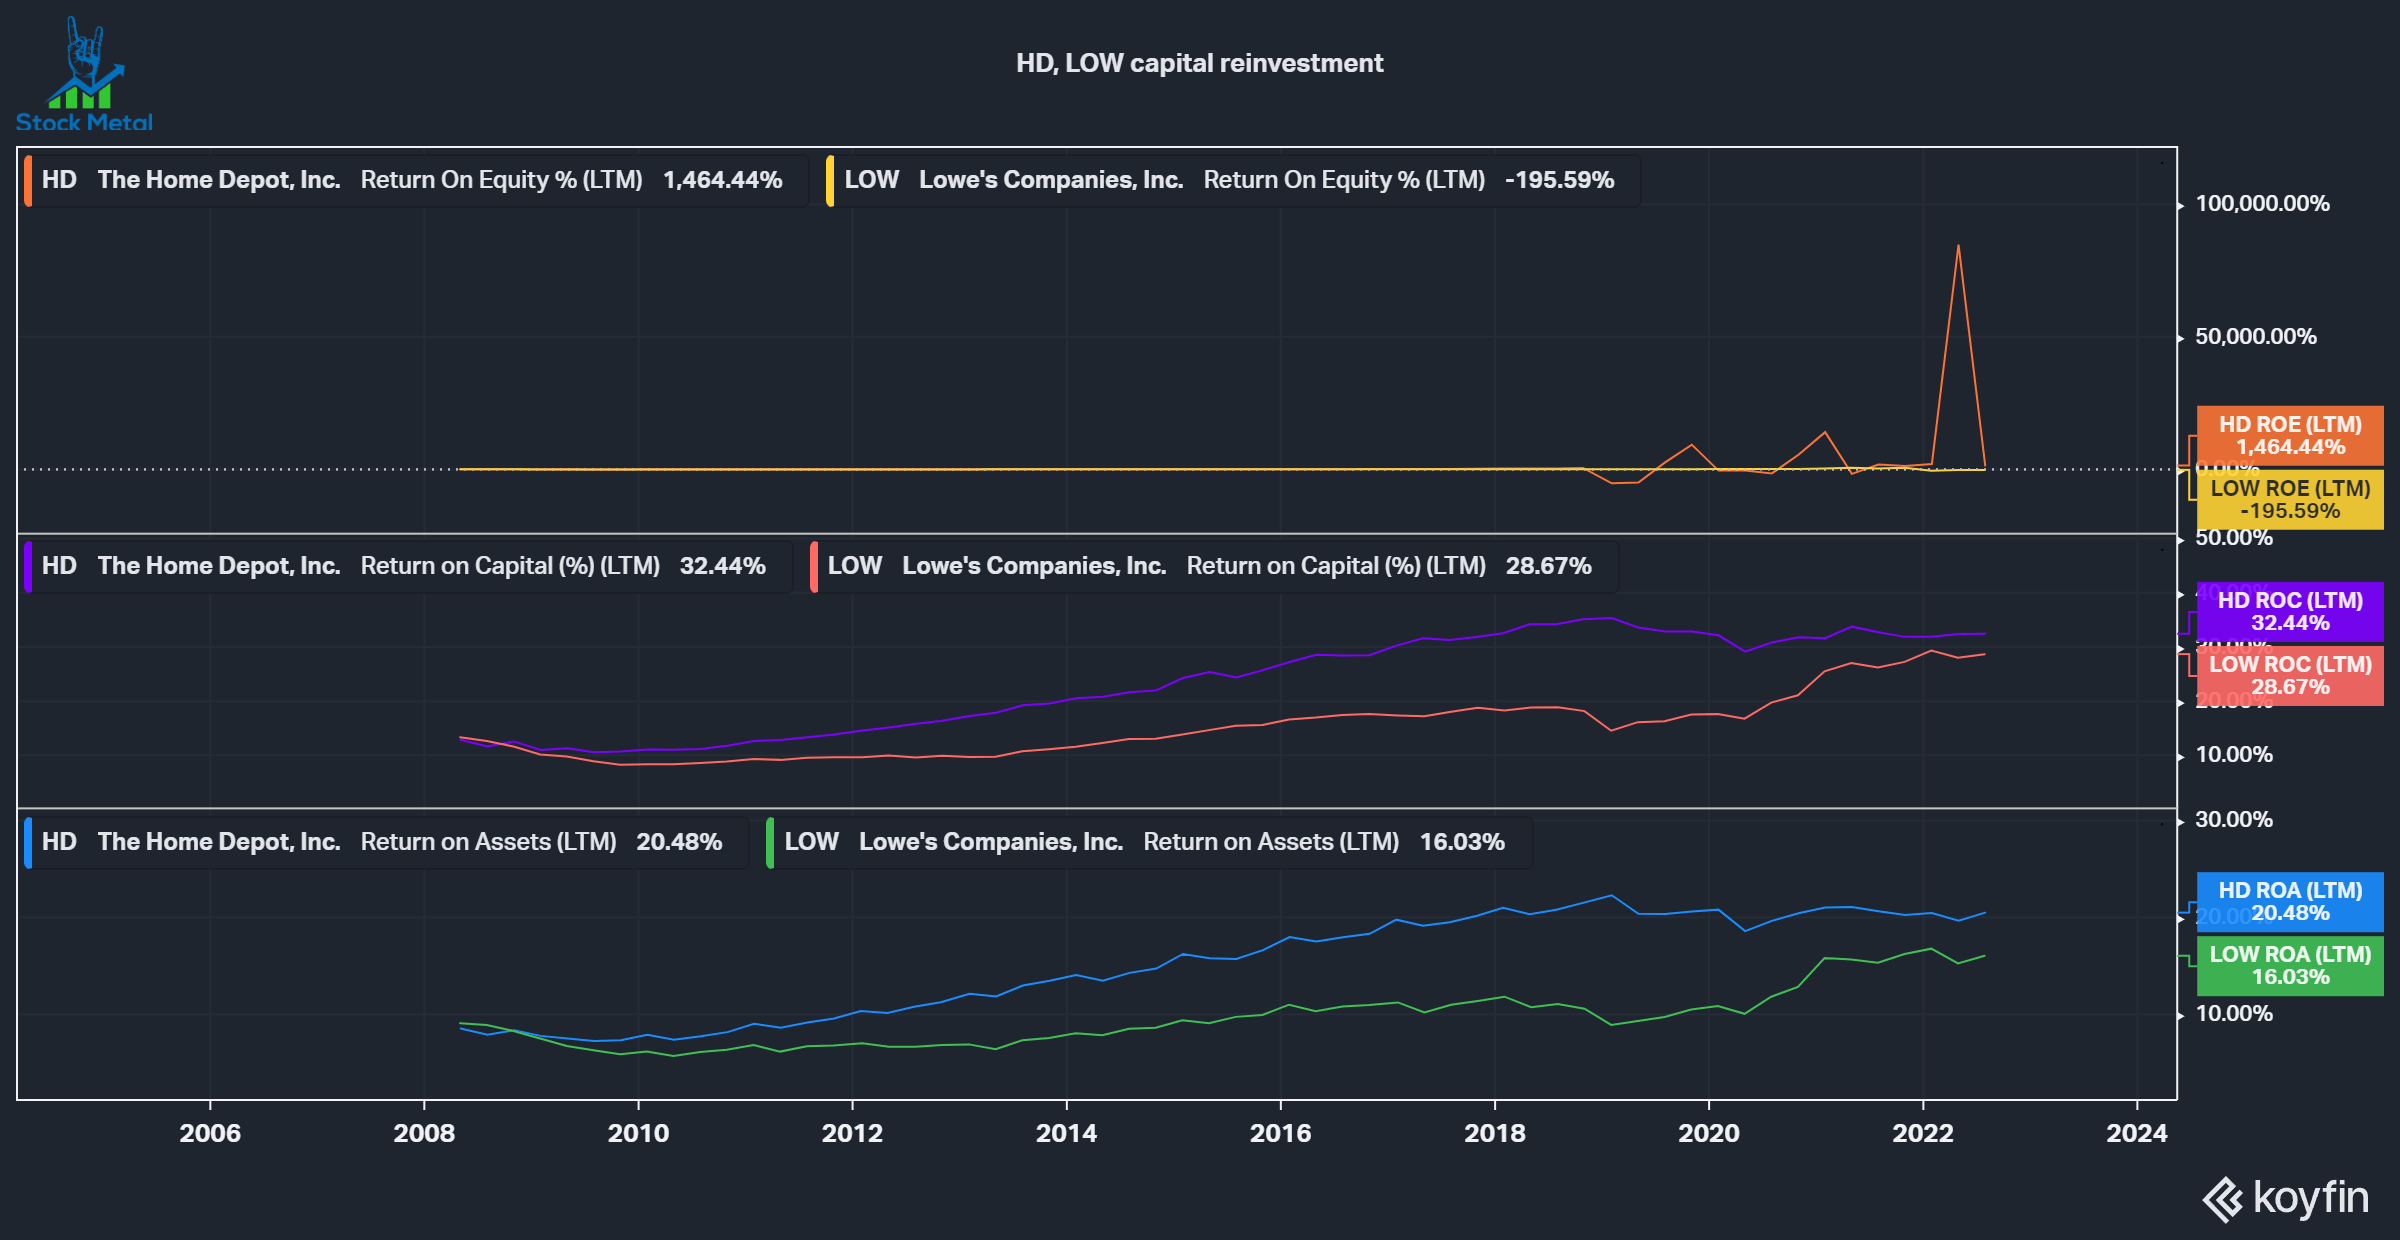
Profitability
At the end of the day, companies are just about the profits and cash flows that will be generated. We can see that both companies have gross margins of around 33% that are in a slight decline from 34% a decade ago. Both companies managed to grow the bottom line over the last decade, growing the EBITDA margin from 12% to 17% for HD and from 10% to 15% for LOW. The net income margin sees a similar story, with 5% to 11% margins for Home Depot and 4% to 9% margins for Lowe’s. We can also observe that Home Depot had a much more consistent improvement in margins, while Lowe’s progression has been a lot more volatile, especially around 2019. In this category, Home Depot has the edge, because of its higher consistency and higher margins.
HD, LOW Margins (Koyfin)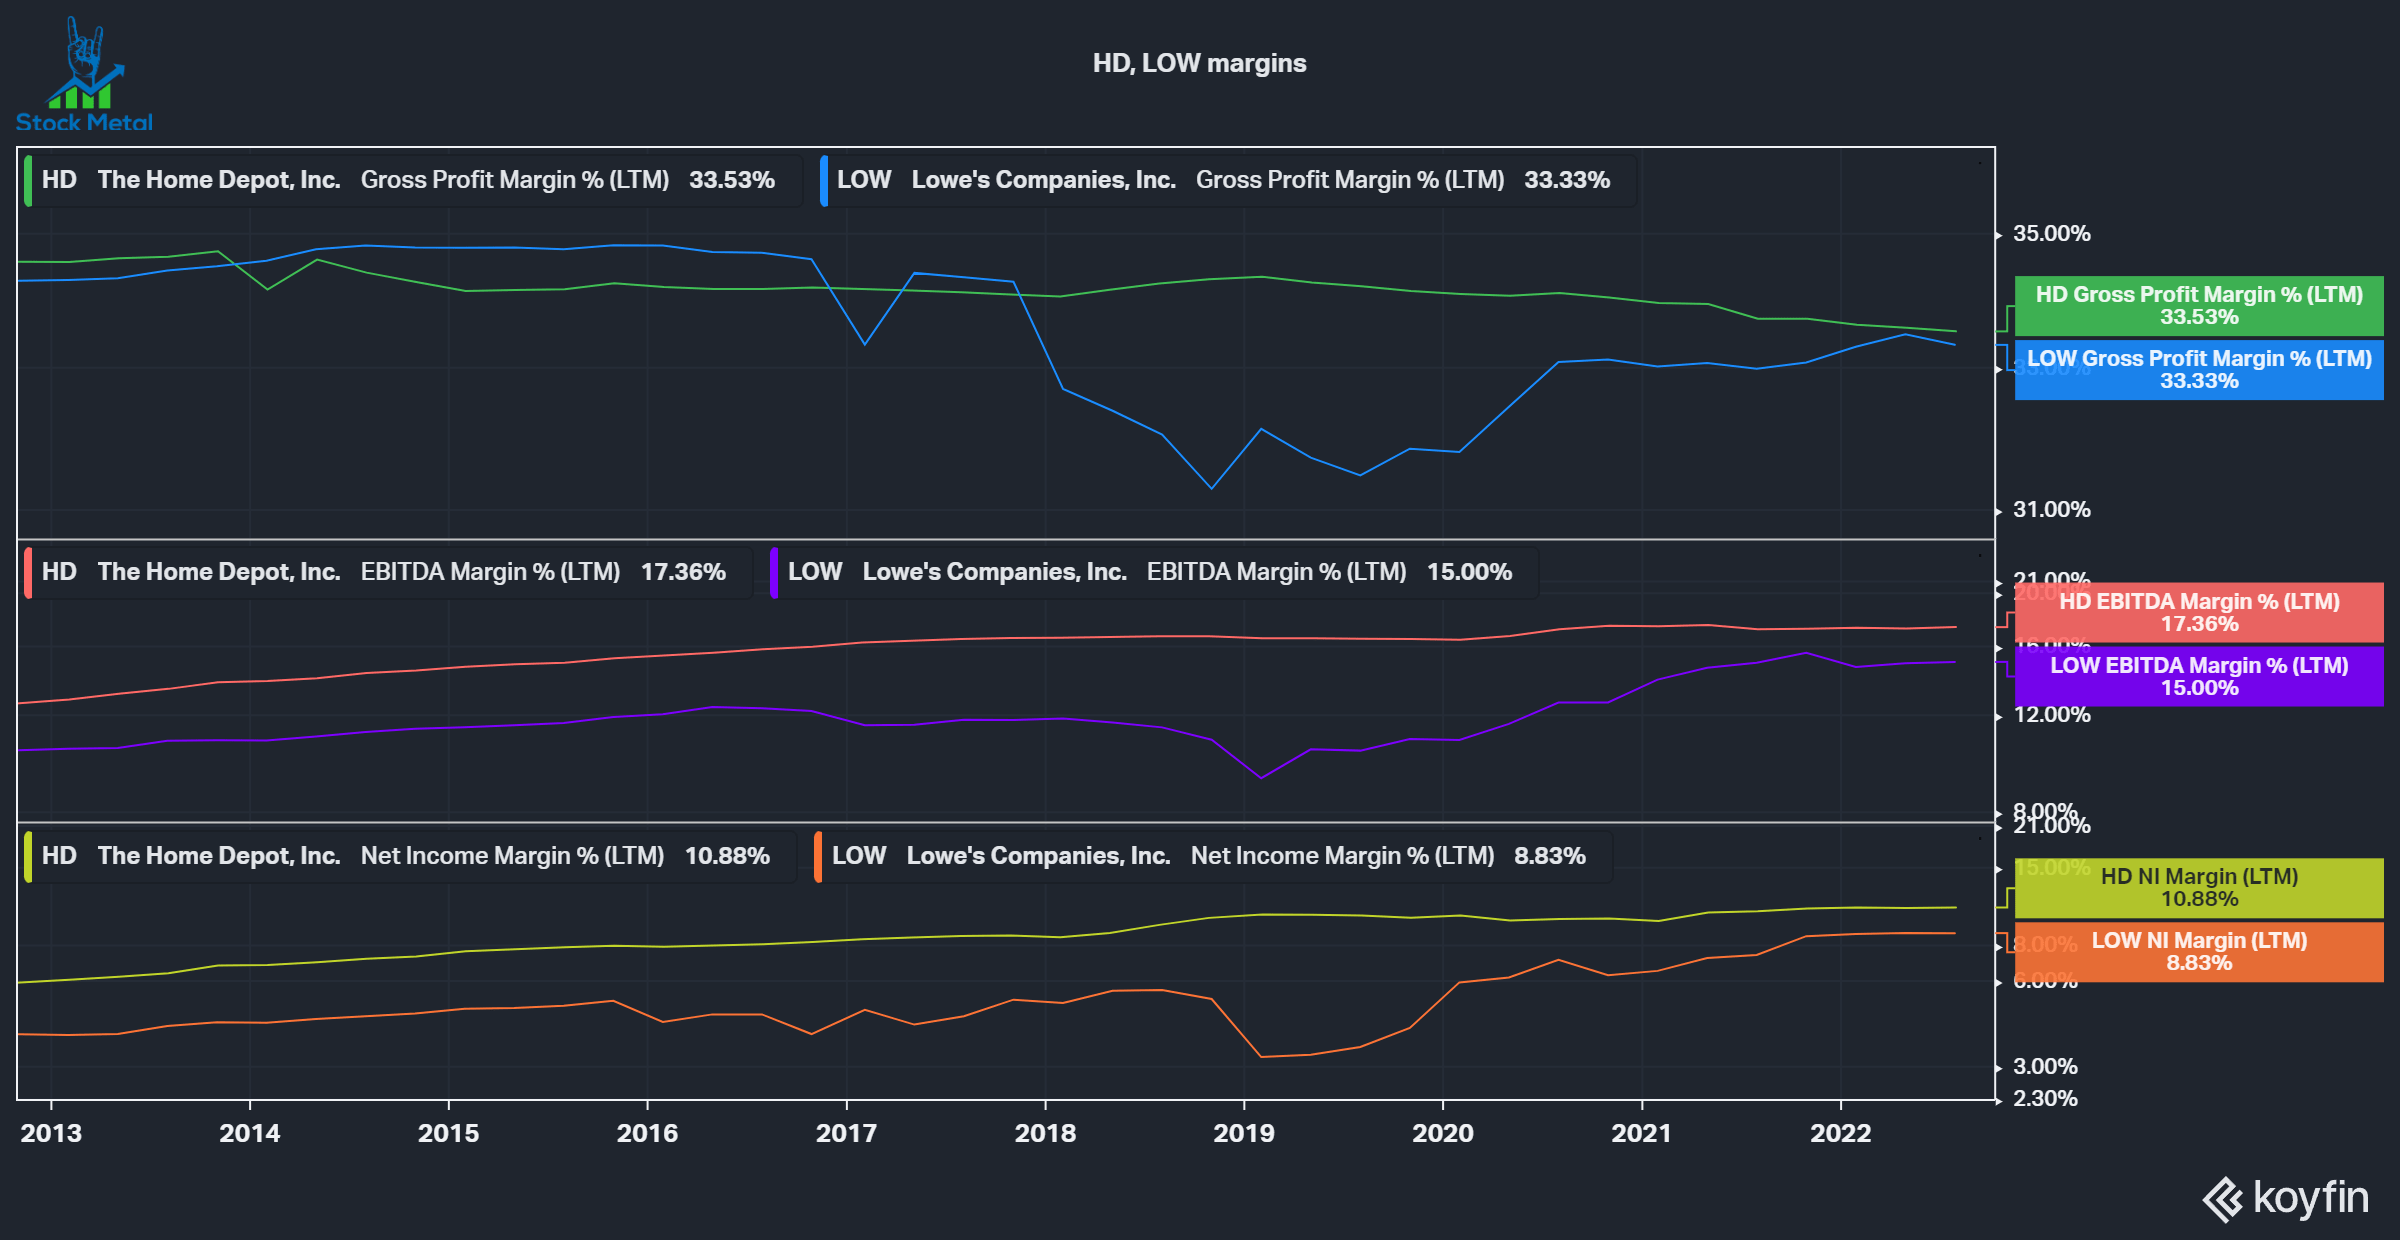
Growth
Good companies manage to grow their top line and bottom line over time, preferably every single year. We can see that both companies grew well. I look at 5-year CAGR so that extraordinarily good years don’t distort the results too much. We can see that HD managed to grow revenues faster than Lowe’s, but Lowe’s managed to grow net income significantly faster than Home Depot. This is a result of the margin expansions discussed in the margins section and aggressive share repurchases from both companies. Overall, Lowe’s gets this point due to the extraordinarily high 22% net income CAGR.
HD, LOW Growth (Koyfin)
Capital Returns
Besides share price appreciation, most companies return money to shareholders by buying back shares, paying dividends and paying down debt. We can see that both companies are very shareholder friendly. Over the last decade, Home Depot retired 32% of shares outstanding, while Lowe’s even retired 45%! At the same time, both companies paid a growing dividend, which is currently significantly above their 10-year median yield for both companies. Both companies also took on a lot of debt over the last decade, which I’ll address in the next segment. Acquisitions aren’t a big part of the business model, the most significant deal of the last decade being the $8.7 billion acquisition of HD Supply Holdings, a unit Home Depot sold to private equity back in 2007 and has now bought back. Both companies get a point, Lowe’s retired more shares, but Home Depot paid a much higher median dividend over the decade.
HD, LOW Capital Returns (Koyfin)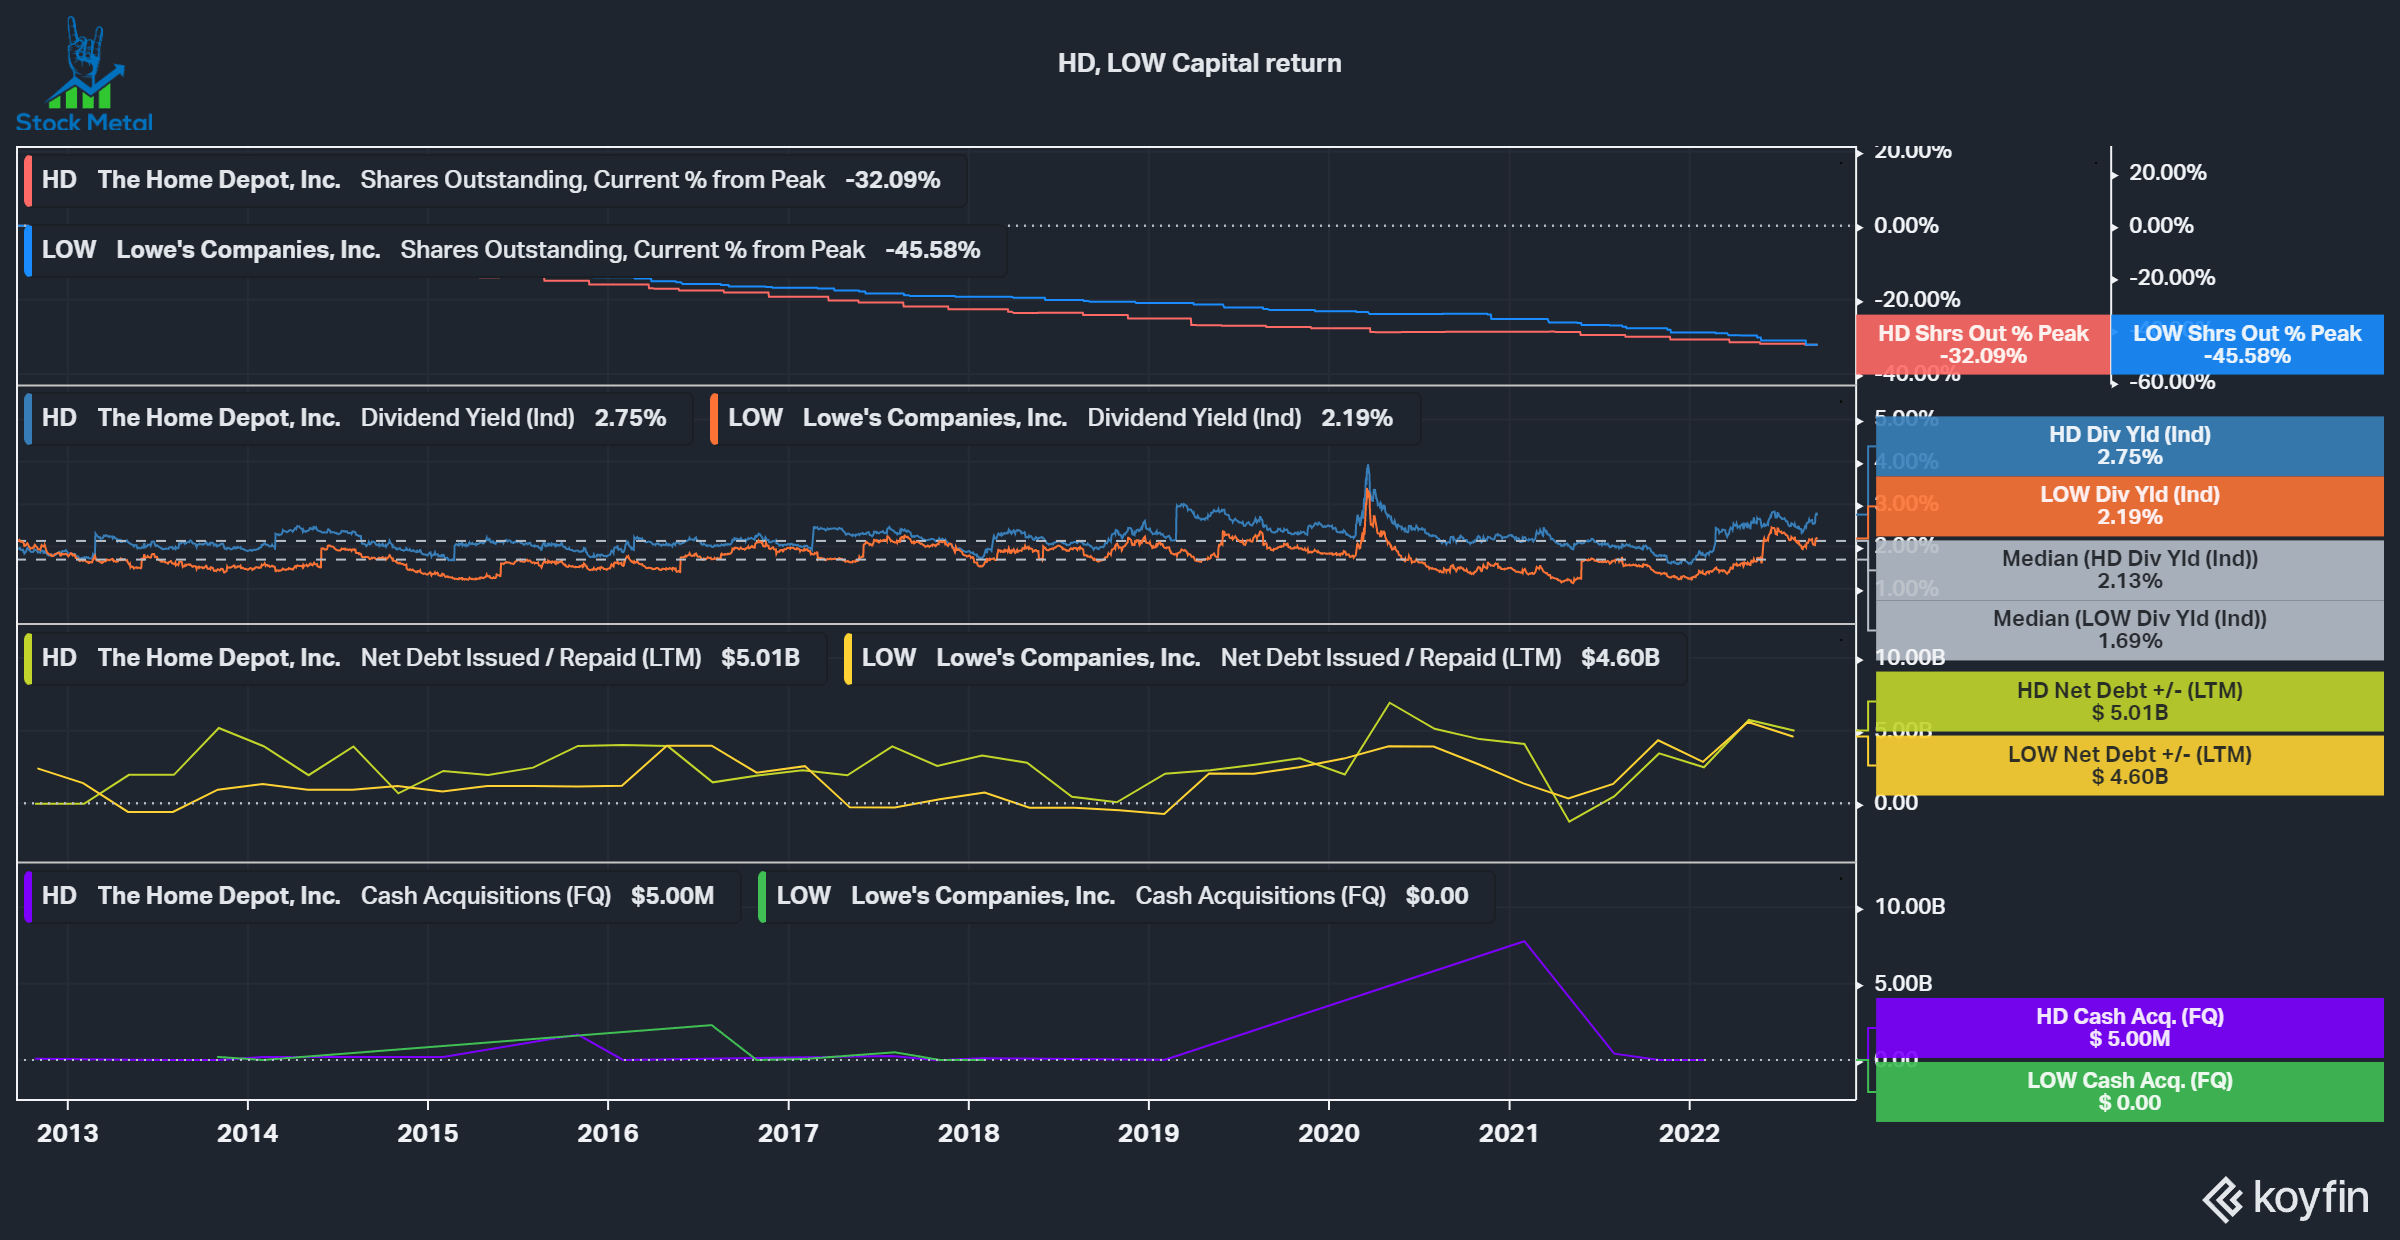
Balance Sheet Health
It’s important to keep a healthy balance sheet so that the company doesn’t run into solvency problems. We can see that over the last decade both companies took on a lot of debt, growing total debt from $10 to $48 billion for HD and $9 to $33 billion for LOW. Meanwhile, the cash balances have stayed low, around $1-$3 billion on average, except in early 2020, when both companies grew their cash balance to be well off during the lockdowns. Both companies grew their leverage ratios from 0.9x Net Debt/EBITDA to 1.6x for HD and 1.5x to 2.1x for LOW. These values are okay, I want leverage to stay under 2 times, but considering that both companies own lots of real estate I’d be okay up to 2.5 times. The Altman Z-Score is a score to calculate if a company is likely to go bankrupt. A value under 1.8 is concerning while anything over 3 means the company is healthy. With 4.6 and 7.4 both companies aren’t likely at risk of bankruptcy, even though they have large debt piles. I also looked at the inventory, an important metric for any retailer. Badly managed inventory reduces turnover and negatively impacts free cash flows. We can see that in the last two years, Home Depot seemed to struggle with fast-growing inventories, doubling from $13 to $26 billion. Lowe’s on the other hand managed its inventory better, seeing only a moderate increase in line with its long-term trend. Both companies get a point here. Home Depot has the edge due to lower leverage, but Lowe’s has shown better inventory management in the recent past.
HD, LOW Balance Sheet Health (Koyfin)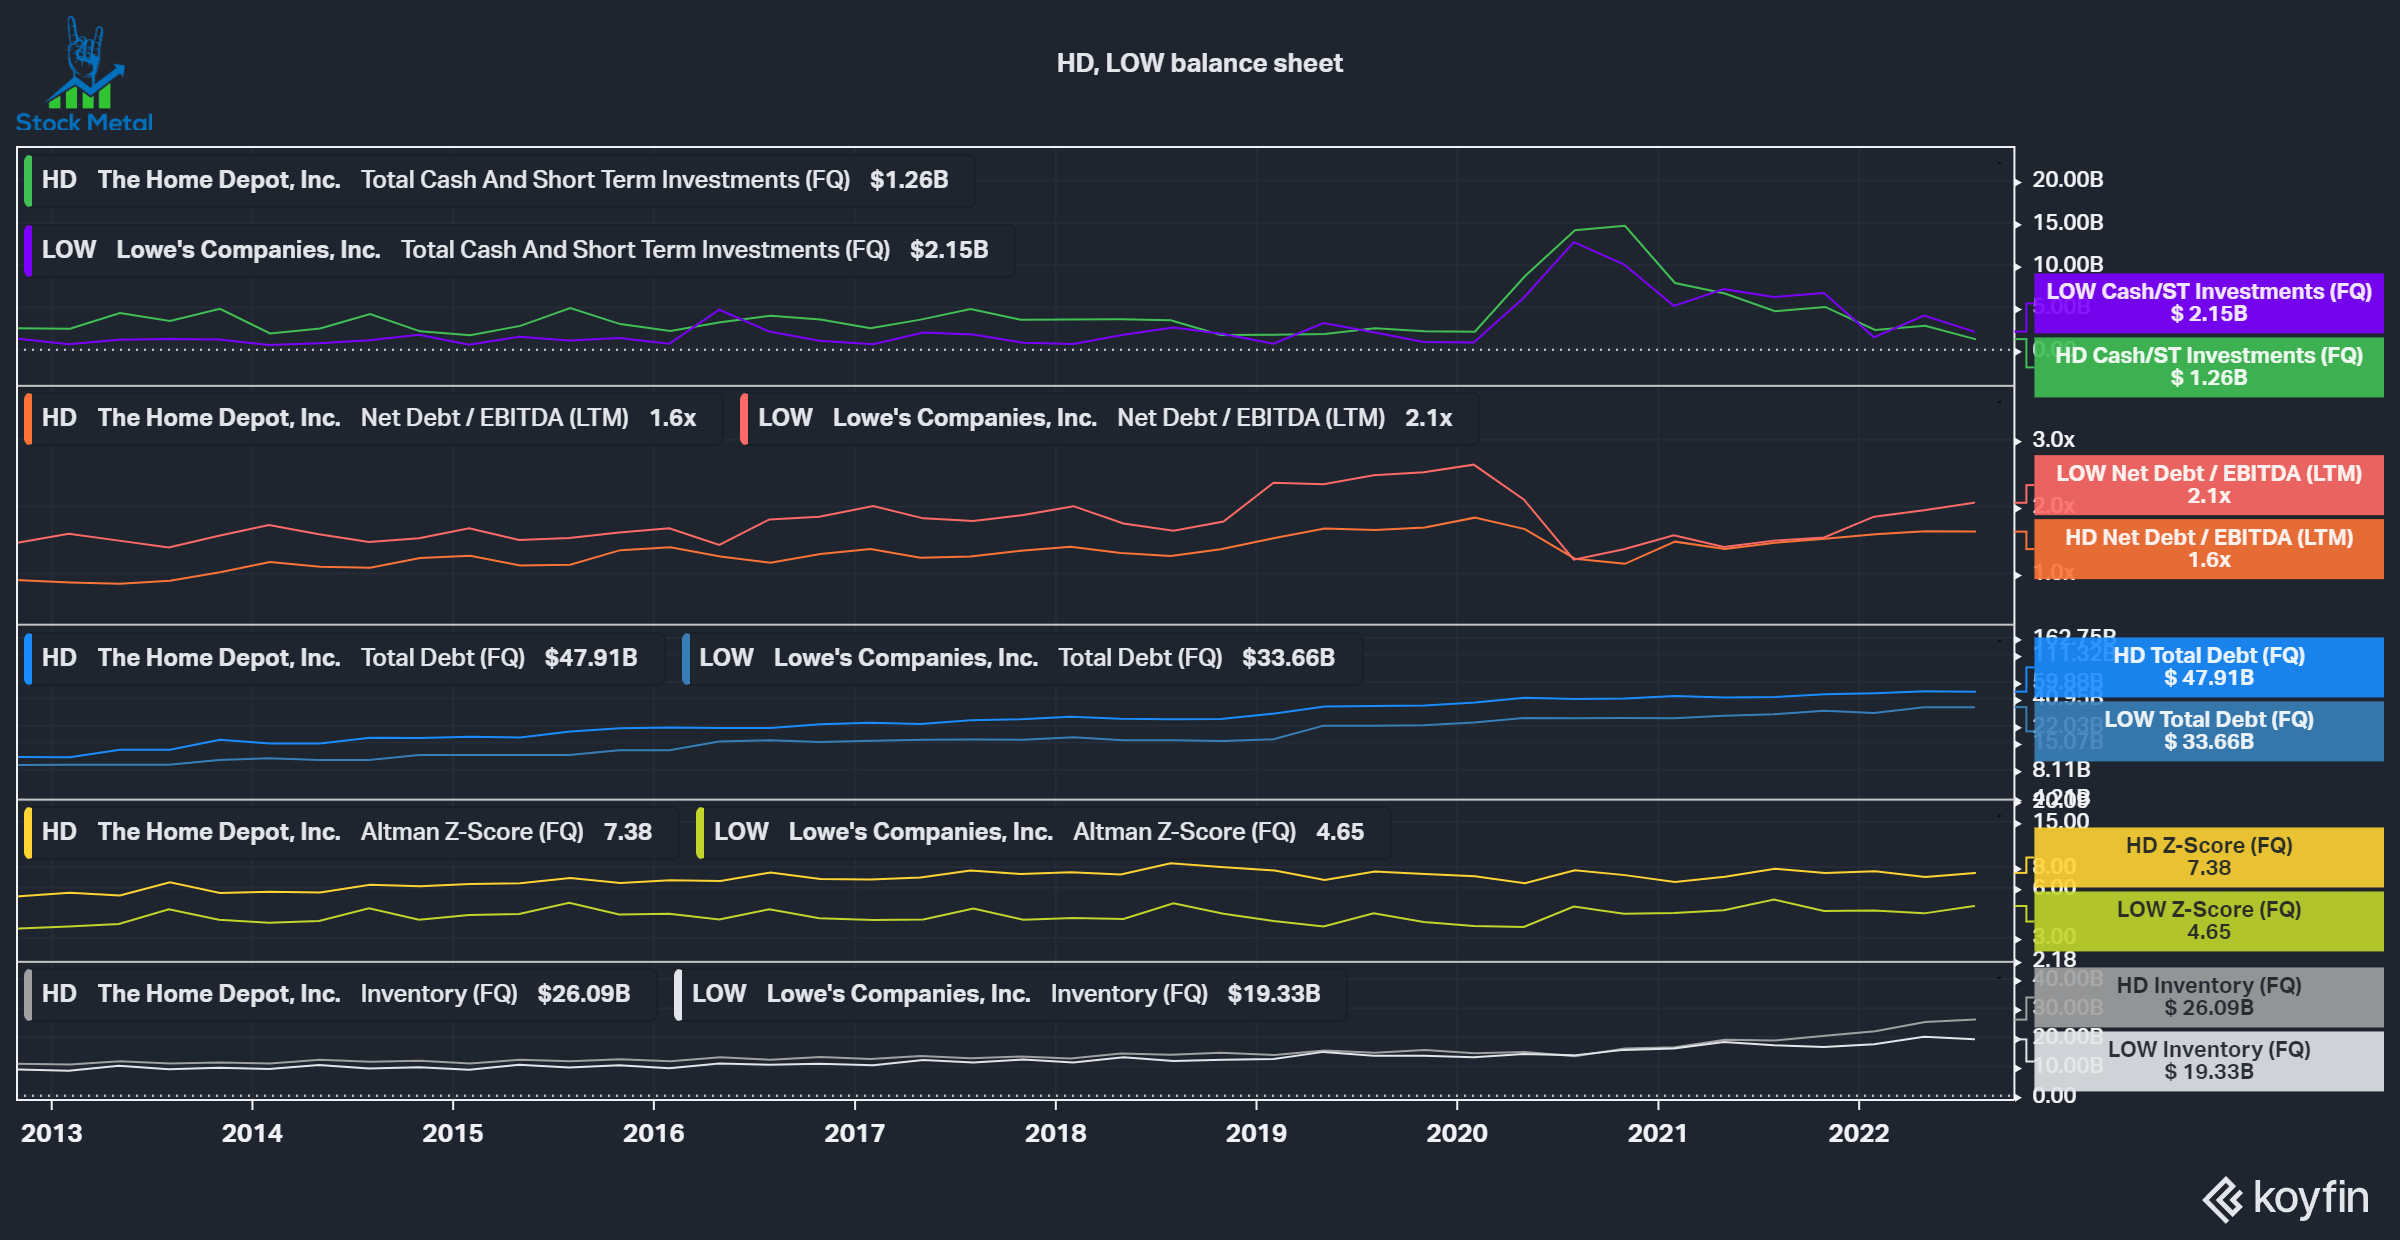
Valuation
Even a great company can be a bad investment at the wrong price. Fortunately, both companies trade at attractive levels based on their forward PE ratios being significantly under their median PE. The market is pricing in a tough recessionary environment into these multiples. Free Cash Flow Yields on the other hand are around the median for Lowe’s and a lot lower for Home Depot. This is likely a result of Home Depot’s poor inventory management, which negatively impacted Free Cash Flows. Both companies are down significantly from ATHs and offer a good opportunity if we won’t see a bad, drawn-out recession. Points for both companies.
HD, LOW Valuation (Koyfin)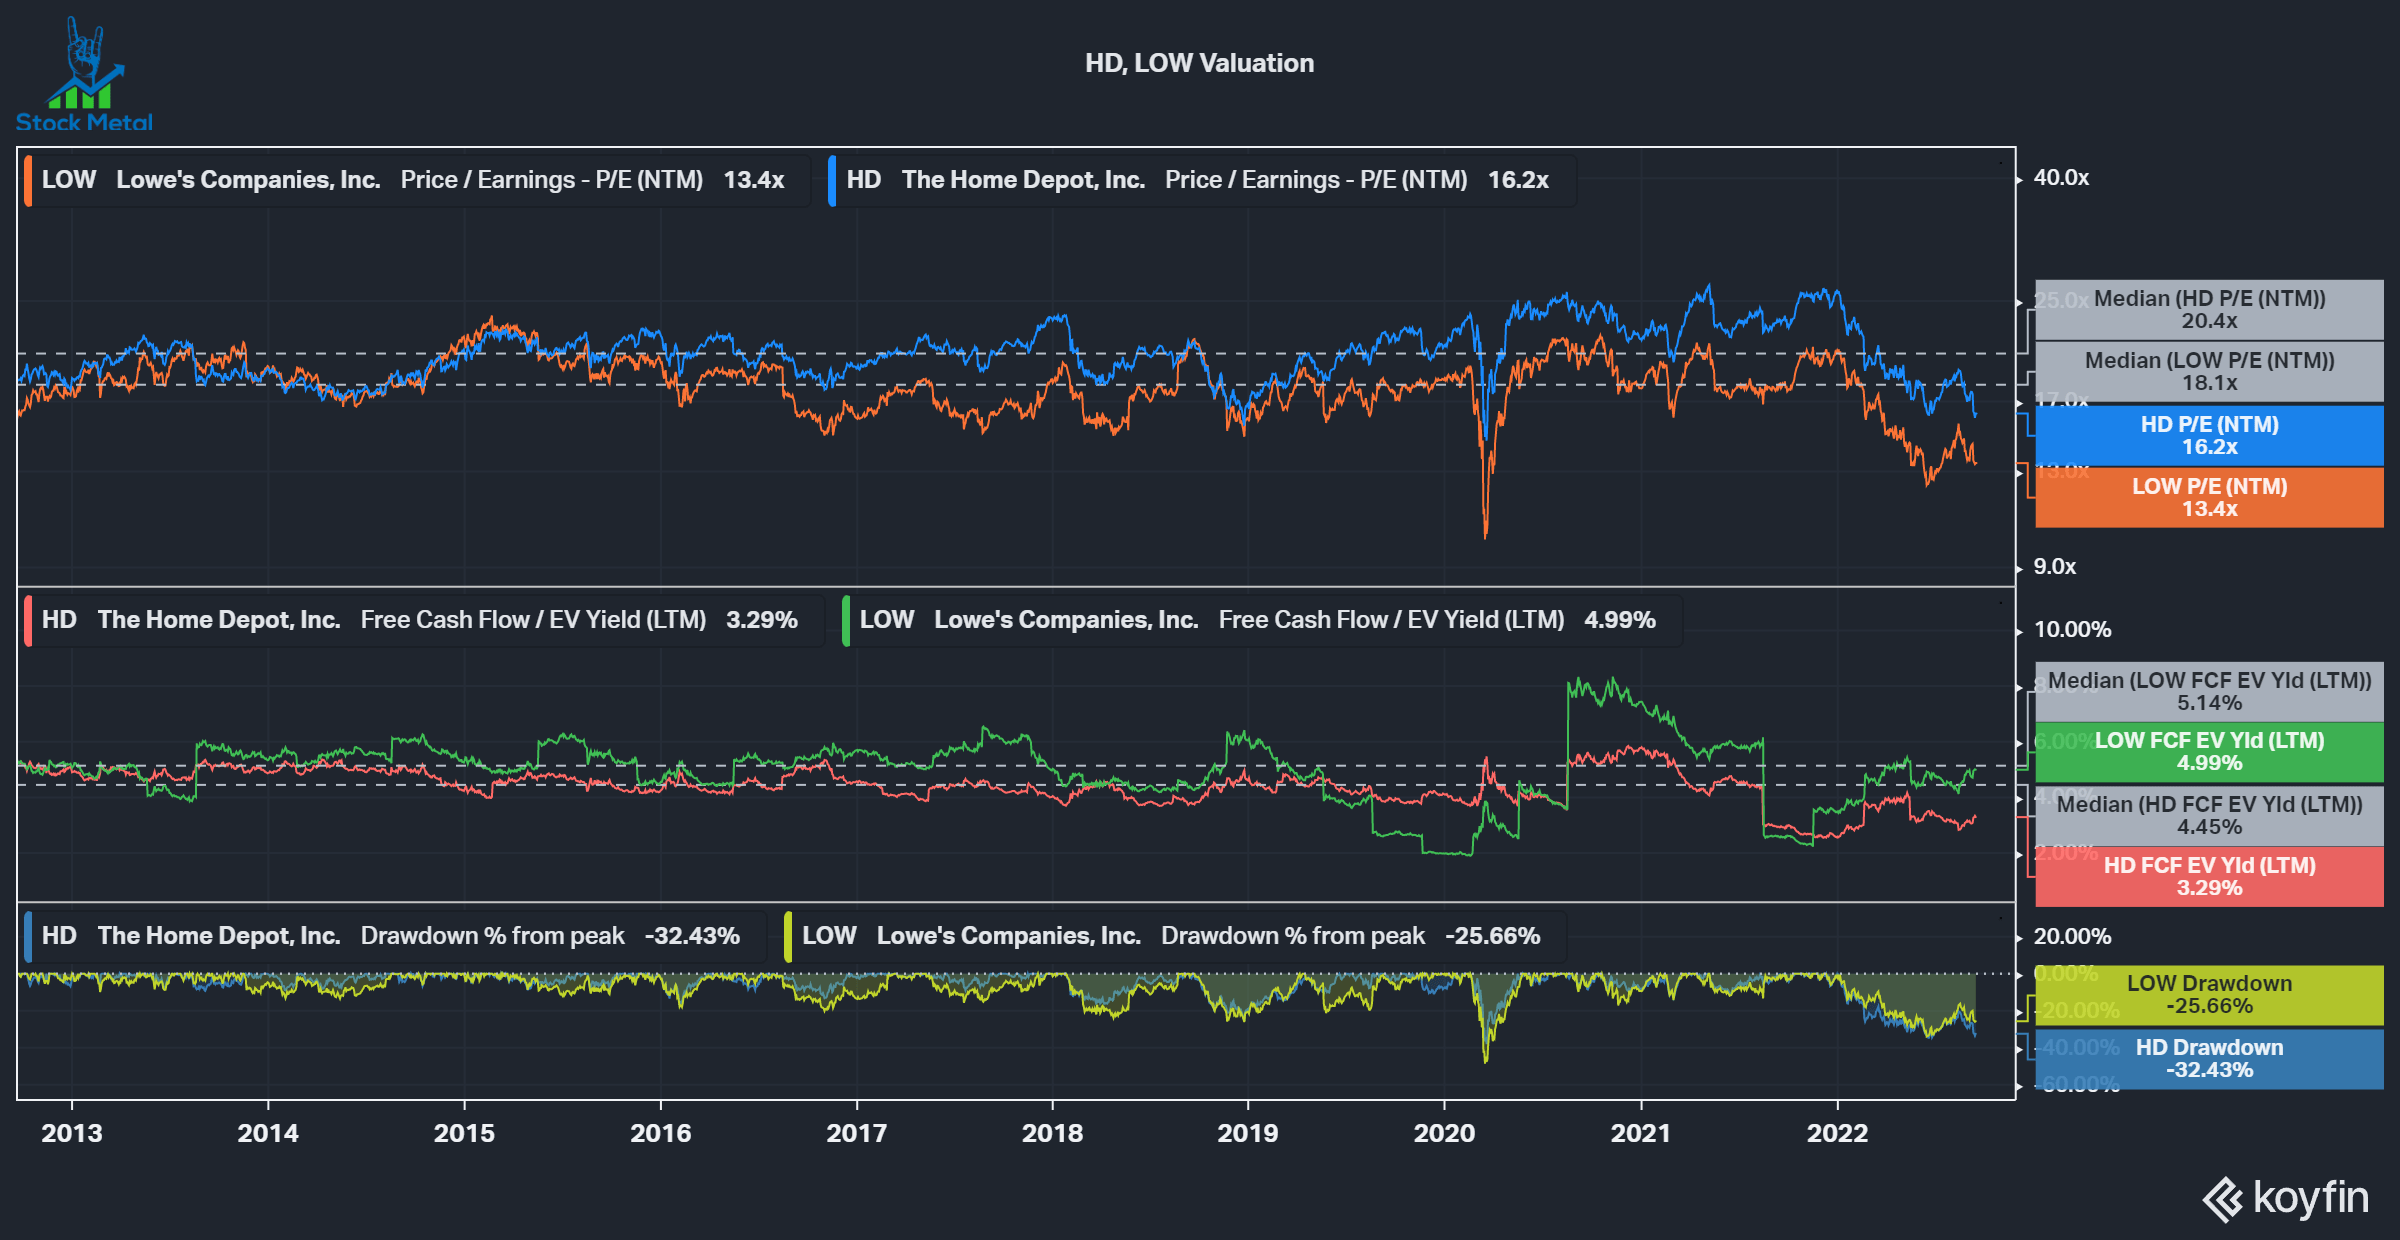
Conclusion
Home Depot and Lowe’s are both outstanding long-term compounders that enjoy a duopoly and have strong fundamentals. Home Depot has superior profitability, while Lowe’s has had better growth, but overall I rate both companies as a buy for a long-term hold. The current valuation is appealing unless we see a long recession. Then we could see significantly lower multiples.
| Home Depot | Lowe’s | |
|---|---|---|
| Capital Reinvestment | X | X |
| Profitability | X | |
| Growth | X | |
| Capital Returns | X | X |
| Balance Sheet Health | X | X |
| Valuation | X | X |
Be the first to comment