


da-kuk
Instead of an investment thesis
ZIM Integrated Shipping (NYSE:NYSE:ZIM) stock is arguably one of the most controversial in the stock market right now – despite massive cash balance, astronomically high margins/growth/profitability ratios, and some of the lowest valuation multiples in the entire Industrials sector, shareholders have been actively selling ZIM over the past month, resulting in total stock capitulation:

Seeking Alpha, ZIM
Despite this, I still hold the bullish thesis that ZIM is a good investment, even if the upward cycle reverses. Moreover, ZIM is even better in the medium term, despite the recent stock performance fiasco – that’s what this article is about.
Technical Analysis?
Since my last post on ZIM, in which I tried to reassure investors after the company’s earnings miss, the stock’s total return is down ~25%, compared to a decline of about 4% in the S&P 500 Index. I have been approached by some ZIM investors asking me if I have changed my mind – each time I have answered no. We all know Ben Graham’s quote that the stock market is a voting machine in the short run. But when your portfolio is down 15-20-30% mostly because of just one stock, you start to doubt that this machine will ever become a weighing one, which is absolutely normal thinking. So I usually add to my answer that you should try to limit the risk of severe drawdowns, no matter how much you believe in the stock you are buying. Otherwise, you should use the dollar cost averaging strategy or some other passive strategy to manage your capital.
For this reason, I have been spending more time lately on the technical side of any investment I make. In hindsight, I realize how unpleasant it is for me to see an unrealized loss of several dozen percentage points – with tactical portfolio positioning based on technical analysis, I consider such drawdowns possible but less likely.
The second reason I decided to write an entire article on ZIM’s technical analysis is the abundance of its fundamental coverage here on Seeking Alpha. I have read a lot of really great articles, like the ones by James Hanshaw and Julian Lin, that basically explain how I looked at ZIM before. You have probably also read a lot of articles about the fundamental appeal of ZIM, but from a technical perspective, the stock remains almost undiscovered.
Yes, technical analysis
Now that I have made my point, I would like to tell you and show you how I see the next development for ZIM stock.
Now, we are far from seeing the first sharp decline in this stock over the past year – something similar already happened in March 2022 after reaching an all-time high.
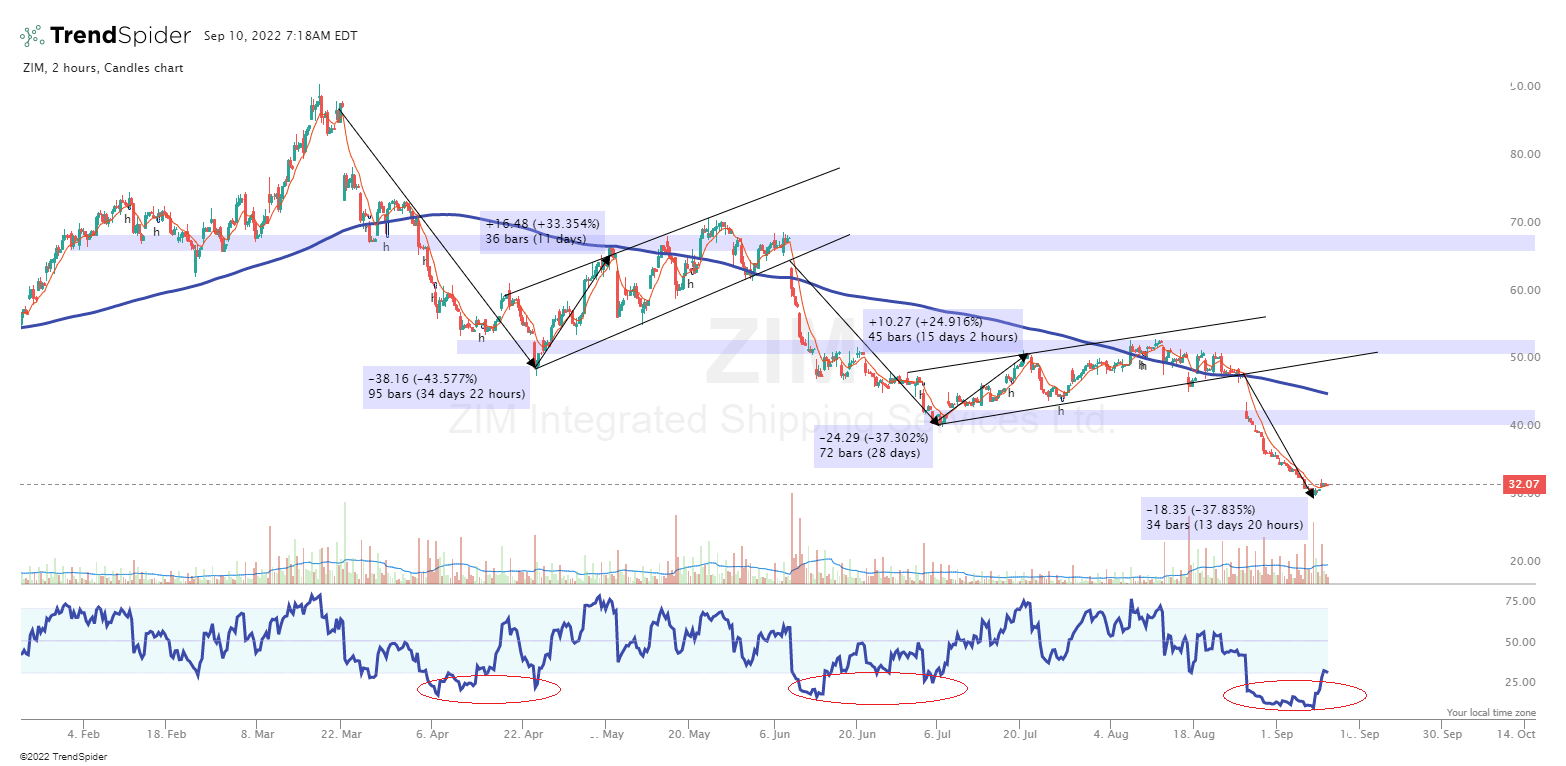
TrendSpider Software, ZIM (2 hours), author’s notes
Then, from the end of March to the end of April, the stock managed to fall about 44%. Moreover, the oversold levels were essentially ignored by market participants – selling continued until the RSI was below 20. Moreover, the last 3 strong sell-offs started after the dividend payment – each time the market did not believe that the strong dividend history could keep going in future periods:

TrendSpider Software, ZIM (daily), author’s notes
Putting the puzzle pieces of the different time frames together in my head, I can clearly see how the stock price has moved within the clearly defined upward channels (in the 2-hour chart), while it has not moved beyond its main downward price channel (daily chart). At the same time, on the shorter time frame, the price has been more “respectful” of the long-term moving average, returning to its boundaries every now and then.
Assessing the situation today, one can make the following conclusions:
- ZIM is heavily oversold on both the short-term and long-term timeframes;
- The price has reached the support level of the price channel on the daily chart;
- In analogy to the previous 2 periods with similar sell-offs (on the 2-hour chart), ZIM is ripe for a 25-30% reversal without breaking the boundaries of the main downward price movement.
The first two conclusions support the third, which is my main thesis. The price of ZIM fell lower and lower, each time managing to recover to the lows of the previous price channel – doing this about 2 weeks after reaching the bottom:

TrendSpider, ZIM (2 hours), author’s notes
I agree that it is impossible to catch the exact bottom. But in my opinion, an investor will not likely make a big mistake if he/she buys at the current level, because it is in such moments that the stock is saved by its fundamental profile. Buying ZIM at a drawdown is far from being the same as buying Nvidia (NVDA), because the valuations are completely different in favor of ZIM.
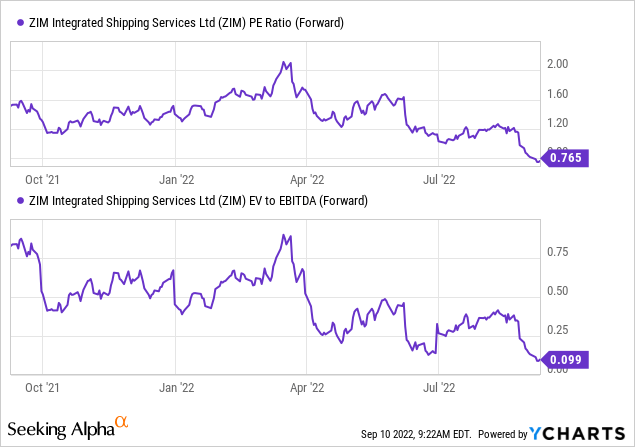
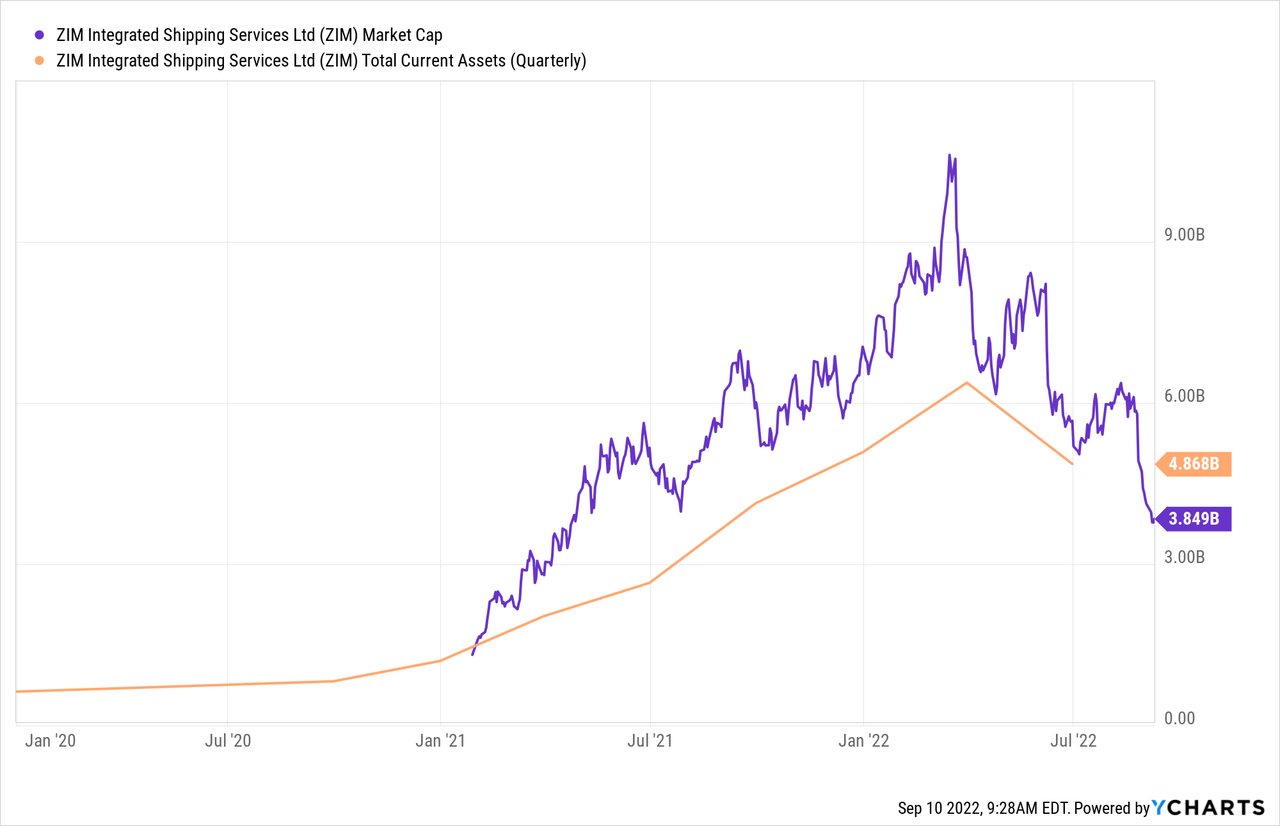
With an enterprise value of 10% of projected EBITDA, ZIM is currently valued by the market as if it will one day have to file for bankruptcy, which is absolutely not the case – the company can buy itself out of the market if it sells all of its current assets – this was last the case when ZIM just went public in early 2021:
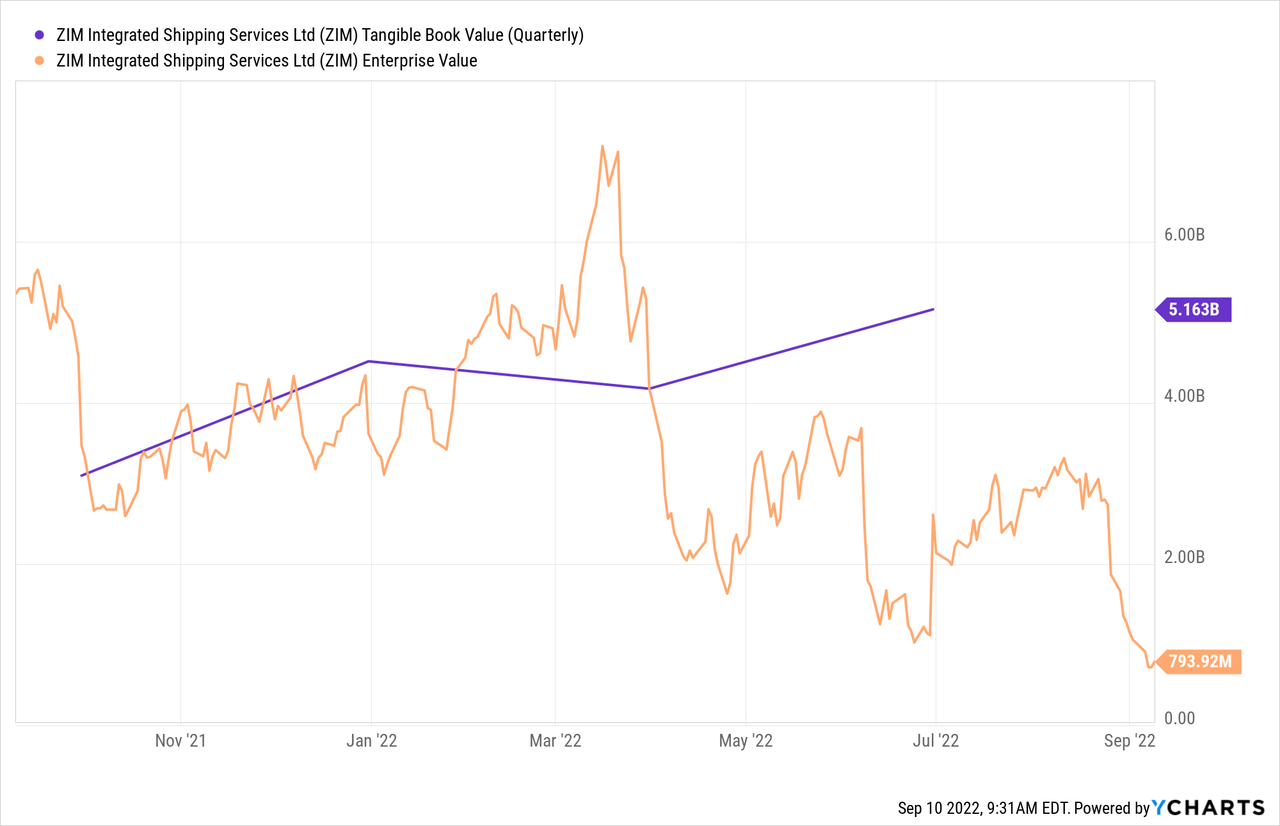
At the same time, the tangible book value at the time of this writing is 6.5 times higher than the enterprise value:
It looks like the market needs at least one piece of good news for ZIM shares to react upward – with the current oversold condition, investors will be eagerly awaiting any confirmation of such a wonderful buying opportunity, in my view.
Bottom Line
I am not a stock market technician, let alone a CMT charterholder. Therefore, take my article as a search for a good trading opportunity based on the generally accepted concepts of technical analysis, which is very often wrong – that is a risk every trader/investor has to live with.
The other risk of my thesis is the high probability that ZIM’s downward movement will continue – in the last two cases when the stock reached a strongly oversold RSI level, it still fell by about 15% before turning around. So I urge you to be careful here.
In any case, the technical analysis I have provided for your evaluation is a tool for all the bullish articles you may have read on Seeking Alpha in recent weeks. I wholeheartedly support the bullish fundamental view and do not want you to read what you have already read.
The last time I paid much attention to price action analysis was my recent article on Grindrod Shipping (GRIN) – a few weeks after my thesis was fully proven:

Backtesting from my recent piece on GRIN, July 13

Seeking Alpha, my article on GRIN, July 13
I hope I will be right this time too and we will see similar results together. Thank you for reaching the end of the article!
Final note: Hey, on September 27, we’ll be launching a marketplace service at Seeking Alpha called Beyond the Wall Investing, where we will be tracking and analyzing the latest bank reports to identify hidden opportunities early! All early subscribers will receive a special lifetime legacy price offer. So follow and stay tuned!
Author’s note: Special thanks to fellow SA contributor Danil Sereda (see our association in my bio description) for running the TrendSpider software to obtain the above information.
Be the first to comment