

deepblue4you/E+ via Getty Images
Investment Summary
The growth/value axis is often seen as an answer to the question of high/low earnings multiples. Wall Street analysts have done a good job over the decades in categorizing stocks as either growth or value based on the magnitude of their P/E [or other] ratios. Simply, ‘high P/E’ stocks are typically folded into the growth pile, whereas ‘low P/E’ names are allocated to the value pile. The terms high and low, respectively, often compared to industrial or broad market averages.
The issue with this categorization is that it does nothing to suggest why a stock may be trading [or deserves to trade] at a high or low earnings multiple. Sure, it could be wildly overvalued. Equally, however, it may very well be that a company deserves to trade at a low P/E – low earnings power, sluggish returns on capital, poor capital structure, to name a few. The same can be said for high P/E names.
We’d remind investors that a firm generates value for its equity holders when it delivers a consistently high [or growing] return on invested capital (“ROIC”) that is above the cost of capital. As another reminder, per Mauboussin (2013) the cost of capital is the rate at which at which we need to discount future cash flows in order to determine their value in today’s terms. It is also the hurdle rate a company needs to beat, to generate a positive return on its new capital investments, in order to grow without financing. Moreover, as investors, a company’s cost of capital could also be defined as the opportunity cost in the setting of a diversified portfolio of securities.
If a firm generates a ROIC above the cost of capital, it typically needs to reinvest a lower portion of post-tax earnings to achieve a stated growth rate. Moreover, it can sustain a higher growth rate over time, without hurting its valuation. Hence, we can deduce from these core tenets of corporate valuation that a company deserves a high P/E ratio if:
- It can achieve a reasonable–to-high growth rate;
- Generate a high ROIC, above the cost of capital;
- Therefore, will be required to reinvest a small portion of post-tax earnings to sustain the high growth rate;
- Meaning, the amount of free cash distributable to shareholders is high;
- Meaning, growth is accretive to valuation.
As such, it deserves a low P/E multiple if the opposite is true, regardless of the company’s YoY growth rates.
Thus, we can deduce from these concepts that an investment is one of ‘value’ if we are paying a fair or discounted price for the opportunity. Except, value is defined here as the company’s ability to distribute high amounts of free cash to its equity holders.
We noted that Hologic, Inc. (NASDAQ:HOLX), a long-term holding in our core portfolio, has rallied off its September FY22′ lows and now trades at 32x forward GAAP earnings. Question now, is this multiple justified or not?
Here I’ll run through why we believe HOLX remains a long-term buy, due to its ability to unlock future value, and that it is fairly priced. There is a key risk around semiconductors that investors must consider, however, and I’ll cover this in the first section.
Net-net we rate HOLX a buy. This is a name we are very familiar with. Check out our previous publications on HOLX here:
Breaking down HOLX’s profitability & value creation
Earlier it was mentioned that a high ROIC that exceeds the cost of capital is how a firm creates value. This is known as economic profit (“EP”), and is an economic reality, not just an accounting reality put out by firms each period. In order to understand this for HOLX, you have to note how it grows revenues in the first place.
HOLX’s top-line growth is a function of several drivers. First, its sale of medical imaging systems [including related components and software], coupled with the maintenance and support revenues on these. This, along with sales of disposables [diagnostic tests and surgical products]. In addition, service revenue is generated from laboratory testing services, booked under the molecular diagnostics segment. This is important for analysis under the risks discussed later.
Hence, for HOLX:
- Growth = new product sales + new related components + old maintenance revenue + new services
- Expanded, Growth = [new Disposables Sales + new capital equipment, components & software] + old maintenance revenue + new service revenue.
- Note: Growth also impacted by sales price[s], service charge[s]
This structure creates a tail on the distribution of revenues through the ongoing maintenance required, in addition to replacement components required to function its medical imaging systems.
Eyeing HOLX’s recent FY22 numbers, we calculated the economic profit, which has been positive over the past 10 years, even more so in the last 5-years to date [Exhibit 1]. Thus, it’s clear HOLX has generated a ROIC above its cost of capital across this time. [Note: the inputs to this calculation are observed in Appendix 1 at the end of this report.]
Exhibit 1. HOLX economic profit, 2018–2022
Note: FY21′ numbers abnormally high secondary to Covid-19 related sales. (Data: Author, using data from HOLX SEC Filings)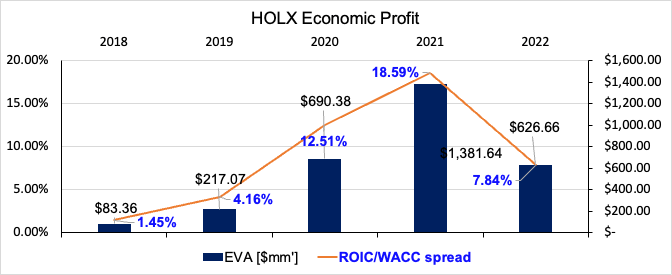
Growth in NOPAT and earnings can be traced back to two main drivers – how much a company invests in new projects, and the return it sees on these investments. On this, we’d point out that HOLX grew its annual NOPAT at CAGR ~15% over the last 10 years, whereas it grew earnings at CAGR ~54% over the same time [although, the latter’s result might be slightly skewed after coming off a loss of $1.17Bn in 2012/2013].
Although, as we mentioned, all growth is not created equally. Hence, the question is, what was required of HOLX in order to achieve these growth rates? Delving deeper into the numbers, we note that HOLX generated a cumulative $7.16Bn in NOPAT from FY12–22′, on a cumulative $5.21Bn in earnings [Exhibit 2]. These figures led to an additional growth of $1.02Bn and $1.28Bn in NOPAT and earnings, respectively. As a footnote, debt has also been a driver of HOLX’s earnings, hence, we’ll focus more on NOPAT to back this out of the equation.
Exhibit 2. HOLX cumulative NOPAT and invested capital, FY12–22′
Data: Author, using data from HOLX SEC Filings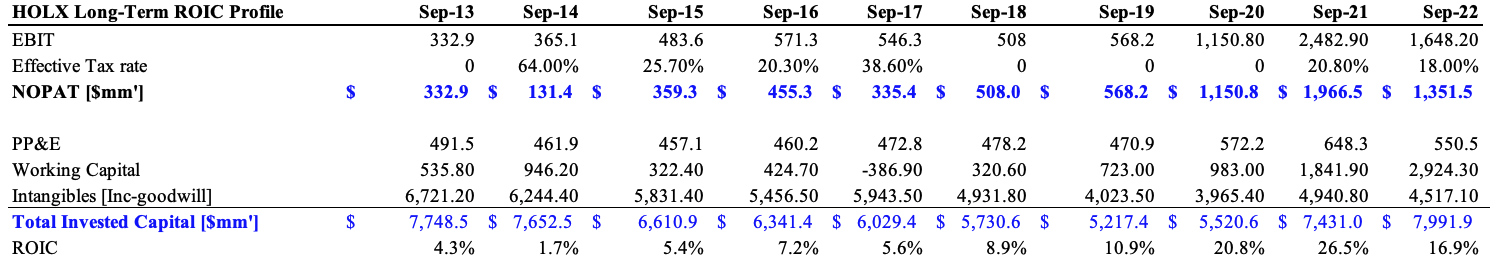
To achieve the stated NOPAT growth rates above, it only required to invest an additional $243mm in capital, leading to a tremendous 418% return on incremental invested capital (“ROIIC”) over the testing period [Exhibit 3]. Consequently, in order to achieve the stated level of profitability, it only required to reinvest 3.4% of its post-tax earnings, growing at CAGR 14.23% in doing so. This matches up tidily with the CAGR of ~14% in its stock price over this time.
Exhibit 3. ROIIC and reinvestment rate for HOLX, FY12–22′
Data: Author, using data from HOLX SEC Filings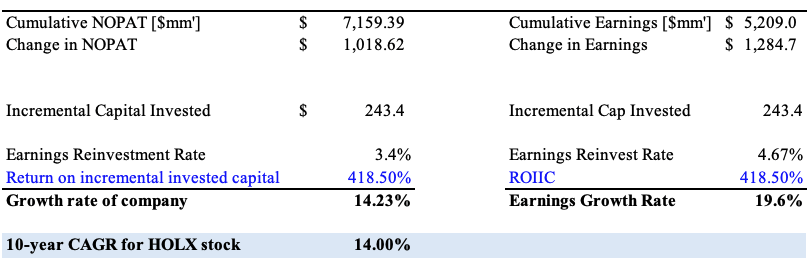
Noteworthy is that HOLX’s gross working capital includes 60% of current assets as on-balance sheet cash. This opens up an interesting debate. Cash is a non-operating asset that doesn’t generate operating income. Should we penalize HOLX for the high percentage of cash? Should it be investing this into new ventures/strategies?
The flip side is that the “excess cash” was generated from growth in cash from operations and net change in cash flow, at $1.17Bn in FY22′. There’s research that advocates to use 2–4% of sales as operating cash, classifying the remainder as excess cash. We did the same calculations as above after adjusting cash at 4% of sales, and both the reinvestment rate and ROIIC were negative. How can this be? Damodaran has a clear explanation of this when we extract the excess cash, where “[t]he reinvestment rate for a firm can be negative if its depreciation exceeds its capital expenditures…”. Such was the case for HOLX over the entire testing period [see: here]. Nevertheless, in any scenario, HOLX’s growth rate is calculated at 14.23% over the period.
Hence, the upside in the HOLX share price over the past 10-years to date looks more than justified.
Implications to HOLX valuation
Given HOLX’s EP over the last decade, all the achieved growth has been accretive to its valuation. This is reflected in the market’s pricing of its of its share price, as noted above. However, we don’t get paid for what’s already happened, it’s what is to come that matters in the present day. We can extrapolate some forward-looking data using assumptions from HOLX’s growth profile to date. Per Mauboussin (2022), the level of ROIC demonstrates a company’s maximum supportable growth rate, without factoring any external capital. We’ll take it that HOLX can therefore support the c.14% growth in NOPAT over the coming 5-years, meaning it needs to reinvest 3.4% of post-tax earnings to achieve this. As a result, ~96% of post-tax earnings are available to distribute to equity holders (“FCFE”). We can discount these at the cost of equity, where Richards (1991) illustrate can be derived from the combination of earnings yield and growth rates. These figures in mind, and at consensus FY23E’ earnings estimates of $1.48Bn, this justifies a P/E of 49.7x [Exhibit 4].
Exhibit 4. Estimated justified P/E of 49.74x with current growth and reinvestment rates
Data: Author’s Estimates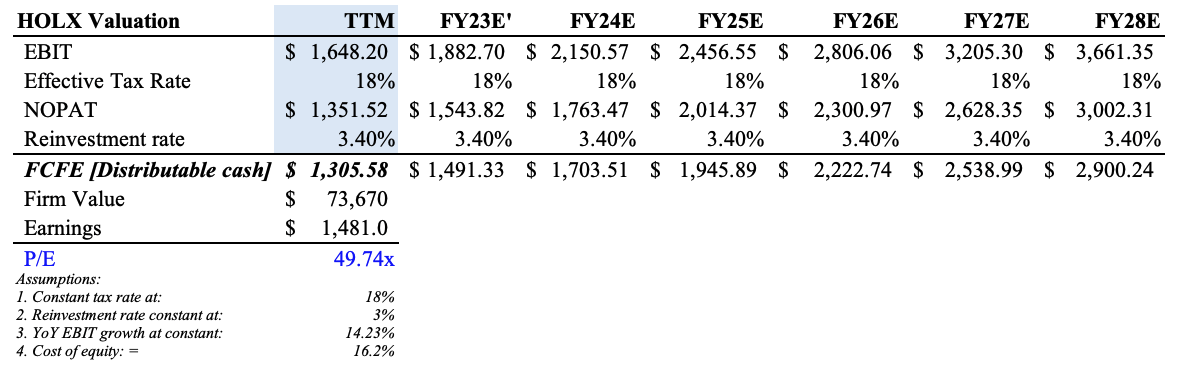
However, there’s a risk investors should recognize looking forward, and this relates to the recent geopolitics around global semiconductor distribution. Per HOLX’s 10-K:
“We are dependent on a small number of semiconductor manufacturers and their allocation of chips to us. Based on our current understanding of their allocation of chips to us we expect we will be able to increase production on a sequential quarterly basis throughout fiscal 2023. If such allocation does not meet our expectations or we are not able to obtain alternative sources of chips, we believe we will not be able to manufacture sufficient quantities of our capital equipment products, primarily 3D Dimension systems, Trident specimen radiography systems, Affirm Prone biopsy systems and Brevera systems to meet customer demand.”
Not only that, the last 2 years of HOLX’s revenues have been propped up by Covid-19 sales. Both factors could hurt disposables and medical imaging sales. Hence, there’s scope for the growth rate to pull back to the downside from FY23′. Clipping a full 100bps off our growth estimates, we still see HOLX fairly valued at 29.4x forward P/E, and the required reinvestment dips to ~3% to achieve this, presuming a constant ROIC of 16.8% – HOLX’s 5-year average. Therefore, we reiterate HOLX as a buy, revising our base case target to $104 [29.4x FY23E EPS consensus of $3.56] and upside case price target to $177 [49.7x FY23E EPS $3.56].
In short
Understanding the fundamental drivers of growth are essential in understanding a firm’s valuation, and propensity to deliver value down the line. We continue to rate HOLX a buy, noting the company’s strengths in generating economic profit, and ability to distribute free cash to equity holders. Rate buy, $104 price target in the base case, $177 target in the upside case.
Appendix 1. HOLX Annual Economic Value Added, 2018–2022
Data: Author, using data from HOLX SEC Filings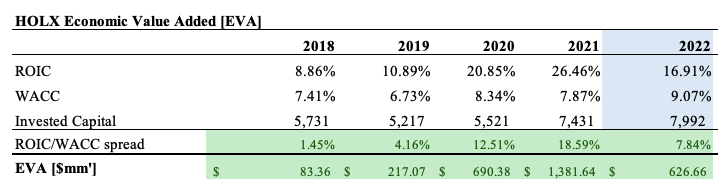
Be the first to comment